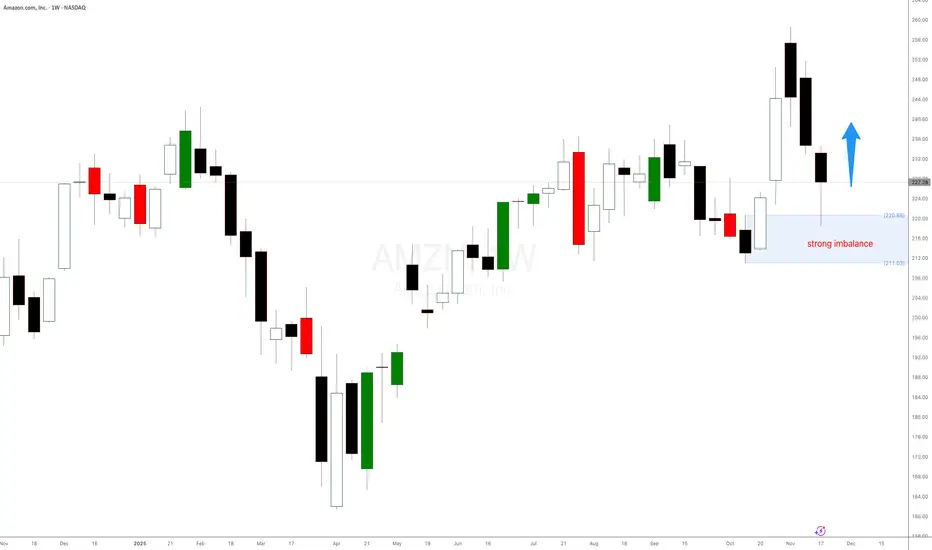
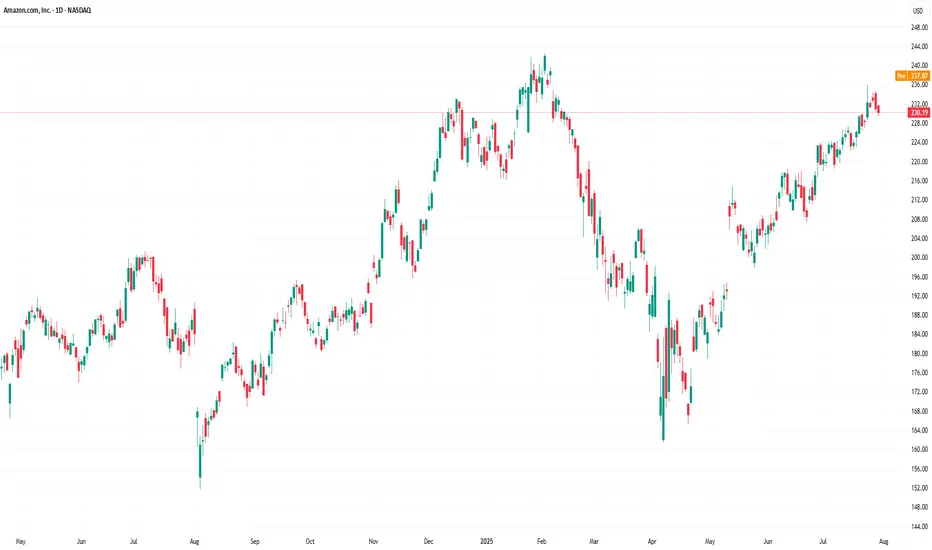
Amazon $AMZN weekly demand level at $221 is holdingAmazon weekly demand level at $221 is holding as expected. Amazon stock is trying to to print a new weekly high. Any long positions should be managed. Waiting for new imbalances and weekly highs.
Amzntrade

Amazon stock weekly demand is still in controlAmazon stock weekly demand at $221 is still in control and is trying to play out as expected. Any long positions should be managed. Let's see if there any new bullish legs printed in the following days.

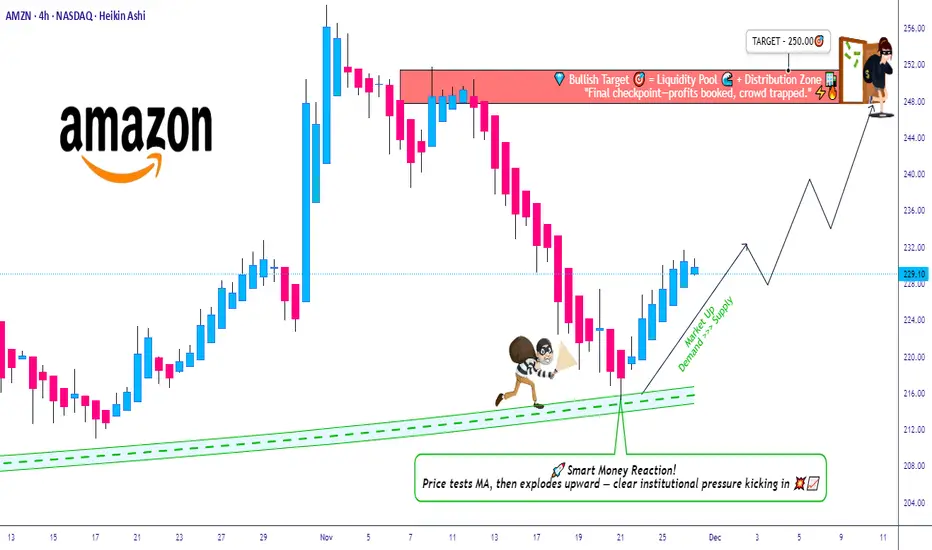
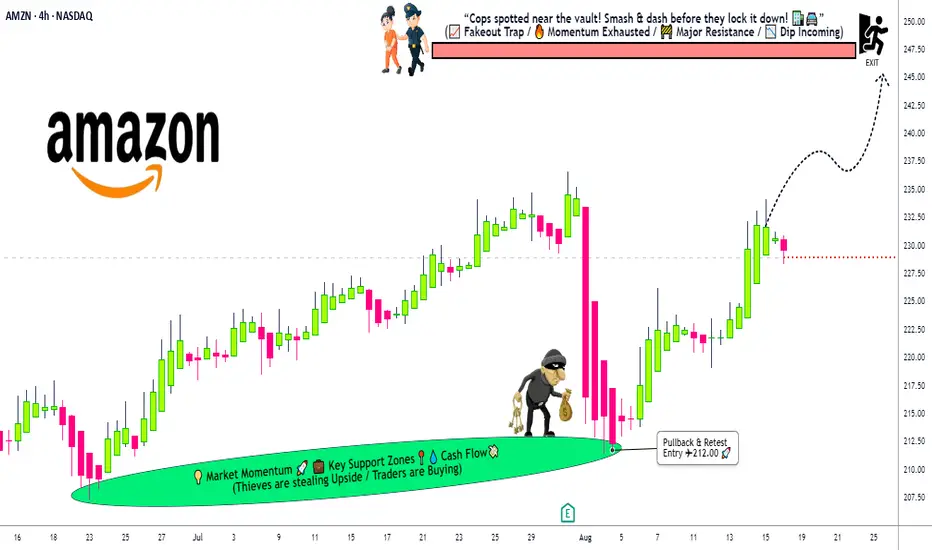
AMZN Breakout Reload? TMA Pullback Shows Buyer Strength🔥 AMZN Swing Trade Profit Playbook | Bullish Pullback + Thief Layering Strategy 🟢📦
Welcome back, Ladies & Gentlemen — the Thief OG’s 😎🕵️♂️
Here’s a polished, rule-friendly breakdown of the bullish setup developing on AMZN (Amazon.com Inc.) – NASDAQ.
📌 Market Context
AMZN is showing a clean bullish pullback into the Triangular Moving Average (TMA) zone, supported by a Heikin Ashi Doji Reversal, signaling that buyers are gaining strength and attempting to dominate momentum again. 📈🔥
🧠 Trade Plan (Swing Trade)
Plan:
A bullish pullback strategy confirmed by:
🔺 Triangular Moving Average pullback reaction
🟩 Heikin Ashi reversal-doji indicating potential trend continuation
📊 Buyers stepping in with momentum recovery
🎯 Entry Plan – Thief Style Layering (Multiple Limit Orders)
This is the famous Thief Strategy — using layered limit orders to scale into the move like a master of stealth 😎🕵️♂️💼
(TradingView-safe version: purely educational, optional, trade at your own risk.)
Layered Buy Limits:
🟢 215.00
🟢 220.00
🟢 225.00
🟢 230.00
(You may increase or adjust layers based on your own style and risk tolerance.)
🛑 Stop-Loss (Thief Style Educational Version)
SL Zone (Optional):
❌ 210.00
⚠️ Note: Dear Ladies & Gentlemen (Thief OG’s), this level is NOT a recommendation — it’s just part of the thief-style educational breakdown.
Choose your own risk plan, trade your own analysis.
🎯 Target Zone
The “Police Force” 🚓 — aka strong resistance, potential overbought zone, and liquidity trap area — sits around:
🟡 Target @ 250.00
⚠️ Note: Dear Ladies & Gentlemen (Thief OG’s), this is NOT a fixed TP recommendation.
Manage your profits as per your own risk appetite and strategy.
📡 Related Pairs to Watch (Correlation & Market Behavior)
Watching correlated tickers helps understand broader tech-sector sentiment and liquidity rotation.
Here are the key names to keep an eye on:
📌 NASDAQ:AAPL (Apple Inc.)
Strong correlation with AMZN in tech-momentum cycles.
When AAPL shows bullish continuation, AMZN often follows with similar pressure.
📌 NASDAQ:META (Meta Platforms Inc.)
Tracks consumer-tech spending sentiment.
Strong META moves can hint at acceleration across NASDAQ growth stocks.
📌 NASDAQ:MSFT (Microsoft Corp.)
A heavyweight pillar in NASDAQ.
MSFT strength boosts overall tech-index bullish bias.
📌 NASDAQ:QQQ (Invesco NASDAQ-100 ETF)
The main sentiment gauge.
If QQQ remains above its trend structure, AMZN's bullish continuation gets stronger confirmation.
📌 NASDAQ:TSLA (Tesla Inc.)
Not directly correlated, but impacts NASDAQ volatility dynamics.
High volatility in TSLA often ripples into liquidity behavior across the index.
💬 Final Thoughts
This AMZN setup blends structure, momentum, and multi-layer entries, crafted in a fun Thief-style teaching format while keeping everything compliant and research-focused 📚✨
Trade smart, manage risk, escape with profits when the “police” show up 🚓😆📈
✨ “If you find value in my analysis, a 👍 and 🚀 boost is much appreciated — it helps me share more setups with the community!”
⚠️ Disclaimer
This is a Thief-style trading strategy presented just for fun & educational purposes only.
Not financial advice. Do your own analysis and manage risk responsibly.
#AMZN #Amazon #SwingTrade #NASDAQ #BullishSetup #PullbackStrategy #HeikinAshi #TriangularMovingAverage #ThiefStrategy #LayeringEntries #TradingEducation #StockMarket #MarketAnalysis #TradingViewCommunity #EditorPickReady 🚀
Is Amazon exploding again? New weekly demand in controlIs Amazon exploding again? New weekly demand in control at $224. Expecting a decent rally from here in the following days.
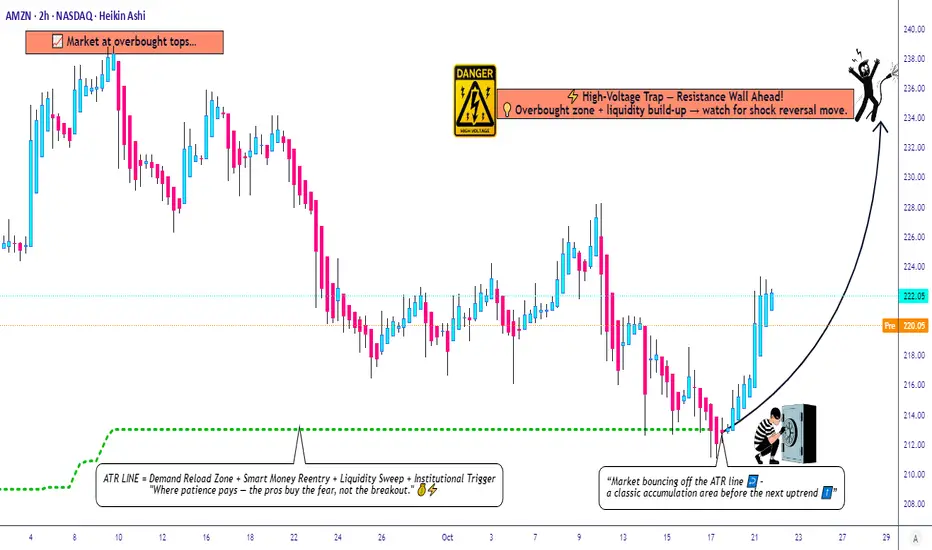
Amazon’s Hidden Pullback Opportunity – Smart Risk, Smart Entry🎯 AMZN: The "Thief's Playbook" — Stealing Profits Like a Wall Street Ninja
📊 Asset Overview
AMAZON.COM INC (NASDAQ: AMZN) — The E-Commerce Titan & Cloud King 👑
Strategy Type: Swing/Day Trade — Bullish Pullback Setup
Confirmation Tool: ATR (Average True Range) ✅
🎭 The "Thief Strategy" Explained
Listen up, Thief OG's! 🦹♂️ This ain't your grandma's single-entry trade. We're using layered limit orders — think of it like setting multiple traps to catch money at different price levels. Professional? Yes. Legal? Absolutely. Stylish? You bet! 😎
🔥 Entry Zones — The Multi-Layer Trap
The Thief's Ladder Entry Method:
You've got options, trader! Pick your poison:
Option 1: Aggressive Single Entry
Jump in at current market price (~$220-$225 zone)
Option 2: The Layered "Thief" Method 🎯
Set multiple buy limit orders to scale in:
Layer 1: $220
Layer 2: $218
Layer 3: $216
Layer 4: $214
Why layer? Because markets don't move in straight lines, baby! This lets you average down if price dips while maintaining a solid risk profile. Add more layers based on your risk appetite! 🍰
🛑 Stop Loss — Protecting Your Loot
Thief's Emergency Exit: $210 🚨
⚠️ IMPORTANT DISCLAIMER:
Dear Ladies & Gentlemen (my fellow Thief OG's), I'm NOT telling you to blindly follow my stop loss. This is MY risk management. YOU manage YOUR money. Trade at your own risk — this is entertainment with charts, not financial advice! 🎲
🎯 Target Zone — Where We Cash Out
⚡ High-Voltage Trap Alert — Resistance Wall Ahead! ⚡
Target Price: $235 🎯💵
Why this target?
💡 This zone shows classic signs of:
Strong resistance from previous price action 🧱
Overbought conditions brewing (RSI warming up) 📈
Liquidity build-up (big money sitting here) 💰
Potential "bull trap" zone → smart money escapes here! 🪤
My advice? When price hits $235, secure your profits! Don't get greedy.
⚠️ ANOTHER DISCLAIMER:
Dear Thief OG's, this is MY target based on MY analysis. You do YOU. Take profits when YOU feel comfortable. Your money, your rules, your risk! 💪
🔗 Related Assets to Watch
Keep an eye on these correlated movers — they can give you early signals for AMZN's direction:
📦 E-Commerce & Tech Giants:
NASDAQ:TSLA (Tesla) — Tech sentiment leader; when tech rallies, AMZN often follows 🚗⚡
NASDAQ:MSFT (Microsoft) — Cloud competitor (Azure vs AWS); inverse correlation sometimes kicks in ☁️
NASDAQ:GOOGL (Alphabet) — Ad spending indicator; strong Google ads = strong consumer spending = bullish for AMZN 🔍
NYSE:WMT (Walmart) — Retail competitor; if WMT struggles, AMZN often benefits 🛒
📊 Market Indices:
NASDAQ:QQQ (Nasdaq 100 ETF) — AMZN is heavily weighted here; QQQ direction = AMZN direction 📉📈
AMEX:SPY (S&P 500 ETF) — Overall market health check; risk-on = AMZN rallies 🇺🇸
💵 Market Sentiment Indicators:
TVC:VIX (Volatility Index) — Low VIX = calm markets = bullish for growth stocks like AMZN 😌
TVC:DXY (US Dollar Index) — Weak dollar = bullish for mega-cap tech stocks 💵📉
The Correlation Play: If you see NASDAQ:QQQ breaking higher + TVC:VIX dropping + tech stocks rallying → high probability AMZN follows the party! 🎉
🧠 Key Technical Points
✅ ATR Confirmation: Volatility is in the "sweet spot" — not too choppy, not too sleepy
✅ Pullback Structure: Classic bullish retracement setting up
✅ Risk-Reward: Solid 2:1+ ratio with layered entries
✅ Volume Profile: Watching for confirmation on breakout
⚠️ Legal Disclaimer — Read This Twice! 📢
THIS IS THE "THIEF STYLE" TRADING STRATEGY — JUST FOR FUN & EDUCATIONAL ENTERTAINMENT! 🎭
I am NOT a financial advisor. This is NOT financial advice. This is a trading idea based on technical analysis, shared for educational and entertainment purposes only.
❌ Do NOT risk money you can't afford to lose
❌ Do NOT trade based solely on this idea
❌ Do your own research (DYOR)
❌ Past performance ≠ future results
✅ Trade responsibly and manage your risk
You are 100% responsible for your own trading decisions. I'm just a chart nerd sharing ideas with the community! 🤓📊
💬 Final Thoughts from Your Friendly Neighborhood Chart Thief
Markets are a game of patience, discipline, and calculated risks. The "Thief Strategy" is about being strategic, not reckless. Set your traps, manage your risk, and let the market come to you! 🕸️💰
Stay sharp, stay profitable, and remember: the best trades are the ones you plan, not the ones you chase! 🏃♂️💨
✨ If you find value in my analysis, a 👍 and 🚀 boost is much appreciated — it helps me share more setups with the community!
#AMZN #Amazon #StockMarket #SwingTrading #DayTrading #TechnicalAnalysis #BullishSetup #LayeredEntry #ThiefStrategy #TradingIdeas #ATR #ResistanceZone #TakeProfit #RiskManagement #NASDAQ #TechStocks #PullbackTrading #PriceAction #SupportAndResistance #TradeSmart
Trade safe, trade smart, and let's get this bread! 🍞💸
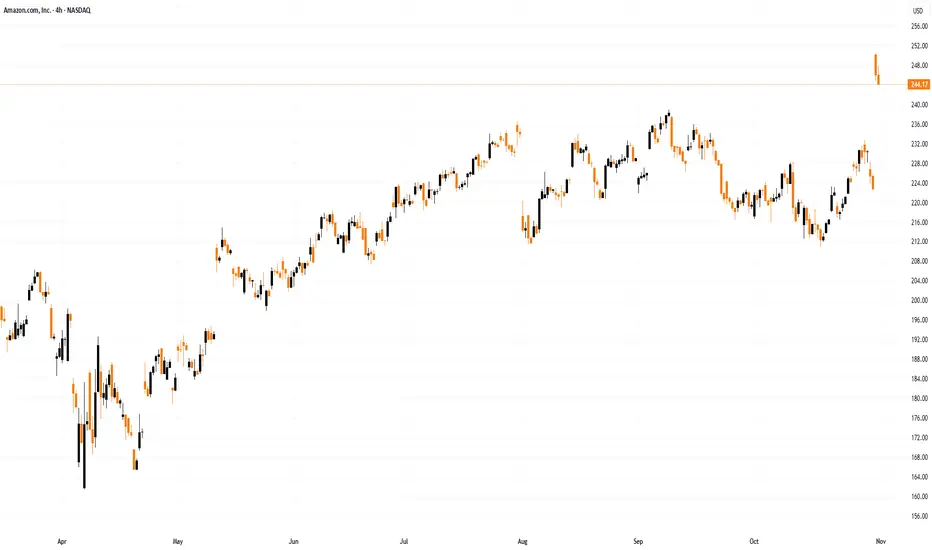
Amazon (AMZN) Shares Reach $250 for the First TimeAmazon (AMZN) Shares Reach $250 for the First Time
As the chart shows, Amazon (AMZN) shares rose to a record high on Friday, reaching the $250 mark for the first time. This came after the publication of a strong earnings report:
→ Revenue: $180.2 billion (up 13% year on year).
→ Earnings per share (EPS): actual = $1.95, forecast = $1.56 (a 25% beat).
Investor sentiment was further boosted by the following:
→ AWS (Amazon Web Services) revenue grew by 20% year on year, despite competition from Microsoft Azure and Google Cloud.
→ Amazon issued a confident outlook for the crucial holiday (fourth) quarter.
Technical Analysis of Amazon (AMZN) Chart
When analysing the chart on 24 September, we:
→ used AMZN share price fluctuations to construct an upward channel (shown in blue);
→ noted early signs of weakness.
Subsequently, the price reached a low at point A – where the bulls found support from the lower boundary of the channel and the August low (in fact, there was a false bearish breakout) – and made a successful attempt to resume the uptrend.
The two red candles on Friday suggest that the initial reaction to the report may have been overly optimistic (as confirmed by the RSI indicator). Therefore, it is possible that a corrective move will follow – for example, towards the support area that includes:
→ the median line of the current channel;
→ the previous all-time high of $242;
→ the September high around $238;
→ the 0.382 Fibonacci retracement level of the A→B impulse, around $235.
This article represents the opinion of the Companies operating under the FXOpen brand only. It is not to be construed as an offer, solicitation, or recommendation with respect to products and services provided by the Companies operating under the FXOpen brand, nor is it to be considered financial advice.
Amazon Stock Heist: Thieves Targeting 247 Escape Point🔐💰 AMAZON HEIST PLAN – STOCK MARKET ROBBERY STYLE 🚀📈
👋 Hey Thief OG’s, Money Grabbers & Market Shadows!
Today’s mission is inside the vault of Amazon.com Inc. (AMZN) – and we’re planning a Bullish Heist.
🎯 ENTRY – Layering the Break-In 💎
The vault doors are always open for the thief gang!
Place multiple Buy Limit Orders (layer entries) at 🏦:
230.00 / 227.00 / 225.00 / 222.00
You can add more layers to your heist plan based on your own risk appetite.
Thief strategy = stack the entries, wait for the pullback, strike big.
🛑 STOP LOSS – Thief Escape Route 🚔
This is the official Thief SL: @219.00.
But remember OG’s – adjust your SL based on your own strategy & bag size.
We don’t all run with the same loot.
🎯 TARGET – Police Barricade 🚨
Before the sirens ring, our escape bag is ready at @247.00.
That’s where we dump the loot and vanish into the shadows. 🏃💨💼
🕵️♂️ THIEF STYLE STRATEGY
✅ Layering entry method (multiple buy limits = thief stacking plan).
✅ Risk management = key to survival.
✅ Exit before the market police catches you.
💥 Remember OG’s: This is not financial advice – this is a robbery simulation in the stock market.
Support the gang 👉 Smash the Boost Button 💥 so our heist team gets stronger!
🤑💼💰 Every day, every chart, every loot = Thief Trader Style.
Stay sharp. Stay hidden. Stay profitable.
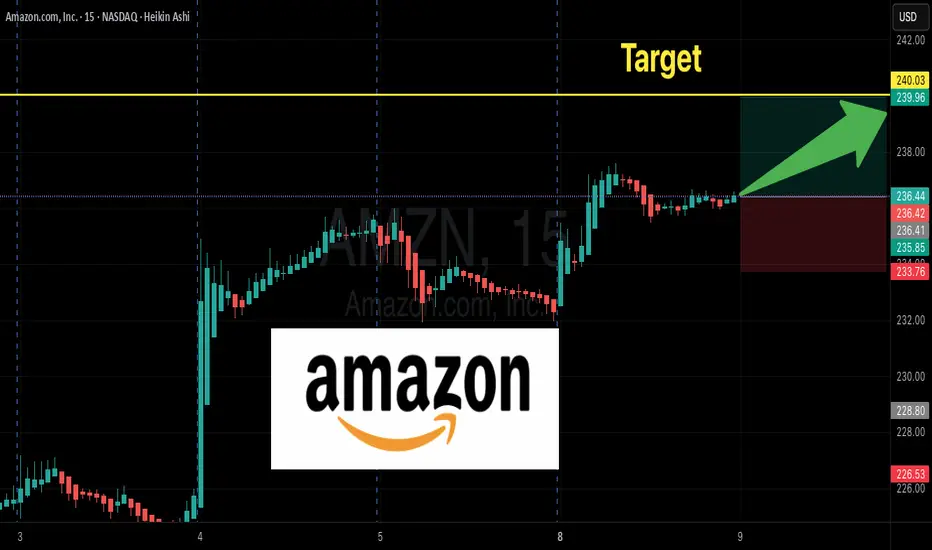
AMZN $240 Weekly Call — Tactical Play for Quick Gains
🚀 **AMZN Weekly Options Alert — \$240 Call Could Double in 4 Days!**
**Directional View:** **Strong-to-Moderate Bullish** 💹
**Confidence:** 75%
**Trade Setup:**
* **Instrument:** AMZN
* **Strategy:** BUY CALL (single-leg)
* **Strike:** \$240
* **Expiry:** 2025-09-12 (4 DTE)
* **Entry Price:** \$0.68 (ask at open)
* **Size:** 1 contract
**Targets & Risk:**
* **Profit Target:** \$1.36 (100% gain)
* **Partial Profit:** \$1.02 (50% gain)
* **Stop Loss:** \$0.34 (50% of premium)
* **Exit Rule:** Close everything by Thursday 15:30 ET to avoid gamma/theta risk
**Why This Trade?**
✅ Weekly RSI rising (71.5) + expanding weekly volume (1.3x) → bullish momentum
✅ Strong call skew (C/P 1.99) → institutional positioning
✅ Low VIX (\~15.2) → cheaper premiums, directional edge
✅ Strike \$240 slightly OTM with **high liquidity** (OI 24,202)
**Key Risks:**
⚠️ Falling daily RSI (59.9) → short-term consolidation possible
⚠️ 4-DTE weekly → high gamma/theta; strict stop mandatory
⚠️ Unexpected news or sector moves could spike IV or widen spreads
⚠️ High OI may create pinning behavior near \$240
**Quick Takeaway:**
* Tactical **short-term bullish weekly trade**
* Exploits **momentum + options flow + liquidity**
* Strict **risk management**: stop at 50% and exit by Thursday
* Partial profits at 50%, full target at 100% gain
---
📊 **TRADE DETAILS (JSON)**
```json
{
"instrument": "AMZN",
"direction": "call",
"strike": 240.0,
"expiry": "2025-09-12",
"confidence": 0.75,
"profit_target": 1.36,
"stop_loss": 0.34,
"size": 1,
"entry_price": 0.68,
"entry_timing": "open",
"signal_publish_time": "2025-09-08 10:11:13 UTC-04:00"
}
```
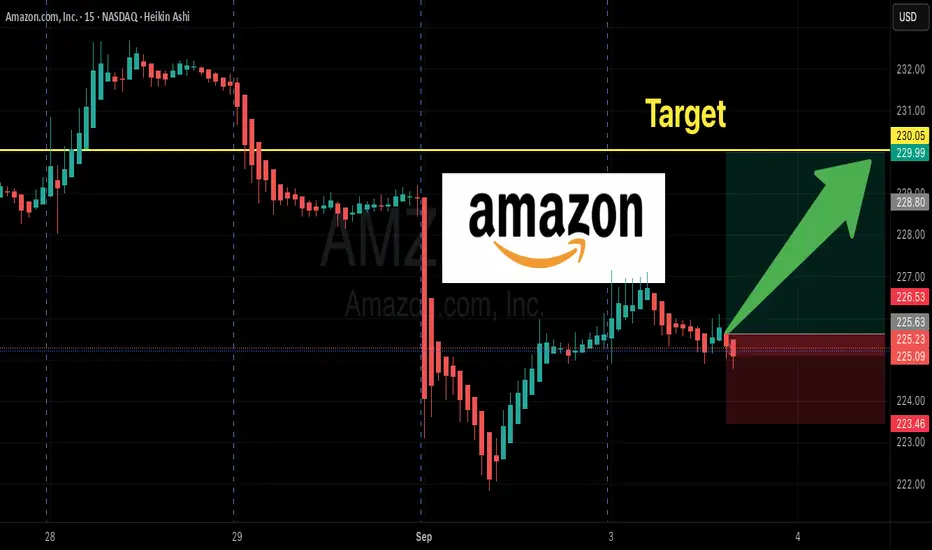
AMZN Options Flow Explodes! $230 Call Trade Idea”
# 🚀 AMZN Weekly Options Trade Idea (2025-09-03)
### 📊 Market Recap
* **Daily RSI**: 47.9 ⬇️ (bearish tilt)
* **Weekly RSI**: 57.1 ⬇️ (losing momentum)
* **Volume**: 0.9x 📉 (weak vs prior week)
* **Options Flow**: 💎 Strongly bullish (C/P = 3.30)
* **VIX**: ✅ Favorable (16–17)
👉 **Models Split:**
* 🐻 DeepSeek → \$225 PUT idea (bearish).
* 🐂 Grok + Llama → \$230 CALL (moderate bullish).
* ⚖️ Gemini + Claude → **NO TRADE** (risk > reward).
---
### ✅ Consensus Trade Setup (Flow-Weighted Lean)
```json
{
"instrument": "AMZN",
"direction": "call",
"strike": 230.0,
"expiry": "2025-09-05",
"entry_price": 0.43,
"profit_target": 0.86,
"stop_loss": 0.26,
"size": 1,
"confidence": 0.62,
"entry_timing": "open"
}
```
---
### 🎯 Trade Plan
* 📌 **Strike**: \$230 CALL (Sep 5)
* 💵 **Entry**: 0.43 (ask @ open)
* 🎯 **Target**: 0.86 (+100%)
* 🛑 **Stop**: 0.26 (–40%)
* ⏰ **Max Hold**: Exit by Thu EOD (avoid Fri gamma risk)
* ⚖️ **Size**: 1 contract (small, <2% equity)
* 📈 **Confidence**: 62% (flow-driven edge, weak technicals)
---
⚠️ **Risks**
* Daily + weekly RSI trending down = 🐻 momentum risk
* Weak institutional volume confirmation 📉
* Heavy call flow could be **retail noise / covered calls** 😬
* 2 DTE → **theta burn + gamma whip risk** ⚡
---
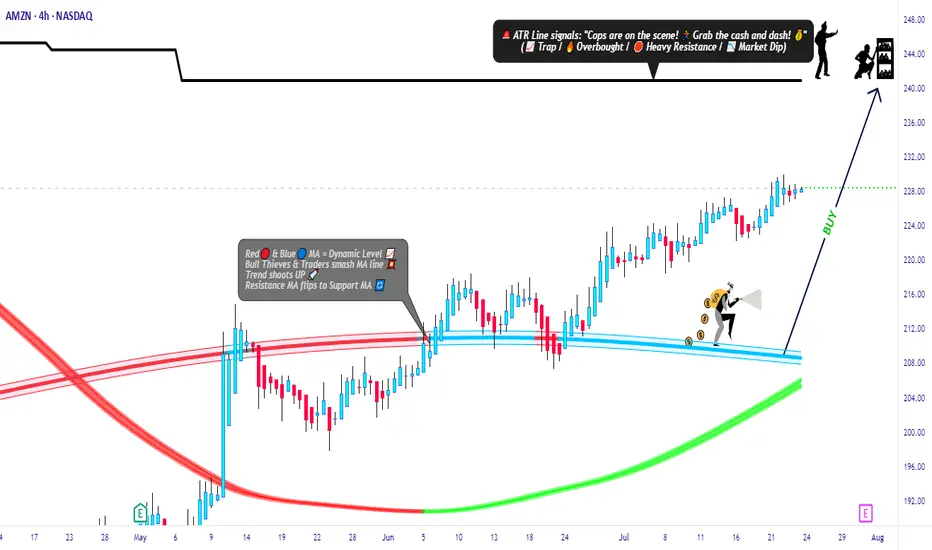
Amazon Market Robbery Blueprint – Swing/Scalp Long Setup🟨💣 “AMZN Market Heist Blueprint – Bullish Robbery in Progress 🚨💼💸” 💣🟨
By Thief Trader – Rob the Market with Precision
🌍 Hello World! Hi, Hola, Ola, Bonjour, Hallo, Marhaba!
🤑💰 Calling all Money Makers & Market Robbers – get ready to execute the next bullish heist on AMAZON.COM, INC (NASDAQ: AMZN), powered by our signature Thief Trading Style™ – where technical precision meets psychological warfare.
🔥 Plan Summary:
Based on our fundamental & technical intel, we’re eyeing a long entry into AMZN. The target? 💥The High-Risk ATR Police Barricade Zone – a zone flooded with liquidity, overbought conditions, fakeouts, and bear traps. It's where most traders get caught – but we walk in with a blueprint.
🟩 Entry Zone – “The Vault Is Wide Open!” 💼📈
🕰 Entry timeframe: 15min / 30min (preferably after confirmation or rejection wick)
💵 Buy Limit Orders: Place multiple layered entries (DCA-style) near recent swing lows/highs. Wait for breakout confirmation; no blind orders before breakout!
Thief Note: This isn’t spray-and-pray – this is sniper-mode. Scope, place, execute.🎯
🛑 Stop Loss – “SL is the Escape Route!”
📍 SL below recent 4H candle wick swing low (around 219.00 – adjust based on your risk/margin size).
Important: Only place SL after breakout; not before. Risk per order must match your lot strategy.
🎯 Target – “Grab the Bag or Escape Before the Alarms!”
💸 Target Zone: 240.00
🧠 Smart robbers know when to bail early – use a trailing SL to lock gains. Exit before reversal or heavy volume shift.
👀 Scalper Alert – “Only One Way – LONG!”
If you’re a quick thief with a fat bag, hit-and-run with a Long scalp. If you’re running lean, swing with the crew. Watch the PA and news timing. Trailing SL = insurance policy.
📊 Why Bullish? Here’s the Background:
🔍 Macro Drivers
💼 COT Report
🌍 Geo-political Influences
🧠 Sentiment Score
📈 Index Correlation
🔮 Intermarket Signals
💹 Institutional Positioning
All lights flashing green for short-to-midterm bullishness, but keep checking real-time updates.
⚠️ Risk Alert – News Triggers Can Blow Your Cover 🚨
🗞 Avoid trading near major news releases – they cause volatility spikes.
🧲 Always protect gains with trailing stops and don’t over-leverage your ammo.
💖 Support the Robbery – Hit BOOST 🔥
Smash that 💥BOOST💥 button if you ride with the Thief Trading Crew!
Let’s build this into the #1 robbery squad on TradingView.
Make money. Protect profits. Trade like a bandit – with a plan. 💼📈🏆
🔔 Stay Tuned for the Next Robbery Mission 🔔
Another heist plan dropping soon. Until then, rob smart, rob safe, and rob rich.
– Thief Trader™ | Rob The Market. Not Your Wallet.
Amazon (AMZN) Shares Rise Ahead of Earnings ReportAmazon (AMZN) Shares Rise Ahead of Earnings Report
Today, 31 July, Amazon is set to release its quarterly earnings after the close of the regular trading session. Available data show that Amazon (AMZN) shares are exhibiting bullish momentum, reflecting positive market expectations:
→ In July, AMZN shares have outperformed the S&P 500 index (US SPX 500 mini on FXOpen);
→ Yesterday, following the end of the regular session, AMZN shares surged by approximately 3% in after-hours trading.
The rise in AMZN comes amid strong earnings reports from other tech giants, such as Microsoft (MSFT) and Meta Platforms (META). For example, MSFT shares rose by more than 8% in post-market trading. Their success has likely fuelled optimism that Amazon’s upcoming report will also impress.
All of this has brought noticeable changes to the technical outlook for the AMZN stock price.
Technical Analysis of the Amazon (AMZN) Chart
Following the release of the previous earnings report, price movements have formed an upward channel, as indicated by the Regression Trend tool. However, in recent days, a series of bearish signals emerged:
→ On Thursday, AMZN broke above the $230 level (marked by an upward arrow), but the session closed well below the highs – a sign of selling pressure;
→ Friday and Monday’s sessions produced candles with small bodies, indicating market indecision;
→ On Tuesday, bears took the lead (marked by a downward arrow), with a relatively long candle closing near the session low.
Thus, the chart gave reason to assume that optimistic sentiments were waning. However, today’s session is likely to open near the $237.30 level, effectively negating the bearish interpretation of the previous five candles and shifting momentum back in favour of the bulls.
In this context:
→ Support could be provided by the $230 level as well as the median of the Regression Trend channel;
→ Key resistance could be found at the previous high of $242.23 and the psychological level of $250.
Whether AMZN can surge to a new all-time high will largely depend on the company’s performance in AI – a theme that remains highly relevant in 2025.
This article represents the opinion of the Companies operating under the FXOpen brand only. It is not to be construed as an offer, solicitation, or recommendation with respect to products and services provided by the Companies operating under the FXOpen brand, nor is it to be considered financial advice.
AMZN Earnings Play — July 30 (AMC)
## 🚀 AMZN Earnings Play — July 30 (AMC)
**💵 High Conviction Call Trade | 85% Confidence**
📈 **Amazon (AMZN)** — Cloud + Consumer Power Combo
🧠 Setup driven by earnings momentum, bullish flow, and macro strength.
---
### 🔍 FUNDAMENTALS SNAPSHOT
✅ **Revenue Growth**: +8.6% TTM
✅ **Margins**: Profit 10.1%, Op 11.8%, Gross 49.2%
🎯 **EPS Beat Streak**: 8/8 with avg. surprise of +34.7%
🔮 **Consensus Target**: \$252.03 (+9.4% upside)
📌 AWS + AI + Cost control = 🔥 upside setup
🟢 **Score: 9/10**
---
### 📊 OPTIONS FLOW SIGNAL
💰 **High OI**: \$232.50, \$240, \$247.50 calls
📈 **Call/Put Ratio**: Bullish Skew
🛡️ **Put Hedging** ≠ Bearishness
📉 Expected Move: \~5%
⚖️ **Gamma Bias**: Bullish above \$240
🟢 **Score: 8/10**
---
### 📉 TECHNICAL SETUP
📍 Price: \$231.01
📈 20D MA: \$226.21 (Support)
📉 RSI: 66.71 (momentum building)
🔒 Resistance: \$242.52 (watch for breakout)
🟢 **Score: 8/10**
---
### 🌐 MACRO TAILWINDS
🧠 AI & Cloud Momentum 🚀
💹 Consumer spending rebound
🔧 Regulatory risk mitigated via diversification
🟢 **Score: 8/10**
---
## 🎯 TRADE IDEA
🟩 **AMZN 08/01 \$247.50 Call**
💸 Entry: \$0.86
🎯 Target: \$2.58 (200%)
🛑 Stop: \$0.43 (50% loss)
⏰ Entry: **July 30 — Pre-close**
📏 Max Risk: \$86
💰 Max Reward: \$258
🧠 IV Crush Defense: Exit 2H post-ER
---
## ⚡️ WHY THIS WORKS
✅ 8-straight beat streak
✅ Fundamentals + Technicals = aligned
✅ Flow + Macro confirm direction
📈 Setup = asymmetrical upside
---
🎯 Tag your earnings sniper crew
📈 #AMZN #EarningsTrade #OptionsFlow #AmazonStock #CloudAI #OptionsStrategy #EarningsPlays #TradingView #SwingTrade #CallOptions #VolatilityTrade #EarningsMomentum

AMZN: A Power Move for the Smart Trader | The Rebound Play?🚀 AMZN 2025 Trade Plan
After an early 2025 rally to $240+, Amazon (AMZN) has pulled back sharply to around $167, opening the door to what could be one of the most attractive rebound setups of the year.
With AWS still growing strong and net income nearly doubling in 2024, the fundamentals are on Amazon’s side. Add to that bullish analyst outlooks pointing to $226–$253 this year, and we might just be looking at a golden entry zone.
📌 Entry Points:
Start building a position at $167
Add more if it dips toward $160 or $151 (52-week low)
🎯 Profit Targets for 2025:
First stop: $210
Next: $226
Final push? $240+
This setup blends technical recovery with strong financials and long-term bullish sentiment. Patience, discipline, and solid risk management are key as AMZN finds its footing.
⚠️ Disclaimer: This is not financial advice. All trading involves risk. Always do your own research and consult with a licensed financial advisor before investing.

Amazon is the FULL PACKAGE! 62% UpsideNASDAQ:AMZN - H5_W Trade Setup: 🚨
Confirmed CupnHandle Retest =
🎯$262 🎯$280
📏MM: $310
- Multi-Year CupnHandle
- Massive weekly volume shelf
- Green Support Beam on Wr%
- Undervalued MOAT Company
Not financial advice

AMZN at an all-time high: To be continued?AMZN reaches a new all-time high of $225.8, positioning itself at the upper boundary of an ascending channel that began on January 6, 2023, when it hit a low of $83.07. This channel, nearing its two-year milestone, has developed in five waves, as outlined by the Elliott Wave Theory:
Wave 1
Period: January 4, 2023 - September 14, 2023
Movement: $81.43 to $145.86 (+79%)
Wave 2
Period: September 14, 2023 - October 26, 2023
Movement: $145.86 to $118.35 (-19%)
Wave 3
Period: October 26, 2023 - July 8, 2024
Movement: $118.35 to $201.20 (+70%)
Wave 4
Period: July 8, 2024 - August 5, 2024
Movement: $201.20 to $151.61 (-25%)
Wave 5 (in progress)
Estimated period: August 5, 2024, to today
Projected movement: $151.61 to a range of $226.00 - $231.85 (+49% to +53% projected)
Key Questions for Caution on AMZN
Will it surpass the channel's upper boundary, setting new all-time highs?
Will it retrace to a dynamic support level within the channel (ranging between $201 and $195)?
Will it break below the ascending channel, signaling the start of a higher-degree correction?
Our opinion is for educational purposes only and should not be considered a recommendation to buy or sell. Before making any investment, consult with your financial advisor.

BEZOS AND EX-BEZOS ARE GIVING YOU A EARLY GIFT ON AMAZON!BEZOS AND EX-BEZOS ARE GIVING YOU A EARLY GIFT ON AMAZON! NASDAQ:AMZN
- HIGHFIVESETUP still intact
- Creating Support on Wr%
- Retesting Ascending triangle and CupnHandle breakout
- Measure move on both is to $300+
- Cheap on a DFCF model
Have you been buying more Amazon?
NFA

$AMZN IS ABOUT TO EXPLODE! BUY NOW OR FOMO LATERNASDAQ:AMZN
💥 NASDAQ:AMZN IS ABOUT TO EXPLODE! 💥
I first called out NASDAQ:AMZN on October 21st as it was setting up for a huge move and CupnHandle breakout. Here's 3 reasons to not miss this investing or trading opportunity. Price targets at the end.
1.) HIGH FIVE SETUP (Check the numbers below and you will see. 1-Breaking out of cupnhandle & symmetrical triangle pattern. 2-Volume profile gap from a volume shelf. 3-Uptrending MACD. 4-Higher Highs on RSI. 5-Uptrending Stoch. (trend).
2.) #Amazon margins and FCF are growing rapidly and will continue this uptrend heading into the holiday season with a RESILIENT AMERICAN CONSUMER.
3.) It's a BUY according to the fundamentals especially when valuing this company according to it's Discounted Cash Flow (DCF).
Intrinsic Value: $250
🎯PT1: $231 (Symmetrical triangle measured move)
🎯PT2: $310 (Multi-year CupnHandle Measure Move)
Are you a shareholder? or Are you trading this name?
I'm done for the day! Going to be with my wife on her birthday and go trick or treating with my boys. Thanks for all the support, much love!
LIKE l FOLLOW l SHARE
HAPPY HALLOWEEN!
#Earnings
NFA

AMZN 50%+ UPSIDE!!! CUP N HANDLE PATTERN! BREAKDOWN BELOW:NASDAQ:AMZN #Earnings #BlackFriday
I PRESENT TO YOU: 🎁
🔜 THE NEXT 3T MKT CAP COMPANY
Behold the beautiful CUP 🍵& Handle 👌#chartpatterns #trading #tradingstrategy #Stock
This tea is going to taste delicious when we finally break over $201.20. NASDAQ:AMZN has been a laggard and it's time for them to play a little catch up! 🧧
Not much explaining needed with this one...Cup n Handle breakout means we are going to the measured move destination of...🥁🥁🥁....$310.69 ‼️‼️‼️
CATALYST: 😼
✔️Continued AWS growth and dominance!
✔️Stellar holiday quarter (best quarter of ea. year)
✔️MONEY PRINTER (ATH Free Cash Flows (FCF)
✔️Better margins and #3 player in Ad space!
NASDAQ:AMZN is a 17% in my LT portfolio. Also, I have several options plays on this name. Gonna be a fun ride! 🎢
Like and follow for more great charting and stock talk!
Not financial advice 🖖 NASDAQ:QQQ AMEX:SPY AMEX:IWM NASDAQ:BIVI

AMZN ( Amazon.com, Inc. ) BUY TF H1 TP = 180.18On the H1 chart the trend started on Aug. 06 (linear regression channel).
There is a high probability of profit taking. Possible take profit level is 180.18
Using a trailing stop is also a good idea!
Please leave your feedback, your opinion. I am very interested in it. Thank you!
Good luck!
Regards, WeBelievelnTrading

Sharing AMZN chart from the TTR We are short as of high of the Sharing AMZN chart from the TTR
We are short as of high of the day
AMZN reports after the close
The price has re-tested the broken ending diagonal channel from below, a bearish signal by itself.
I will take one lotto put. Implied volatility for AMZN stock is about 8% in either direction

AMZN has topped - Apr 18 2024AMZN got a perfect weekly topping candle, followed by a bearish engulfing candle (one more day to confirm)
Watch for a dip below the 150 level.
Im going to short it very soon, will post it live when I do

🌟📈 AMZN: Amazon on Olympus's Peak!Traders, brace yourselves for an epic showdown with Amazon! 🌟📈
🔍 Critical Juncture:
We're witnessing a pivotal moment as Amazon stands at the summit of Olympus. The level at $188.11 has proven its mettle twice before. Will lightning strike thrice? The stakes have never been higher!
💡 Adventure in the Jungle:
Embark on a thrilling journey through the Amazonian jungle of trading! With a potential 27% journey to the first buy zone, are you ready for the wild ride ahead?
🔥 Join the Expedition:
Venture forth and share your thoughts on this daring expedition! Are you prepared to navigate the treacherous terrain of the market? The jungle drums are beating, and the adventure awaits!
💬 Your Quest Awaits:
What's your strategy for tackling this Amazonian challenge? Share your insights and embark on this exhilarating quest with fellow traders! The path to glory awaits those bold enough to seize it!
🎁 Discover the Treasure:
Remember, the most insightful comment could unlock a treasure trove of prizes! So don't hesitate—join the expedition and stake your claim to riches in the jungle of trading! 🏆💰

Amazon (AMZN) Technical Analysis and Trade Idea#AMZN has demonstrated a robust bullish trend, recently leaving a notable price gap between 167 and 162. Given the extended move, a retracement back into this gap appears likely as the market seeks equilibrium before March.
Potential Trade Setup:
- Entry: Consider a short position near the current range high.
- Stop Loss: Employ a stop loss 1.5x the Average True Range (ATR) on the daily (1D) timeframe.
- Rationale: This setup targets potential overextension and aligns with the anticipated price rebalancing.
Important Disclaimer:
This analysis reflects my personal market interpretation and does not constitute financial advice. Always conduct your own independent research and thorough risk assessment before making any trading decisions.
