Gold’s Sharp Sell-Off Is a Reset, Not the Start of a Bear TrendHello everyone,
Price OANDA:XAUUSD has now reacted strongly from the 4.30x–4.32x demand zone, which aligns with a previous base and marks the end of the impulsive leg down. The current bounce should be viewed as a technical reaction, not a trend reversal. Structurally, this fits well with the early stages of an ABC corrective structure.
4.38x–4.40x: first resistance zone, previously broken support and near EMA34. This is a high-probability reaction area for sellers (wave A).
4.34x–4.35x: potential pullback zone (wave B) if price fails to reclaim structure.
4.46x–4.48x: corrective upside extension (wave C) if momentum sustains, but still within a corrective context.
Price continues to rebound to retest the 4.40x – 4.41x zone (short-term resistance / Wave A).
- A corrective phase B may occur here before:
- If buying pressure is strong enough → price continues wave C, heading towards a higher zone (4.48x – 4.50x).
- If the price fails to break through zone A and is strongly rejected, the market will return to a sideways consolidation phase within the Liquidity range, needing more time to absorb supply.
Only a clean reclaim above EMA89 and acceptance back above the broken channel would signal that buyers have regained control and reopen the path toward the 4.55x–4.60x region. Until that happens, any upside movement on H1 should be treated as corrective rebalancing after a completed trend, not a fresh impulsive advance.
Wishing you all effective and disciplined trading.
Analysis

Fundamental Market Analysis for December 30, 2025 EURUSDThe market remains cautious ahead of the release of the minutes from the Federal Reserve’s December meeting. Investors are assessing how quickly the regulator may be ready to continue cutting rates in 2026 and how the outlook could be influenced by employment and consumer inflation data. With thinner year-end liquidity, any new emphasis in the commentary can amplify swings in the dollar.
The euro is being supported by inflows into European assets amid a narrowing yield gap and firmer inflation expectations in the euro area. At the same time, market participants are closely watching signals from the European Central Bank: a faster rise in prices would push it to keep rates unchanged for longer, while weak manufacturing and demand data would increase the likelihood of further measures to support the economy.
Another key factor remains the debate around U.S. fiscal policy and possible trade restrictions, which supports demand for currency diversification and reduces reliance on the dollar as the sole safe anchor. If the Fed minutes confirm a cautious, data-dependent approach, the euro may gain room for moderate appreciation over the coming sessions.
Trading recommendation: BUY 1.17700, SL 1.17350, TP 1.18750

Gold Just Absorbed a Sharp Sell-Off — This Is a PullbackGOLD (XAUUSD) — 1H Market Analysis
Gold remains firmly within a primary bullish structure , despite the recent aggressive bearish candle. The current price action is best interpreted as a technical pullback into dynamic support , not a breakdown. The market is resetting momentum after a strong impulsive leg higher.
1) Market Structure: Bullish Trend Still Intact
The broader structure continues to show:
- Higher highs and higher lows on the intraday trend
- Price still trading above the 89 EMA, which is acting as a medium-term trend support
- The recent sell-off failed to break the last structural higher low
This confirms that buyers remain in control, and the decline is corrective rather than impulsive.
2) Key Technical Levels (Execution Zones)
Support Zone 4,470 – 4,450
Confluence of:
- EMA 89 (~4,476)
- Prior breakout structure
The long lower wick shows strong buy-side absorption at this level.
If this zone holds, the bullish trend remains valid.
Resistance & Upside Targets
- Target 1: 4,505 – 4,520
First reaction zone after the bounce
- Target 2: 4,525 – 4,550
Previous consolidation high
- Target 3: 4,580 – 4,600
Measured move extension + psychological round number
High probability zone for partial profit-taking
3) Momentum & Moving Averages
- EMA 34 has been briefly lost but price is attempting to reclaim it
- EMA 89 remains unbroken → trend bias stays bullish
- Momentum reset is healthy after the prior impulsive rally
In strong trends, price often pulls back to EMA 89 before expanding again.
4) Macro Context: Why Gold Is Still Supported
- Gold strength is not random it is backed by macro tailwinds:
- U.S. Dollar weakness continues to support precious metals
- Expectations of future rate cuts keep real yields under pressure
- Ongoing geopolitical uncertainty sustains safe-haven demand
- Central bank gold accumulation remains structurally supportive
These factors limit downside risk and favor dip-buying behavior rather than trend reversal selling.
5) Scenarios Going Forward
Bullish Continuation (Primary Scenario)
Price holds above 4,450
Reclaims 4,500
Extension toward 4,550 → 4,600
Bearish Invalid Scenario
Clean breakdown and acceptance below 4,450
Would expose 4,420 – 4,400
Only then would the bullish structure be compromised
Final Assessment
This move is a controlled pullback within a strong uptrend, not a bearish signal. As long as price holds above the EMA 89 and structural support, the path of least resistance remains upward.
Smart money buys pullbacks — not tops — and the current zone is exactly where trend continuation setups usually form.

ETH/USD – H1 Technical Analysis DetailETH/USD – H1 Technical Analysis
Ethereum has just delivered a strong impulsive breakout from the consolidation structure around 2,950–2,980, pushing price decisively above the prior balance area and reclaiming the psychological $3,000 level. This move is technically significant because it comes after an extended period of compression, where liquidity was building on both sides of the range.
From a structure perspective, ETH has flipped the former resistance zone around 2,980–3,000 into a new support zone. The impulsive bullish candle was accompanied by a clear volume expansion, confirming that this was not a false breakout but rather active participation from buyers. As long as price holds above this reclaimed support, the bullish structure remains intact.
The next key levels are clearly defined:
Immediate support: 2,980–3,000
Resistance 1: ~3,033
Major resistance: ~3,073
A healthy pullback into the 3,000 zone would be structurally bullish, allowing the market to build a higher low before attempting continuation toward 3,030 → 3,070. A clean break and acceptance above 3,073 would open the door for a broader upside expansion on higher timeframes.
On the macro backdrop, ETH is benefiting from a stable risk-on environment, with crypto sentiment supported by expectations of easier monetary conditions in 2026, declining US real yields, and continued institutional positioning in large-cap digital assets. As long as Bitcoin holds its higher range and the USD remains capped, Ethereum retains upside potential.
Conclusion:
This is no longer a range trade. ETH has shifted into a bullish continuation phase, with pullbacks likely to be corrective rather than trend-reversing. The market now favors buying dips above $3,000, not chasing breakouts blindly, while respecting that failure back below 2,980 would invalidate the bullish scenario.

Gold Just Broke Its Rising ChannelGold (XAUUSD) – H1 Technical & Macro Analysis
Gold has shifted from a bullish continuation structure into a clear distribution and breakdown phase . After trending higher inside a rising channel, price failed to sustain momentum near the upper boundary around 4,520–4,540 , forming lower highs and showing repeated rejection. This behavior signals that buying pressure has been absorbed and smart money has begun distributing positions rather than pushing price higher.
From a technical structure standpoint, the critical signal was the clean break below the rising channel support near 4,480–4,460. This breakdown invalidates the bullish channel and confirms a short-term trend reversal. The subsequent pullback attempts were weak and corrective, indicating that sellers are now in control. As long as price remains below 4,500, the market structure favors downside continuation rather than a bullish recovery.
Key levels to monitor:
Broken support /new resistance: 4,480–4,500
Intermediate support: ~4,420
Major downside target: 4,340–4,300 (previous demand & liquidity zone)
On the macro side, gold is currently pressured by stabilizing US yields and a resilient US dollar , which reduce the attractiveness of non-yielding assets like gold. Additionally, the absence of immediate geopolitical escalation or aggressive dovish signals from the Federal Reserve has cooled safe-haven demand. With markets pricing a more gradual rate-cut path, gold is losing short-term momentum despite its longer-term bullish narrative.
Conclusion:
Gold has transitioned from an uptrend into a bearish corrective phase on the H1 timeframe. Any bounce toward 4,480–4,500 is technically a sell-the-rally opportunity, not a trend reversal, unless price reclaims and holds above the broken channel. Until then, the probability favors continued downside toward 4,420 and potentially 4,300 , where stronger demand may re-emerge.

Will gold continue to correct in the last two days of the year?1️⃣ Trend Line
Medium-term trend: Upward, but short-term is undergoing a sharp correction.
The price has broken the upward trend line and closed below the EMA, indicating that short-term selling pressure is dominant.
Current structure: Technical correction within a short-term downtrend.
2️⃣ Resistance
4.413 – 4.415: Strong resistance (combination of the broken trend line + previous support zone).
3️⃣ Support
4.300 – 4.303: Important support zone, recent reaction bottom.
A clear break below this area → continued downside risk.
4️⃣ Trading Scenario
Prioritize selling when the price corrects to 4.413 – 4.415, waiting for confirmation signals.
Only consider buying if the price holds above 4,300 and forms a clear reversal pattern.
BUY GOLD: 4,300 – 4,302
Stop loss: 4,292
Take profit: 100 – 300 – 500 pips
SELL GOLD: 4,413 – 4,415
Stop loss: 4,423
Take profit: 100 – 300 – 500 pips

ETH Is at a Make-or-Break ZoneEthereum is currently trading inside a clearly defined range, capped by major resistance around 3,160 and supported by a key demand zone near 2,980, with a deeper structural support around 2,780. The recent impulsive rally was decisively rejected at resistance, confirming that sellers are still defending the upper boundary of this range.
From a technical perspective, price action shows classic range behavior. After the rejection, ETH rotated back toward the mid-range and is now hovering just above support (~2,980). As long as this level holds on a closing basis, the market structure remains neutral-to-bullish within the range. A successful defense here would likely lead to a rebound toward 3,060 and a retest of the 3,160 resistance zone.
However, a clean breakdown below 2,980, especially with strong volume and a 1H/4H close, would invalidate the range floor and open downside continuation toward 2,900, followed by the major liquidity pocket around 2,780.
On the macro side, year-end conditions are playing a critical role. Holiday liquidity is thin, which statistically increases the probability of false breakouts and liquidity sweeps rather than clean trend continuations. At the same time, recent Federal Reserve adjustments to liquidity conditions and easing expectations around monetary policy have kept risk assets supported, but without enough conviction to force a decisive breakout. Crypto markets are therefore reacting more to positioning and short-term flows than to long-term macro repricing.
For Ethereum specifically, the broader narrative around institutional adoption, staking yield, and ETF-related expectations continues to provide medium-term support. That said, these factors are not yet strong enough to override the current technical range in the short term.
Bottom line: ETH remains a range-bound market. As long as 2,980 holds, upside rotations toward 3,060–3,160 remain the higher-probability scenario. A confirmed break below support would shift control back to sellers and expose 2,900 → 2,780. Until a decisive breakout occurs, traders should expect sideways price action with sharp intraday swings, typical of the Christmas trading period.

This Resistance Test Will Decide the Next 10% MoveETH/USD – 1H Market Analysis
Ethereum is currently locked in a clear range structure, trading between a major support zone around 2,880–2,920 and a well-defined resistance zone near 3,060–3,120. Price has already tested both extremes multiple times, confirming that this is not a trending environment yet, but a controlled consolidation where liquidity is being built.
From a structural perspective, ETH is forming repeated higher lows inside the range, while sellers continue to defend the resistance zone aggressively. This behavior reflects compression, not weakness. The market is balancing orders, shaking out impatience, and preparing for expansion rather than reversing impulsively.
Forward Scenarios to Watch:
Primary scenario (Higher probability): Another pullback toward the mid-range or support zone, followed by a rotation higher and a renewed test of resistance.
Bullish continuation: A clean hourly close above 3,120 with acceptance opens upside toward 3,200–3,280.
Bearish invalidation: A decisive breakdown below 2,880 would shift the structure bearish and target the lower demand zone.
Bottom line:
Ethereum is not breaking out yet it’s compressing. This is the phase where smart money positions quietly, while reactive traders get chopped. The breakout will come, but only after liquidity has been fully harvested. Patience remains the edge.

Gold Isn’t Correcting — It’s Setting a TrapXAUUSD – Market Structure Update & Intraday Strategy (Dec 29)
Gold continues to move exactly within last week’s planned scenario, confirming that the broader market structure remains intact. Price is still respecting the established ascending channel, which is critical: as long as structure holds, the advantage belongs to traders who identified the context early rather than reacting emotionally to short-term volatility. This is not randomness it is disciplined price behavior following liquidity logic.
From a medium-term perspective, XAUUSD remains in a clear uptrend. Recent pullbacks are technical corrections, not signs of distribution. These retracements are designed to absorb liquidity and eliminate late FOMO entries before continuation. Price is currently hovering around the equilibrium /liquidity zone, a common area where the market generates noise, fake breaks, and emotional traps. Importantly, dynamic support (EMA + structural support) continues to hold firmly, signaling no confirmed trend reversal at this stage.
On the intraday timeframe, the primary bias remains re-accumulation within trend. As long as price holds above the key support zone, rebounds should be treated as continuation setups rather than reversal signals. Even a deeper downside sweep should be viewed as liquidity collection for larger capital participation, not structural weakness. According to the weekly directional plan, the primary objective remains higher within the channel, with the next upside expansion targeting the upper boundary.
Trader’s Mindset & Execution
Price respecting the old structure is not coincidence, it validates correct structural reading and money flow alignment. Professional trading is not about chasing candles; it is about letting price execute within a predefined scenario. While the plan remains valid, the edge lies not in overthinking, but in patience and disciplined execution. The market today is still playing by the same rules as last week.
📌 TODAY’S LIMITED STRATEGY – DEC 29
Intraday Focus: Re-accumulation & liquidity-based entries
SETUP 1 – Timing Sell (Short-term counter move)
Sell Zone: 4576 – 4579
Take Profit: 4573 – 4568
Stop Loss: 4583
SETUP 2 – Timing Buy (Primary trend continuation)
Buy Zone: 4430 – 4433
Take Profit: 4436 – 4441
Stop Loss: 4426
⚠️ Strict capital management is mandatory. These setups are precision-based, not emotional trades.

Absolute Insanity in SILVER right Now $4 billion in silver longs get vaporized in 70 minutes.
$83.75 to $75.15. Fastest wipeout ever, With current price sitting at $71
American traders panic-dumped at $75, Chinese buyers were paying $90. Ninety. For the same metal. The premium didn’t shrink during the crash—it widened.
Let that sink in.
This wasn’t a top. This was a heist.
China locks silver exports in 72 hours. January 1st. Export licenses only. They control 70% of global supply. COMEX is down 70% on inventory. London’s vaults are bleeding. And Elon Musk just tweeted “this is not good” about the shortage.
The gold-silver ratio is 60:1. Historical average is 30. That’s $150 silver just to normalize.
Everyone’s calling this 1980. It’s not. The Hunts were speculators playing paper games. This is industrial demand crashing into empty vaults. Solar panels don’t negotiate. AI chips don’t wait.
Retail just handed their silver to sovereign wealth funds at a 15% discount.
The rumor says a major bank collapsed on a silver margin call at 2:47 AM December 28.
I cannot verify that.
What I can verify is more interesting.
JPMorgan filed an 8K on December 27 disclosing 4.875 billion dollars in unrealized silver losses. They flipped from 200 million ounces short to 750 million ounces long physical. The largest position reversal in the history of the silver market happened in the last 30 days and nobody on financial television said a word.
The rumor claims 34 billion in emergency Fed repos. Official data shows routine operations under 7 billion. Either the data is lagged or the rumor is wrong.
Why did JPMorgan suddenly need to own three quarters of a billion ounces of physical silver after spending 15 years on the short side. What did they see coming that made them eat a 5 billion dollar loss just to get positioned the other way.
The collapse story might be fiction.
The position flip is filed with the SEC.
One of those facts will matter more in 90 days than the other.
Stop chasing the rumor. Start asking why the smartest bank in commodities just switched sides at the worst possible price and seems fine with it.

GBPUSD SELL | Day Trading AnalysisYou can expect a reaction in the direction of selling from the specified resistance zone
GBPUSD moving higher as it tests the strong resistance level..
We expect a bearish move from the confluence zone.
Hello Traders, here is the full analysis.
I think we can soon see more fall from this range! GOOD LUCK! Great SELL opportunity GBPUSD
I still did my best and this is the most likely count for me at the moment.
-------------------
Traders, if you liked this idea or if you have your own opinion about it, write in the comments. I will be glad 🤝

XAUUSD LongGold made an all time high then sharply corrected.
The previous swing levels (marked by blue boxes) were the most recent levels that price pushed from in the higher time frame uptrend. If the uptrend is to continue from here these levels should be respected.
The indication (break-out) gave me my target. The break of the previous swing high gave me my BSO entry. The swing low gave me my BLO entry, and my Stop Loss is where price would break structure—suggesting that I would be wrong about this trade, so exiting would be wise.
I also bought the middle of the range in this case because I liked the structure and I'm not sure if I'll get my BLO opportunity.

XAUUSD Short: Rejected at Supply - Decline Toward 4,470 in FocusHello traders! Here’s a clear technical breakdown of XAUUSD (Gold, 3H) based on the current chart structure. Gold is trading within a well-defined bullish recovery after forming a clear pivot low on the left side of the chart. From that pivot point, price established a rising trend line, confirming that buyers have regained control and are steadily pushing the market higher.
Currently, price is trading between a major Supply Zone near 4,530 and a Demand Zone around 4,470. The recent pullback into the demand area appears corrective, not impulsive, suggesting profit-taking rather than a trend reversal. Buyers are defending this zone, which also aligns with prior breakout structure and short-term support.
My scenario: as long as Gold remains capped below the 4,530 Supply Zone, the risk of a bearish reaction stays elevated. Failure to break and hold above this resistance would confirm seller control at the highs and could trigger a corrective move lower. A clear rejection from the supply area may lead to a pullback toward the 4,470 Demand Zone as the first downside target. If price breaks below 4,470 with acceptance, it would signal a loss of bullish structure and open the door for a deeper correction toward lower support levels. A sustained hold below former demand would confirm a short-term bearish shift in momentum. For now, the focus is on price behavior at the supply zone, with rejection favoring a short scenario while resistance holds. Manage your risk!

BTCUSDT: Holding 87,300 Support Ahead of a 89,000 RetestHello everyone, here is my breakdown of the current BTCUSDT setup.
Market Analysis
BTCUSDT is trading within a well-defined ascending channel, reflecting a sustained bullish structure after breaking out of the prior consolidation range. Earlier in the chart, price spent significant time moving sideways inside a broad range, capped by a resistance zone near 89,000 and supported by demand below. A decisive breakout from the range confirmed a shift toward bullish market conditions.
Recently, BTC pushed back into the 89,000 Resistance Zone, where selling pressure appeared again. The current reaction from resistance looks corrective, not impulsive, suggesting temporary rejection rather than a trend reversal. Price is consolidating just above support, indicating compression between support and resistance within the bullish channel.
My Scenario & Strategy
My primary scenario remains bullish as long as BTCUSDT holds above the 87,300 Support Zone. Continued defense of this area could lead to another attempt to test the 89,000 Resistance Zone. A clean breakout and acceptance above resistance would confirm continuation within the channel and open the door for further upside.
However, on the flip side, a decisive breakdown below the support zone and channel structure would weaken the bullish bias and signal a deeper corrective move toward lower levels. For now, price remains constructive, with buyers defending structure while BTC consolidates below resistance.
That's the setup I'm tracking. Thank you for your attention, and always manage your risk.

XAUUSD Sellers Defend Resistance, Eyes on PullbackHello traders! Here’s my technical outlook on XAUUSD (4H) based on the current chart structure. Gold remains in a bullish structure after breaking above a descending resistance line, confirming a shift in control to buyers. Price then consolidated in a clear range, showing balanced market activity before continuing higher. The upside breakout from this range, supported by a rising trend line, confirms ongoing bullish momentum. Currently, XAUUSD is testing a key Resistance Level within the Seller Zone, where selling pressure may appear. Below, the former resistance has turned into a strong Support Level, aligned with the Buyer Zone near 4,440 and the previous breakout area. My scenario: as long as price remains below the Seller Zone and shows rejection from resistance, the bias turns bearish, with TP1 targeting a move back toward the Buyer Zone and trend-line support. A strong breakout and acceptance above resistance would invalidate the short scenario and suggest further upside continuation. Please share this idea with your friends and click Boost 🚀

BTCUSDT Bulls Defend Range Support, Eyes on $90,500Hello traders! Here’s my technical outlook on BTCUSDT (4H) based on the current chart structure. BTCUSDT previously broke down from a descending triangle structure, confirming bearish control and leading to a strong impulsive move lower. After this decline, price found a base and transitioned into a broad range, where buyers and sellers have been in relative balance. Multiple internal breakouts within the range highlight volatility but no clear trend dominance during this phase. Recently, price bounced from the lower boundary of the range and the rising Support Line, showing clear buyer reaction and a short-term shift in momentum. BTC is now trading above the key 87,300 Support Zone, which aligns with previous range support and a recent breakout level. The latest move higher looks constructive, with price attempting to challenge the upper part of the range. My scenario: as long as BTCUSDT holds above the 87,300 support area, the bias remains mildly bullish. A sustained move higher could lead to a retest of the 90,500 Resistance and TP1 near the range highs. Acceptance above resistance would open the door for further upside expansion. However, failure to hold support and a breakdown back into the lower range would invalidate the bullish scenario and favor renewed consolidation or downside. For now, the focus remains on support holding and reaction near resistance. Please share this idea with your friends and click Boost 🚀

Fundamental Market Analysis for December 29, 2025 USDJPYUSD/JPY is trading around 156.350, but the yen looks more confident after the Bank of Japan’s December rate hike and discussions within the regulator about the need to continue gradual tightening. An additional cap on the pair’s upside comes from statements by Japan’s Ministry of Finance about its readiness to respond to excessive exchange-rate swings, which makes market participants more cautious.
On the US side, the key driver remains expectations for the Fed rate: after the December decision, investors are trying to assess how quickly the regulator is ready to ease conditions in 2026. Against this backdrop, the minutes from the Fed’s December meeting become the main event over the next 24 hours, as they can clarify the balance of arguments on inflation and the labor market and, accordingly, the outlook for yields.
At year-end, thin markets increase the risk of sharp spikes, especially in yen pairs, where the possibility of official intervention is taken seriously. If interest in the yen as a safe-haven currency persists and expectations of further normalization by the Bank of Japan remain, the fundamental bias shifts toward a lower USD/JPY. It is important to account for news-driven volatility and set position protection levels in advance.
Trading recommendation: SELL 156.350, SL 156.550, TP 155.550

EURUSD Bearish ContinuationQuick Summary
EURUSD started the week with a bearish push, the Price already dropped after performing a sweep of liquidity above the previous high
Further downside is expected toward 1.17368 where price reaction will be monitored
Full Analysis
Following the bearish bias established at the beginning of the week EURUSD has already shown weakness when the Price moved lower after sweeping liquidity above the previous high which confirms that buy side liquidity has been taken
This behavior supports the idea that the market is now in a corrective or bearish phase
As long as price remains below the swept high the probability favors continuation to the downside
The next key level to watch is 1.17368
This area will be important to observe as price reaction there will determine whether EURUSD continues lower or continue the bullish trend

Will gold correct before continuing its upward trend? 29/12/20251️⃣ Trend / Trendline
Price is moving within a short– to medium-term ascending channel.
Upper trendline: dynamic resistance → price is approaching this area, increasing profit-taking pressure.
Lower trendline: dynamic support → a key decision zone that determines whether the bullish structure holds or breaks.
2️⃣ Resistance
4,550 – 4,552: strong resistance, confluence of previous highs + upper trendline.
4,570 – 4,572: extended resistance zone; a clear breakout is required for bullish continuation.
3️⃣ Support
4,492 – 4,490: short-term support, first technical reaction zone.
4,430 – 4,432: key support, confluence of channel bottom + strong demand zone → losing this area weakens the short-term bullish trend.
4️⃣ Scenarios
Holding above the lower trendline → prefer buy setups in line with the trend.
Strong rejection around 4,55x → potential pullback toward 4,43x before the next directional decision.
Trading Plan
BUY GOLD: 4430 – 4432
Stop Loss: 4420
Take Profit: 100 – 300 – 500 pips
SELL GOLD: 4570 – 4572
Stop Loss: 4582
Take Profit: 100 – 300 – 500 pips

Q4 2026! BTC LOW!!!Per the previous cycle in 2021, it took 426 days to hit the bottom in 2023. If history repeats, the next cycle low is on Dec 1, 2026 =/- 25 Days.

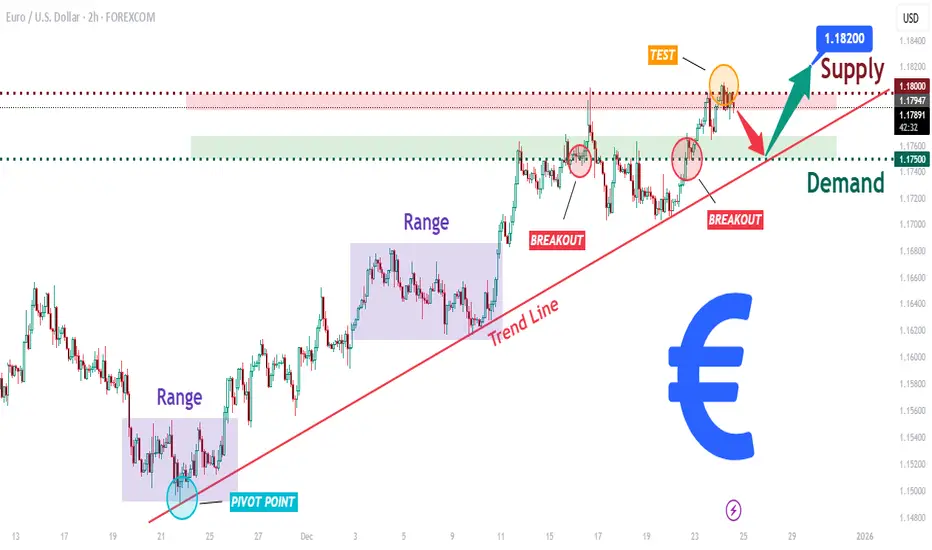
EURUSD Long: Trend Line Support Keeps Buyers, Move to 1.8200Hello traders! Here’s a clear technical breakdown of EURUSD (2H) based on the current chart structure. EURUSD is trading in a well-defined bullish trend, supported by a rising trend line that has guided price action from the recent pivot low. After an initial consolidation phase, price broke out of multiple range structures, confirming increasing buyer strength and a shift in market control to the upside. Each breakout was followed by shallow pullbacks, showing strong demand absorption.
Currently, EURUSD pushed into the supply zone around 1.1800, where selling pressure emerged. The current rejection from this area appears corrective, not impulsive, suggesting profit-taking rather than a trend reversal. Price remains above the key demand zone near 1.1750, which aligns with previous breakout levels and the ascending trend line, reinforcing its importance as structural support.
My scenario: as long as EURUSD holds above the 1.1750 demand zone, the bullish structure remains valid. A strong reaction from demand could lead to another test of the 1.1800 supply, and a clean breakout with acceptance above this level may open the path toward 1.1820 and higher. A decisive breakdown below demand would weaken the bullish setup and signal a deeper correction. For now, the bias remains bullish while price respects the ascending structure. Manage your risk!
TheGrove | EURUSD buy | Idea Trading AnalysisEURUSD is moving in an UP trend channel and moving on Resistance area .
The chart is above the support level, which has already become a reversal point twice.
We expect a decline in the channel after testing the current level.
We expect a decline in the channel after testing the current level which suggests that the price will continue to rise
Hello Traders, here is the full analysis.
I think we can soon see more fall from this range! GOOD LUCK! Great BUY opportunity EURUSD
I still did my best and this is the most likely count for me at the moment.
-------------------
Traders, if you liked this idea or if you have your own opinion about it, write in the comments. I will be glad

EURUSD: 1.1750 Support Sets Up a Retest of 1.1800Hello everyone, here is my breakdown of the current EURUSD setup.
Market Analysis
EURUSD has confirmed a bullish shift after breaking out of the previous downward channel, signaling a clear change in market structure from bearish to bullish. This breakout marked the start of a strong impulsive move higher, with price establishing higher highs and higher lows. Following the breakout, EURUSD respected a rising trend line, which is now acting as dynamic support and reinforcing the bullish bias.
Currently, price pushed into the 1.1800 Resistance Zone, where selling pressure emerged, leading to a rejection and short-term pullback. This reaction looks corrective rather than impulsive, suggesting profit-taking instead of a trend reversal. The pullback is currently unfolding toward the Support Zone around 1.1750, which aligns with the previous breakout area and the ascending trend structure. This zone has already shown buyer reaction, indicating active demand.
My Scenario & Strategy
My primary scenario remains bullish as long as EURUSD holds above the 1.1750 Support Zone. I expect buyers to defend this area and attempt another push toward the 1.1800 Resistance Zone. A clean breakout and acceptance above 1.1800 would confirm bullish continuation and open the path toward higher targets.
However, a decisive breakdown below the support zone would weaken the bullish structure and signal a deeper corrective move. For now, price action favors buyers while the ascending structure and key support remain intact.
That's the setup I'm tracking. Thank you for your attention, and always manage your risk.
