2008 Crisis and How the Banking System Has Changed Since:
⚠️These headlines serve as a reminder that despite the Basel I, II, and III global banking regulations, we have not been spared from systemic risks originating within the financial system itself
🏦After the 2008 crisis, banks became heavily overregulated. As a result, many of their most lucrative investment and financing activities shifted into affiliated offshore hedge funds — entities that remain very much part of the same global financial machinery. They are simply no longer called “banks,” and therefore escape almost all regulation.
💵These hedge funds lend, repackage loans, buy and sell exotic financial instruments, re-hypothecate, and re-collateralize. They use questionable collateral to issue risky loans , which are then resold, repackaged, and used again as collateral again.
💰 Exotic derivatives, curreny swaps, REPO operations, outright fraud,risky options market-making, — you name it — all thrive offshore , far from regulatory oversight yet just a click away for clients. And make no mistake: these so-called “non-banks” are deeply interconnected with the global financial system. If they fail, the shockwaves will be felt everywhere.
📈 The next financial tsunami will begin offshore — but it’s the onshore world that will be hit the hardest . So don’t keep large sums of money in the bank, guys. Once your funds are in the bank, they’re no longer truly yours — they belong to the bank. Your account can be frozen, blocked, seized, taxed, or even converted into shares (as happened in Spain in 2011).
⚠️And remember: banks can fail. They will fail. And when they do — the government won’t save you.
Yours truly,
Greg🌹
Analysis

EURUSD Short: Setup After Fake Breakout and Supply RejectionHello, traders! The market for EURUSD has been developing within a well-defined descending structure, characterized by lower highs and consistent rejection from the upper supply levels. After the earlier breakout from the falling wedge formation, the price transitioned into a broad consolidation range between the 1.1720 Supply Zone and the 1.1545 Demand Zone. This structure represents a balanced market phase, where buyers and sellers are testing control over short-term direction.
Currently, the price has once again approached the upper boundary of the range — the 1.1720 Supply Level — and faced a clear rejection. This move suggests that sellers are still defending this zone and that the market remains trapped within the broader consolidation phase.
My scenario anticipates a continuation of the decline from the Supply Zone.
The recent rejection confirms the presence of strong selling interest and indicates that the next likely move will be a rotation back toward the Demand Zone near 1.1545. Therefore, I’m watching for continued bearish momentum, with the take-profit target placed at 1.1545, in alignment with the lower boundary of the range. Manage your risk.

Bitcoin Correction Continues: Buyers’ Last Stand at 106KHello, traders, I want share with you my opinion about Bitcoin. After a strong bullish impulse, BTCUSDT reached a local high and entered a consolidation phase, forming a clear range. The subsequent breakout to the downside signaled the start of the current corrective phase. At the moment, the price is moving within a descending structure, defined by a resistance line from recent lower highs and a support line connecting local lows. The market recently retested the previous Support Level (now acting as resistance) near 109,000 and is showing bearish pressure again. Currently, the price is trading near the Buyer Zone (106,000–107,000), which previously served as a strong demand area. I expect the market to test this zone once again, where buyer reactions will determine the next move. I think that BTC will consolidate between the Buyer Zone and Resistance Line, forming a potential accumulation before any decisive breakout. If buyers manage to defend 106,000, we could see a rebound toward the 110,000–112,000 region. However, a confirmed breakout below the Buyer Zone would open the path to TP1 = 106,300 and possibly extend the correction lower. Please share this idea with your friends and click Boost 🚀

USD/JPY(20251023)Today's AnalysisMarket News:
The shutdown continues, and the US Senate has rejected the temporary funding bill for the 12th time.
Technical Analysis:
Today's buy/sell levels:
151.83
Support and resistance levels:
152.38
152.17
152.04
151.61
151.48
151.27
Trading Strategy:
If the stock breaks above 152.04, consider buying, with the first target price being 152.17.
If the stock breaks below 151.83, consider selling, with the first target price being 151.61.

AUDUSD: Monitoring Downside MomentumDaily Timeframe:
Yesterday's session closed with a doji (inside bar). There's a lot of indecision going on. Price is maintaining below the HTL, however, the ranging bars may indicate that there's a lack of selling pressure.
If momentum does not pickup, we might see a fakeout. For the time being, I still maintain a bearish stance on the daily timeframe.
H1 Timeframe:
Price is breaking below the ATL, which is the first indication that momentum may be picking up throughout the Asian session.
Price remains choppy around the EMAs, which is a less reliable momentum signal.
However, I do think this pair has potential if price does not close back above the ATL.

GBPJPY: Trend ContinuationOver on the daily timeframe, price is respecting the EMAs. This is indicating a clear uptrend. In addition, the HTL is a resistance turned support level so overall bullish sentiment unless price crosses back below this level.
The H1 timeframe is also supporting the notion that there's momentum to the upside. Structurally, there's momentum to the upside. This is first indicated by price breaking above the DTL.
In this case, price's acceleration away from the EMA is not clear signal. This was quite choppy since October 12th.
There's potential to the upside, but I'd approach this pair a bit more cautiously.

EURJPY: Trend ContinuationThe daily structure is indicating that price is trading in the direction of the overall uptrend. Price is held supported and it bounced off of the EMA20.
Over on the H1 timeframe, there's quite a few confluences. There's a chance that momentum really picks up in this session.
Price is breaking above DTL, indicating momentum has a chance to pick up going into this Sydney/Tokyo session.
Price is also showing confluence with the higher TF, trading in the direction of the uptrend.
Price is also exiting away from the EMA band. However, there's a lot of overlap with the EMAs so it's a rather weak signal.

AUDCHF: Breaks Below ATLPrice is breaking below the ascending trendline (ATL), which is a signal that the counter-trend move is coming to an end.
The H1 timeframe also demonstrates confluence across price's crossover below the ATL and price's acceleration away from the EMAs.
This is further supported by the fact that price is holding below the horizontal trendline (HTL) on the daily timeframe. We can overall maintain a bearish bias for the time being.
Given that this trade signal is close to the 5 PM rollover, it may result in a closure and then re-entry to avoid a spread spike.

GBPUSD Short Confluence and stacking the oddsFPMARKETS:GBPUSD
Fundamental: Bearish (5/5).
Technical: Bearish (7/7) — Diamond Vault (7-Stack) candidate; SL=0.0121, TP distance=0.0314.
Weak UK inflation and growth; dollar steadies. Trend structure bearish across EMAs; momentum favors sellers while rebounds face supply overhead.

GBP/USD - Fundamental Drive Ahead! (21.10.2025)🧠 Setup Overview:
GBP/USD has broken below its rising trendline after testing the 1.3470 resistance zone multiple times. The pair is under fundamental selling pressure, fueled by risk aversion and renewed U.S. dollar strength.
Fundamental Drivers:
1️⃣ U.S. markets gained as President Trump decided not to impose very high tariffs on Chinese goods, which temporarily boosted sentiment.
2️⃣ However, investors are now digesting U.S. credit risks and US–China trade tensions, both adding safe-haven demand to the USD.
3️⃣ Meanwhile, the UK economy faces uncertainty from softer consumer spending and weak housing data — further limiting GBP’s upside potential.
📉 Technical Plan:
Bias: Bearish below 1.3400
Structure: Trendline breakdown confirmed
Cloud Resistance: Adds confluence to downside momentum
Next Levels to Watch:
🟥 1st Support: 1.3349
🟥 2nd Support: 1.3310
📊 If price closes below 1.3349 on the 30-min chart, further selling pressure may extend toward 1.3310 and possibly deeper if fundamentals align.
#GBPUSD #Forex #TechnicalAnalysis #PriceAction #Ichimoku #TrendlineBreak #FXMarket #BearishSetup #TradingView #KABHI_TA_TRADING
⚠️ Disclaimer:
This analysis is for educational purposes only — not financial advice. Always manage your risk and use proper position sizing before entering any trade.
📣 Support My Work
If you found this analysis useful — LIKE 👍, COMMENT 💬, and FOLLOW 🔔 to stay updated with daily Forex setups!

GBP/NZD - Wedge Breakdown (20.10.2025)📊 Setup Overview:
GBP/NZD has formed a Rising Wedge Pattern on the 30-min chart, signaling a potential trend reversal from the recent bullish structure. The pair has also completed a Cloud Cross, indicating early bearish momentum as price begins to break below the wedge support line. OANDA:GBPNZD
📈 Trade Plan: Bias: Bearish
Sell Entry Zone: Below 2.3400 (after candle close confirmation)
1st Target: 2.3288 ✅
2nd Target: 2.3277 🎯
Resistance Zone: 2.3479 – 2.3523
🧩 Technical Highlights:
1.Rising Wedge pattern breakdown – early bearish signal
2.Ichimoku Cloud Cross confirms downside pressure
3.Volume profile thinning below 2.34, showing potential liquidity vacuum
4.Clean bearish structure with clear risk–reward setup
#GBPNZD #ForexAnalysis #WedgePattern #BearishBreakout #Ichimoku #PriceAction #TechnicalAnalysis #ChartSetup #SwingTrade #TradingView #FXMarket #Kabhi_TA_Trading #ChartsDontLie #TradersDontQuit #ForexSignals
⚠️ Disclaimer:
This analysis is for educational purposes only and not financial advice.
Always confirm setups with your own analysis and manage risk properly before entering any trade.
💬 Support This Analysis:
If this setup helped your trading view — LIKE 👍, COMMENT 💬 your thoughts, and FOLLOW ✅ for more daily forex setups and chart breakdowns from Kabhi_TA_Trading!

EURJPY: Trend ContinuationI've made several key annotations on this chart. There are several things that I like.
The first is the clean daily structure as price is respecting the EMAs and is making clear breaks above the HTLs.
Over on the H1 timeframe, price crossed above the DTL Although it stalled a bit, it did not successfully make any new lows. Overall, selling pressure does not seem to be present.
My entry signal is based on the bullish bar exiting the EMA band, which is a sign that momentum to the upside will likely pick up.

USDJPY Long #confluence country #trade the stacks. OANDA:USDJPY
Fundamental: Bullish (5)
Technical: Bullish (6/7) — actionable threshold met (≥6)
20-word summary: Dollar-yen supported by rate differentials; EMAs aligned; momentum constructive; watch 152 zone and intervention risk while trend persists this week.
Actionable Trade (Long): ATR 1.181 → SL distance 1.79512; Stop 150.08088; TP 156.54331 (2.6R).

Silver rally: Are you in?Silver (XAGUSD) just hit a new all-time high, soaring above $53/oz! The surge is driven by a real physical shortage in London (record-low LBMA stocks, spike in lease rates, and COMEX premium), flight to safety amid dovish Fed expectations and gold’s rally, and booming industrial demand from solar energy and electronics. A short squeeze is also underway due to the rising cost of borrowing silver.
5 key drivers behind the XAGUSD bull run:
1. The market is short on metal – demand consistently outpaces supply.
2. Physical squeeze in London – inventories are depleted, spot trades above COMEX, borrowing costs surge.
3 . Industrial super-demand – energy transition fuels silver use in solar, electronics, and EVs.
4. Dovish macro backdrop – Fed rate cuts expected, weaker USD, inflows into safe havens.
5. Capital inflows – silver ETFs and bullion/coin demand picking up momentum.
FreshForex analysts see further upside: the breakout to new highs confirms strong demand for physical silver and sustained investor interest. The rally in gold and robust industrial trends give the silver market breadth and staying power. Q4 2025 offers great potential for active traders, but the strongest move is expected in Q1 2026 , as Fed policy loosens and supply remains tight

Bullish Bias Toward $4,400+🌍 Fundamental Overview
Gold is trading around $4,135–$4,155/oz, staying firm despite mild USD recovery.
Friday’s U.S. data (Michigan Consumer Sentiment, inflation expectations) came slightly higher, but Fed cut expectations remain unchanged — markets still price 99% chance of a rate cut in October.
Geopolitical backdrop remains tense — Middle East concerns, ongoing U.S.–China trade friction, and soft global growth outlook keep gold demand resilient.
ETF inflows show renewed interest; central banks (China, Turkey, India) continue accumulating.
Short-term: Profit-taking possible early this week; medium-term trend remains bullish toward $4,300+.
📊 Technical Overview
Current Price Range: $4,135 – $4,155
Support Zones:
$4,120 (minor intraday support)
$4,080 (major short-term floor)
$4,050 (psychological & structural support)
Resistance Levels:
$4,180
$4,200 (key breakout zone)
$4,300 (next major upside target)
Trend: Bullish consolidation — healthy sideways price action above $4,100 zone.
RSI (H4): Resetting from overbought, suggesting space for renewed upside momentum.
🎯 Trading Strategy
1️⃣ Buy Dip Setup
Entry: $4,090–$4,120
SL: below $4,050
TP: $4,180 → $4,220
2️⃣ Breakout Buy
Entry: above $4,180 (confirmed 1H close)
SL: below $4,150
TP: $4,250 → $4,300
3️⃣ Short Scalp (Counter-trend)
Entry: $4,180–$4,200 (if rejection appears)
SL: above $4,220
TP: $4,120 → $4,080
📌 Bias: Bullish above $4,080 — watch for early-week volatility and liquidity traps.

Fundamental Market Analysis for October 21, 2025 GBPUSDThe pound has retreated from last week’s highs as the market prepares for fresh UK price data and weighs it against recent Bank of England signals. After the August rate cut to 4.00%, policymakers emphasize that any further easing should be cautious given the risk of still-elevated inflation—higher than in most G7 peers. That tempers excessive optimism on sterling and makes the reaction to CPI potentially asymmetric: softer prices would support expectations of later cuts, while stickier readings would revive concern about persistent inflation.
The US backdrop works against cable: the ongoing partial suspension of federal agency operations in the US boosts demand for the reserve currency during bouts of uncertainty, and high US real yields continue to attract global capital. Until markets receive a clean run of US data and clarity on the budget, the dollar’s near-term advantage remains.
Domestic fundamentals also constrain sterling: households remain sensitive to borrowing costs, business investment is uneven, and the services surplus cannot fully offset external risks. As a result, scope for a swift sterling advance is limited, with the balance of risks favoring moderate profit-taking after the climb toward the 1.34 area.
Trading recommendation: SELL 1.34050, SL 1.34550, TP 1.33550

USD/JPY(20251021)Today's AnalysisMarket News:
The US government shutdown entered its 20th day on Monday after senators failed to break the impasse for the tenth time last week. The shutdown has also delayed the release of key economic data, leaving investors and Federal Reserve policymakers with a data vacuum ahead of next week's policy meeting. The US Consumer Price Index (CPI) data, delayed by the shutdown, is scheduled for release this Friday. Meanwhile, traders are pricing in a 99% probability of a Fed rate cut next week, with another cut expected in December. As a non-interest-bearing asset, gold typically performs well in a low-interest rate environment.
Technical Analysis:
Today's Buy/Sell Levels:
150.73
Support and Resistance Levels:
151.65
151.30
151.08
150.37
150.15
149.81
Trading Strategy:
On the upside, consider buying on a break above 151.08, with the first target at 151.30.
On the downside, consider selling on a break below 150.73, with the first target at 150.15.

USDJPY: Holds Above HTLOn the daily timeframe, price broke through a previous HTL, which is now acting as support. There's also uptrend confluence signaled by price remaining above the EMAs and EMA20 being above EMA60.
Over on the H1 timeframe, price is also beginning to deviating away from the EMAs, which signals to me that there's momentum picking up.
In addition, price is also breaking above the DTL right now, which indicates that the counter-trend move is likely over.

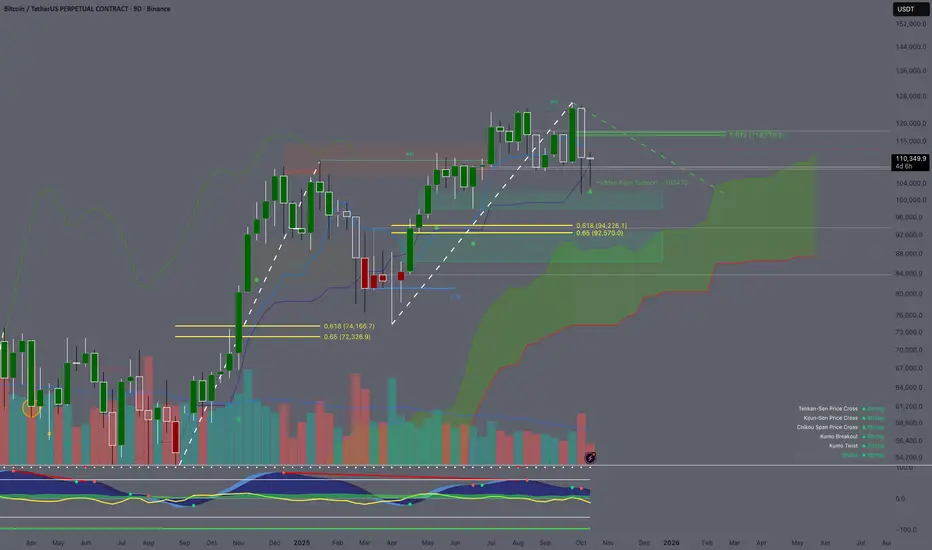
9D Timeframe Analysis using Ichimoku Cloud / Fib/ ICT
Price Action: The candle is pushing north and attempting to turn into a green candle. If the candle successfully turns green and creates a big long wick. The candle can be the support candle for this bullish. The candle won't be closed until this Friday night. Since the candle already discovered the south side and created long wicks. If the candle turns green we will experience the new discovery price on the north side.
Ichimoku Cloud: The price is currently trading above the Kijun-Sen ($109,454.3). If the price continues trading above this level. The trend is validated by the Kijiun-Sen. The Kijun-Sen sometimes plays a role such as a healthy pull back point where you can enter for a long position or a confirmation of a trend. The prices usually pulled back to this line after all time high. Price usually consolidated between (above/below) the lines before the pump in a bull market. The Kijin-Sen is also pushing upward which is a bullish sign but the Tenkan-Sen is flattened out. When the Tenkan-Sen is flat out, the price tends to trade sideways or we can say that the momentum has reduced. Cloud A is still shifting upward while Cloud B has flatted. Cloud A shifting upward means the momentum is still there but the current momentum which is the Tenkan-sen is flat.
Fibonacci: I drawed a fibonacci from $126208.5 to $101.516.5. The all time high point to the 20 billions liquidated event in crypto space. 1 candle made all time high and 1 candle flash crashed to the fair value gap. With the fibonacci, the 0.618 and 0.65 are showing $116,776.2 and $117,566.3. If the low range fib is the bottom then the price has to retrace back to 0.618 in others to continue the massive sell off. So this is playing a key level on the bears for short.
Fair Value Gaps (FVGs): There is a fair value gap when I draw a fip from the previous low in April to the all time high end of September. There is a fair value gap at the 0.65 fib level. Which shows that if the price is retraced back to that level. We are sill in the up trend in favor of the bull
Cipher B: The vwap is trading below money flow and momentum. The Money flow has flatted out while momentum is going down. This is not a good sign because the vwap is pointing south and trading below moneyflow which could lead to the consolidation. The consolidation is not always bad but shows that the trend is cooling down.
Key Levels: 0.618 from bull and bear. If the price is dropped to the fair value gap which is $94.226.1. The actual fair value gap at 0.65 not 0.618 but those levels go together. We will call 126208.5 the top. But if the price is defense above the Kinjun-Sen and does not retrace at the 0.618 from the high to the wick then we are not at the top yet.
Outlook: The change in Tenkan-Sen and Kijun-Sen. The shift of direction in those will be first noticed before anything other factors. Also price trading above/below/between those levels as well.
AUDCAD potential long setupLooking at AUDCAD this morning and noticed the 3 bounces off the Monthly 50EMA (overlayed on this 4H chart). The pair is stuck in a wide range after a strong September rally linked to the gold (commodities) strength and above forecast AUD economic data. The pair is also sitting at a critical trend line support while RSI is positioned well for a move upward.
Fundamentally, precious metals are erasing Friday's losses while a meeting between President Trump and Australian PM Albanese is set to take place Monday morning to discuss a critical minerals deal (among other topics), which could boost the AUD significantly. In the meantime the Canadian government continues to follow Brussel's lead in economic obliteration and CAD insignificance.
I could be wrong, I'm a nobody.

USDCHF: Momentum into NY SessionKey Observations
This pair is starting off slow, but I'm expecting momentum to pick up during the New York session.
The daily chart is indicating an overall downtrend. Price is holding below both EMAs. However, the price action is a little bit weaker and the daily HTL isn't a significant level.
On the H1 timeframe, price is showing overlapping bars. I am hoping to see a stronger break to the downside as price crosses out of the EMA brand and accelerates.

GBPCAD: Price Supported Above Daily HTLKey Observations
Price is holding above the daily HTL, which is a good sign that this breakout is likely structural and there isn't much selling pressure (resistance)
On the H1 timeframe, price is also showing a similar characteristic. Price tried to trade below the EMA but could not.
Since price is accelerating to the upside once again, it's likely we'll be seeing trend continuation throughout the rest of the week.

EUR/USD - Outlook (LTF ranging market)🔥 EUR/USD Outlook Breakdown 🔥
Let’s decode this clean structure — multi-time-frame style with a punch of trader slang 👇
🧭 Weekly Timeframe
We’re chilling just under a long-term bearish resistance trend, and the last few weeks show clear compression beneath that line.
The weekly breakout candle couldn’t sustain upside, hinting sellers are still lurking.
Price holds under 1.1800, keeping HTF (higher-time-frame) structure bearish.
➡️ Eyes on the 1.1500–1.1450 zone as next liquidity grab if momentum kicks in.
📆 Daily Timeframe
Daily shows a ranging market between 1.1750 resistance and 1.1550 support.
We saw a BOS earlier in the structure, but bulls couldn’t follow through.
Multiple rejections from the supply block confirm short-term hesitation.
The support trendline is hanging on — but if it snaps, expect the cascade to begin.
Targets line up clean:
🎯 Target 1: 1.1400
🎯 Target 2: 1.1150
🎯 Target 3: 1.1000
⏰ 8H Timeframe
On the 8H, we’re playing ping-pong inside that same range.
Price grabbed the BSL (Buy-side Liquidity) up top and retraced to the mid-range demand.
Both BH zones are acting as intraday traps — classic indecision setup.
Until we break out clean, expect chop.
➡️ However… here’s the key line:
“HTF supports bearish price action although STF is currently ranging giving unclear direction. HTF will take control.”
That means we’re likely setting up for a fake bullish pop before a strong bearish drive, once HTF order flow dominates.
🎯 Trade Idea
Bias : Bearish (waiting for HTF dominance)
Setup : Sell the fake-out above range highs or on break & retest of 1.1550 support
Targets : 1.1400 → 1.1150 → 1.1000
Invalidation : Daily close above 1.1750
Gameplan : Stay patient — HTF flow will win.
⚡ Summary
EUR/USD is stuck in a rangey mess, but the bigger picture screams bearish.
When HTF takes back control, expect a breakdown toward 1.1400+ zones.
Shorts will be the move once that range floor cracks.
