The Trap Is Set — Ethereum Preparing for Liftoff🚀 ETHEREUM 4H OUTLOOK – ACCUMULATION BEFORE BULLISH EXPANSION
1. Market Structure Overview
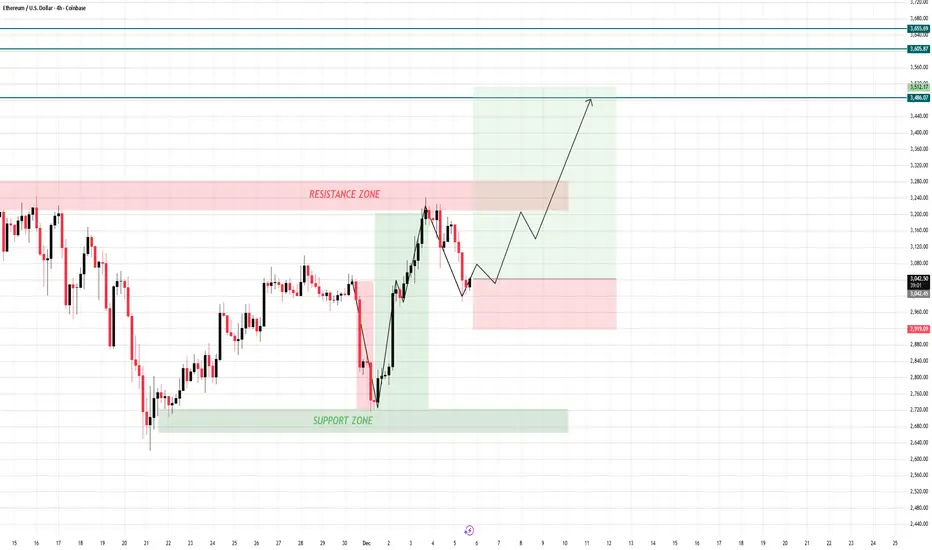
- ETH is currently respecting the broader bullish structure after rejecting from the upper Resistance Zone (≈ 3,180–3,220) and pulling back into the mid-range.
- The recent drop is not a reversal; it is a healthy retracement into demand after an impulsive rally.
- Price is now stabilizing above the Support Zone (≈ 2,940–2,970) — the key area that previously launched a strong bullish leg.
✔ The trend remains bullish on higher timeframes
✔ Current structure shows a corrective pullback into liquidity
✔ Bullish orderflow still intact as long as support holds
2. Scenarios Ahead
🔹 Main Scenario (High Probability) – Bullish Continuation
If price holds above the support area and continues forming higher lows:
→ ETH is expected to bounce and build structure toward the upside.
Upside Targets:
🎯 3,460
🎯 3,605
🎯 3,655 (major liquidity + extended target)
The drawn projection on your chart (higher low → stair-step structure → rally) is perfectly aligned with bullish continuation.
🔹 Sub Scenario (Low Probability)
If ETH breaks below 2,940, structure shifts short-term bearish:
→ Deeper pullback into 2,850 – 2,880
→ Only triggered if a clean break + close below support happens.
Currently, there is no confirmation for this scenario.
3. Summary – Structure & Liquidity Alignment
ETH continues to follow a textbook bullish model:
✔ Corrective pullback into demand
✔ Accumulation above support
✔ Clean rejection from supply, but no trend reversal
✔ Bullish projection remains valid toward liquidity clusters above
The move is simply compression → accumulation → expansion.
4. Intraday Trading Setups (Based on Chart Structure)
📌 SETUP 1 – Intraday Buy Setup (Preferred Scenario)
ETH BUY ZONE:
👉 2,940 – 2,970
Take Profit:
🎯 3,120 – 3,180 (short-term)
🎯 3,460 – 3,605 (swing)
Stop Loss:
❎ 2,915
⚠ Manage risk properly — crypto volatility is high.
📌 SETUP 2 – Intraday Sell Setup (Only for Countertrend Traders)
ETH SELL ZONE (Resistance):
👉 3,180 – 3,220
Take Profit:
🎯 3,050 – 3,000
Stop Loss:
❎ 3,245
⚠ Countertrend trades should use smaller sizing.
Stay patient. The market always rewards those who wait for price to come to their zone — not those who chase it
Analysis
EURUSD Early Week Bullish Outlook After Tokyo SweepQuick Summary
EURUSD remains strongly bullish, and the recent corrective decline is healthy for bullish continuation. Price is expected to dip early in the week to sweep the previous Tokyo low and go deeper into the hourly orderblock that aligns with the ascending trendline before resuming its upward move.
Full Analysis
The EURUSD continues to show strong bullish momentum, and the recent pullback is completely in line with a healthy trending market. Despite the strength of the prior upward move, the pair produced a controlled correction
This corrective move is particularly meaningful because price tapped into a clean hourly orderblock that aligns perfectly with an ascending trendline. Such confluence typically provides a strong foundation for buyers, showing that the market structure remains intact and supportive of further upside.
As we head into the new week, the expectation is that EURUSD may continue to dip slightly to sweep the previous Tokyo low. This potential sweep is important because the liquidity resting below that level can act as fuel for the next bullish expansion. Once the liquidity beneath Tokyo is taken, price is likely to react strongly from the same hourly orderblock zone and resume its upward trajectory.

XAUUSD Long: The 4,160 Support Holds – Path to 4,260 is OpenHello, traders! The price action for XAUUSD is currently developing within a well-defined ascending trend structure, supported by a rising major Trend Line from the lows. The market previously showed multiple rejections from the Triangle Supply Line, each marked by clear breakout attempts followed by corrective pullbacks. These reactions formed a sequence of higher lows, confirming that buyers remain in control of the broader structure.
Currently, after the last strong impulsive move upward, Gold reacted from the Supply Zone around 4,260, forming a short-term corrective phase while respecting the rising Triangle Demand Line near the 4,160 demand level. Price is now compressing between the descending supply line and the ascending demand line, creating a tightening triangle structure that signals growing pressure for a directional expansion. This compression reflects a balance between profit-taking sellers at resistance and aggressive dip-buyers along demand.
My scenario for the further development is bullish continuation as long as price holds above the Triangle Demand Line and the 4,160 demand zone. I expect a rebound from current levels, followed by a renewed attack on the 4,260 Supply Zone. If buyers manage to produce a clean breakout above this resistance, Gold may accelerate toward higher targets with strong momentum continuation. However, if the supply zone holds and price breaks below the demand line, a deeper corrective pullback toward the main rising Trend Line could develop. For now, the structure favors buyers, with the key focus on a breakout attempt toward 4,260. Manage your risk!

BTCUSDT Long: Buyers Defend 91K Zone – Targeting 96K ExpansionHello, traders! The current BTCUSDT price action is developing within a strongly structured bullish environment after a prolonged decline driven by the Descending Channel. Earlier, the market broke down from the upper supply region and continued to move lower while respecting the descending channel boundaries. After reaching a pivot low near the demand zone around 91,000, buyers stepped in, initiating a reversal and shifting momentum to the upside. Following this, Bitcoin formed a clean Ascending Channel that confirmed growing bullish pressure. Price then entered a Range phase, indicating temporary equilibrium before the next impulsive move. After completing this consolidation, BTCUSDT created a clear Head and Shoulders reversal structure near demand, signaling a strong bullish reversal. Buyers took control and pushed price sharply upward, breaking through the range and reclaiming higher structure levels.
Currently, BTCUSDT is trading inside a new Ascending Channel, steadily climbing toward the 96,000 supply level, where sellers previously reacted. As long as price remains above the 91,000 demand zone and continues to respect the ascending channel structure, the bullish scenario remains valid. The next upside target is the 96,000 resistance area, aligned with the upper channel boundary.
My scenario is a continuation toward 96,000 as long as buyers maintain control of the channel. However, a strong rejection from this supply zone may trigger a corrective pullback back toward demand before buyers attempt another move upward. Manage your risk!

XAUUSD: Triangle Breakdown Setup Points Toward $4,160 SupportHello everyone, here is my breakdown of the current Gold setup.
Market Analysis
Gold has recently moved out of a strong upward channel, where price previously showed consistent bullish momentum supported by higher lows and clean breakouts. After breaking out of the first channel, XAUUSD formed a consolidation range, signaling temporary equilibrium between buyers and sellers. This range acted as a base for the next impulsive bullish leg, which drove price back into a new upward channel. However, after the strong rally, gold formed a fake breakout near the $4,240 resistance area, which coincides with the upper boundary of the triangle resistance line. This false breakout indicated weakening bullish pressure and exhaustion near the top of the structure. Once price failed to hold above the resistance, it rotated downward and began forming a tightening triangle pattern between the descending resistance line and the rising support line.
Currently, XAUUSD is trading inside this triangle structure, with price gradually compressing. The $4,160 support level remains a key reference point, as it previously acted as a major demand zone during the last correction and is now aligned with the triangle’s lower boundary.
My Scenario & Strategy
My scenario is bearish as long as gold stays below the triangle resistance line and continues to respect the lower highs forming within the pattern. If price maintains this structure and fails to reclaim $4,240, I expect a downward move toward the $4,160 support zone.
Therefore, a clean breakdown below the triangle support line would confirm bearish continuation and could open the door for a deeper correction. On the other hand, if price rejects the support and breaks above the triangle resistance, the bearish setup becomes invalid, and buyers may attempt another retest of the $4,240 level. For now, the structure favors a short bias with the main objective being a move toward the $4,160 support level, which remains the next significant target for sellers.
That's the setup I'm tracking. Thank you for your attention, and always manage your risk.

EURUSD Uptrend Structure Intact — Path Toward 1.1700 ResistanceHello traders! I want to share my view on the current EURUSD setup. After a corrective decline, the pair formed a solid local bottom around the Support Level near 1.16200–1.16400, where buyers stepped in and stopped the downward momentum. As shown on the chart, price is now trading inside a clear ascending structure, supported by the rising Support Line and guided by a parallel Resistance Line, forming a well-defined upward channel. Inside this structure, the Buyer Zone has played a key role, serving as the base for multiple impulsive breakouts in the past. Several breakdown attempts turned into fake breakouts, confirming that buyers continue to defend this area and maintain short-term trend control. After these rebounds, EURUSD pushed into the upper part of the channel, reaching the Resistance Line and forming a local rejection that caused a pullback back toward the Buyer Zone. Currently, price is hovering near the ascending support line, and as long as EURUSD stays above the 1.16400 support area, the bullish scenario remains intact. If buyers successfully defend this zone and maintain structure inside the rising channel, I expect the market to move toward TP1 → 1.17000, which aligns with the major Resistance Level highlighted on the chart. A clean breakout above this level would open the way for further continuation, potentially driving the pair deeper into the higher resistance zone. However, if the price breaks below the Buyer Zone and violates the ascending Support Line, the bullish scenario becomes invalid, and the pair may revisit lower support levels around the 1.16000 area. For now, the structure remains moderately bullish as long as demand holds and EURUSD continues respecting the rising channel. Please share this idea with your friends and click Boost 🚀

EURUSD Bullish Continuation After Expected CorrectionQuick Summary
A short term corrective move may occur on EURUSD to retest the Bullish trendline where the 61 Fibonacci level aligns with a clean orderblock. This confluence strengthens the likelihood of a bullish continuation once the correction is complete.
Full Analysis
The EURUSD is still maintaining an overall bullish structure, but the current price action suggests that a corrective decline could develop before the pair continues its upward movement. This expected pullback is not a sign of weakness but rather a healthy retracement within an established uptrend.
The key area to watch lies around the Bullish trendline, or slightly above it, where multiple elements converge to form a high probability demand zone. The 61 Fibonacci retracement level aligns almost perfectly with this Zone, providing a strong technical base for buyers to re enter the market.

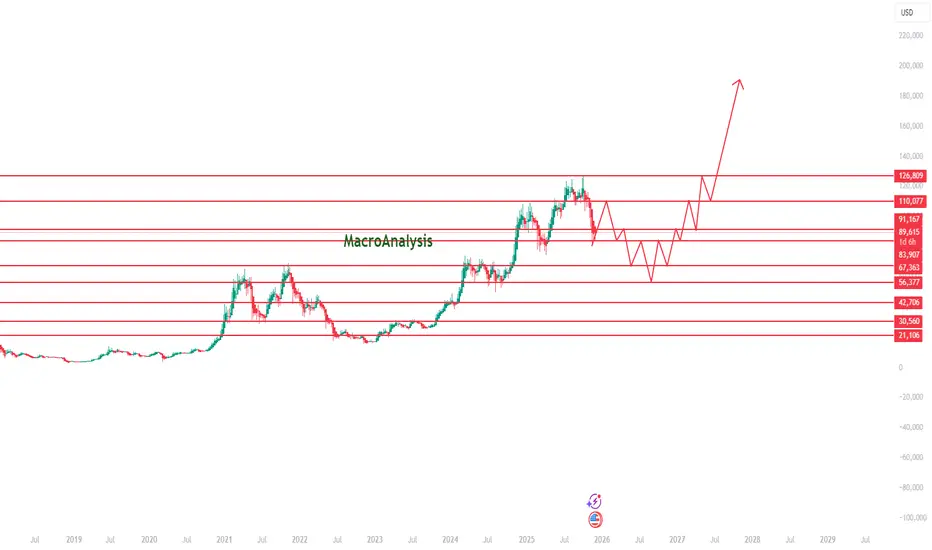
BTC Macro Roadmap: Multi-Year Support/Resistance StructureThis chart presents a long-term BTC roadmap based on major weekly and monthly support/resistance zones, reflecting how BTC typically behaves during mid-cycle phases. Price has recently reacted to the 110K macro resistance, triggering a corrective leg that fits the broader rhythm of previous BTC cycles.
The projected path highlights a realistic multi-stage structure:
• Mid-Cycle Corrective Phase
BTC is forming lower highs and lower lows after the rejection from 110K, with a likely retest of key demand zones between 83K → 67K. Deeper liquidity sweeps into the 56K region remain possible before establishing a macro higher low.
• Accumulation Zone
Inside this lower region, BTC historically creates sideways, choppy movement—sweeping liquidity both directions as market participants reposition. This mirrors prior mid-cycle accumulation phases and sets the foundation for the next macro advance.
• Recovery Phase & Re-Accumulation
Once accumulation stabilizes, structure favors a recovery back toward 91K → 110K, driven by regained momentum and market strength. A successful breakout from this zone signals the beginning of the next expansion wave.
• Macro Expansion Phase
Clearing 110K opens the door toward 126K–140K, the next major macro resistance region and potential cycle extension target.
This idea isn’t a prediction—it’s a structural map, focused on how BTC historically behaves around cycle midpoints: parabolic advance → correction → accumulation → breakout → expansion. The chart emphasizes market memory, key levels, and BTC’s typical volatility during expansion phases.
Macro Levels to Watch:
• 110,077 – major resistance, recent rejection zone
• 91,167 / 89,688 – mid-level pivot controlling short-term direction
• 83,907 – key support that preserves bullish structure
• 67,363 – strong historical demand and liquidity magnet
• 126,809 – next major resistance above ATH
Gold Forex Trading During Major Economic Events & News Releases
I guess you already noticed how impulsively the markets may react to economic events and news.
In this article, I will teach you a simple strategy to follow during important news release s and how to trade news.
1. Sort out the economic calendar
There are a lot of news in the economic calendar.
They are not equal in their impact.
Most of the economic calendars indicate the potential significance of each event: while some news have low importance, some have medium importance and some are considered to be extremely important.
For example, above is the list of coming UK fundamental news.
You can see that these news have different degree of importance.
My recommendation to you is to sort out the economic calendar in a way, so it would display only the most important news.
Among the news that we discussed above, only one release has high importance.
2. Know on what trading instruments does the news have an effect
While some of the news in the economic calendar may impact many financial markets and trading instruments, some news may affect very particular instruments.
For example, a FED Interest Rate decision may have a very broad effect on financial markets.
At the same time, Interest Rate Decision in Australia may affect only Australia - related instruments.
3. Don't trade one hour before the news and one hour after the release
Once you see the important fundamental news coming, don't trade the trading instruments that can be affected by the new s 1 hour before and after the release.
For example, in 5 minutes we are expecting important UK news - CPI data.
I stopped trading GBP pairs 1 hour before the release of the news, and will resume trading them one hour after the release.
4. Protect your trading positions 5 minutes ahead of the news
If you have an active trading position and related important news are expected, move your stop loss to entry 5 minutes ahead of the release of the news.
For example, I have a short trade on GBPAUD. I see that in 5 minutes important UK data is coming. I will move stop loss to entry 5 minutes ahead of the news and make a position risk-free.
I always say to my students, that news trading is very complicated. Due to a high volatility, it is very hard to make wise decision during the news releases.
The approach that I suggest will help you to avoid all that and trade the markets when they are calm.
❤️Please, support my work with like, thank you!❤️
I am part of Trade Nation's Influencer program and receive a monthly fee for using their TradingView charts in my analysis.

ETH — [2D] WEEK 49 TREND REPORT | 12/05/2025ETH — WEEK 49 TREND REPORT | 12/05/2025
Ticker: BINANCE:ETHUSDT
Timeframe: 2D
This is a reactive structural classification of ETH based on the weekly chart as of this timestamp. Price conditions are evaluated as they stand — nothing here is predictive or forward-assumptive.
⸻
1) Current Trend Condition [ Numbers to Watch ]
Current Price @ 3,030
• Trend Duration @ +70 Days ( Bearish )
• Trend Reversal Level ( Bullish ) @ 3,689
• Trend Reversal Level ( Bullish Confirmation ) @ 3,534$
• Pullback Resistance @ 3,914
• Correction Support @ 3,096$
• Structural Support @ 1,946$
⸻
2) Structure Health
• Retracement Phase:
Testing Structure (approaching 38.2%)
• Position Status:
Unstable (price below both structural layers)
⸻
3) Temperature :
Cooling Phase
⸻
4) Momentum :
Bearish
⸻
Author’s Note
DOWNWARD STRUCTURAL ALIGNMENT
This mark identifies a moment where the market showed clearer alignment with downside direction. It does not predict future movement, but acknowledges where weakness became more evident within the prevailing structure. Its relevance remains only while price continues to hold beneath key structural boundaries.
⸻
Methodology Overview
This classification framework evaluates directional conditions using internal trend-interpretation logic that references price behavior relative to its structural layers. These relationships are used to identify when price movement aligns with the framework’s criteria for directional phases, transition points, or regime shifts. Visual elements or structural labels reflect these internal interpretations, rather than explicit trading signals or preset indicator crossovers. This framework is observational only and does not imply future outcomes.

BTC — [2D] WEEK 49 TREND REPORT | 12/05/2025BTC — WEEK 49 TREND REPORT | 12/05/2025
Ticker: BINANCE:BTCUSDT
Timeframe: 2D
This is a reactive structural classification of BTC based on the weekly chart as of this timestamp. Price conditions are evaluated as they stand — nothing here is predictive or forward-assumptive.
⸻
1) Current Trend Condition [ Numbers to Watch ]
Current Price @ 89,200
• Trend Duration @ +98 Days ( Bullish )
• Trend Reversal Level ( Bullish ) @ 103,400
• Trend Reversal Level ( Bullishh Confirmation ) @ 103,400
• Pullback Support @ 100,002
• Correction Support @ 79,436
⸻
2) Structure Health
• Retracement Phase:
Correction (approaching 61.8%)
• Position Status:
Unstable (price below both structural layers)
⸻
3) Temperature :
Cooling Phase
⸻
4) Momentum :
Bearish
⸻
Author’s Note
DOWNWARD STRUCTURAL ALIGNMENT
This mark identifies a moment where the market showed clearer alignment with downside direction. It does not predict future movement, but acknowledges where weakness became more evident within the prevailing structure. Its relevance remains only while price continues to hold beneath key structural boundaries.
⸻
Methodology Overview
This classification framework evaluates directional conditions using internal trend-interpretation logic that references price behavior relative to its structural layers. These relationships are used to identify when price movement aligns with the framework’s criteria for directional phases, transition points, or regime shifts. Visual elements or structural labels reflect these internal interpretations, rather than explicit trading signals or preset indicator crossovers. This framework is observational only and does not imply future outcomes.

BITCOIN — THE MARKET IS APPROACHING ITS REAL DECISION POINTTraders,
We dumped. Now Bitcoin is grinding through a controlled recovery. The important question is not simply if we move higher. The real question is where the market will reveal its true intention. The chart is giving us a very clean map and the next major decision point is already forming.
1. The structure so far
Bitcoin sold off aggressively, found real buyers, and reclaimed the breakdown wick. That reclaim shows that the low was bought by spot demand rather than mechanical short covering.
Price is now pushing into a zone where the next expansion will be decided. The recovery itself is not the interesting part. The levels above and below are.
2. The major checkpoint above: 104k to 105k
This zone is extremely important. Two strong pieces of confluence meet here:
The 0.886 of the A to B retracement
The 1.618 extension of the impulse move you marked with the arrows
This creates a clean Potential Reversal Zone.
What this means:
If the market rejects 104k to 105k structurally, the next major destination becomes the lower imbalance cluster around 64k. That would be a true higher timeframe unwind because the entire path down is filled with thin volume and inefficient price action.
If Bitcoin breaks above 105k with flow support, then the next magnets open up immediately.
3. Targets above
If price accepts above the 104k to 105k PRZ:
First target area
Around 116k to 118k where we have a liquidity pocket and HTF inefficiencies.
Second target area
123k to 125k where a swing failure pattern is very likely. This is a weak high with resting liquidity and a natural magnet for price during bullish expansions.
At target two I expect the first serious reaction because of the liquidity sitting above the weak high.
4. Order flow confirms accumulation not distribution
Looking at the CVD grids:
Spot CVD is trending lower while price holds steady. This is a sign of absorption because someone is taking the other side of the selling.
Stablecoin margined CVD continues lower but without price following.
Coin margined CVD is sweeping lows with no breakdown in price.
This creates a hidden bullish divergence across the board.
Open interest also supports this view:
Stablecoin margined OI remains high which means traders did not exit during the dump.
Coin margined OI is slowly building which often appears before directional expansion.
This is not the profile of a market preparing for distribution. It is the profile of a market preparing for a move.
5. CME chart: AVWAP support from the last major swing
On CME, the AVWAP anchored from the previous major swing low to swing high is still holding as support. CME often leads during inflection zones. As long as this AVWAP holds, the market is positioned in a continuation PRZ rather than a breakdown PRZ.
If CME loses this AVWAP, the cascade scenario strengthens. As long as it holds, the bullish structure remains intact.
6. What happens if we break down instead
if Bitcoin fails to reclaim structure and breaks back down, the following levels become active:
83k to 84k
This is the shallow retrace zone and the first structural catch.
81k to 82k
This area contains the 1.113 extension and a previously unfilled FVG.
79k to 80k
This is the 1.272 level and a strong imbalance pocket.
72k to 73k
This contains the 1.414 extension and the next clean liquidity cluster.
64k
This is the 1.618 extension and the final major downside target. It aligns with the strong HTF imbalance that has never been fully tested.
A rejection from 104k to 105k can eventually lead price through these levels in sequence because the entire zone from 90k down to 70k contains thin volume. There is not much structural support built on the way up.
7. Real time confirmation tools
Watch these signals when we approach the 104k to 105k decision zone:
Spot CVD rising means continuation likelihood increases
Funding staying negative means shorts are still stuck
OI rising with price means momentum is building
CVD stalling or rolling over at 104k to 105k means rejection risk is high
CME AVWAP reclaim or failure will guide direction
If buyers hold flow above 105k, the path to 117k and then 124k is clean.
If buyers fail and we reject 105k with aggressive selling, the path down becomes active.
Final view
Bitcoin is approaching one of the most important technical levels on the chart.
We dumped on real flow.
We recovered on spot demand.
Now the market is converging toward the 104k to 105k PRZ where a true decision will be made.
Break above and the next magnets are 117k and 124k with a likely swing failure at the second target.
Reject and the lower zones activate with 64k as the eventual HTF destination.
This is the map. The levels are clear.
TLDR
BTC is recovering with spot support
104k to 105k is the major PRZ
Break above: targets at 116k to 118k and 123k to 125k
Reject here: downside levels at 83k, 82k, 80k, 73k and 64k
Order flow is showing hidden bullish divergence
CME AVWAP is holding which keeps the bullish narrative alive
The market leaves its footprints long before it shows its direction. Read the sands, follow the flow and stay prepared.
- ThetaNomad
----------------------------------------------
If you enjoy this style of analysis feel free to leave a like or comment. It lets me know you find value in these deeper structural and flow based breakdowns.
----------------------------------------------

EURUSD in strong bullish trendEURUSD remains in a clear long-term uptrend, forming higher highs and higher lows. The next key target is 1.17259, which could see a potential sweep of liquidity before any reaction. After reaching this level, a short-term corrective pullback is possible. The daily candle close will be crucial to confirm the pull back movement.

EURUSD Long: The 1.16200 Support Holds – Path to 1.17000 is OpenHello, traders! The price action for EURUSD is unfolding inside a corrective structure after a prolonged bearish phase that was guided by the descending Triangle Supply Line. The market previously formed a consolidation Range on the left side of the chart before breaking down and continuing lower. Price respected both the descending supply line and the ascending Triangle Demand Line, creating a compression phase that ultimately resulted in a bearish breakout to the downside. After forming a pivot low, EURUSD initiated a strong bullish recovery, breaking back above the former structure and confirming a shift in short-term momentum. The market then formed a clear Head and Shoulders reversal pattern near the Triangle Demand Line, reinforcing buyers’ strength. Following this, price successfully broke through the key Demand Zone around 1.16200, confirming the transition from corrective to bullish conditions.
Currently, EURUSD is retesting this demand area after the breakout, showing signs of support holding. As long as price remains above the 1.16200 demand zone, the bullish scenario remains valid. The next upside objective is the 1.16650–1.17000 Supply Zone, where sellers previously showed strong activity.
My scenario is a clean continuation toward Supply 2 at 1.17000 becomes likely if buyers maintain control. However, a rejection from this supply region could trigger a corrective pullback back toward demand before any further upside continuation. Manage your risk!

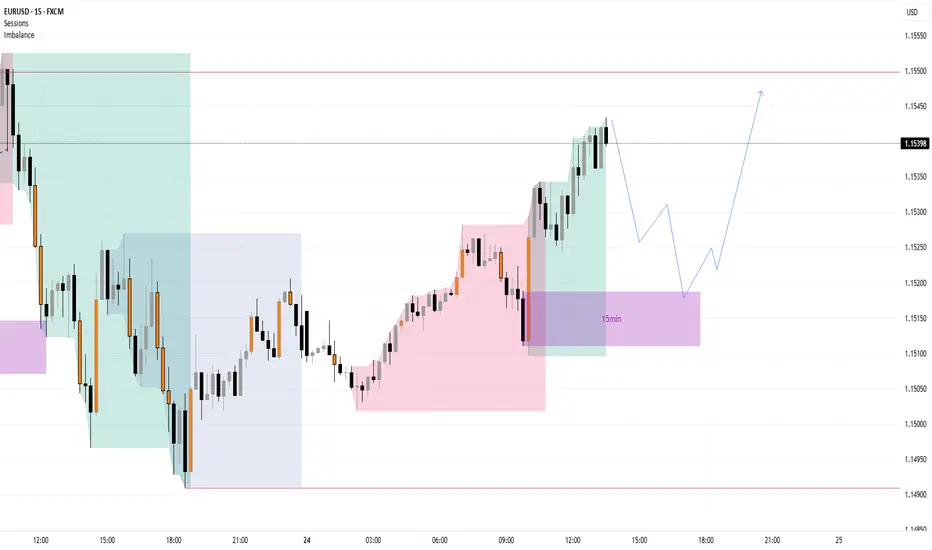
EURUSD Pullback Into 15min Orderblock Before Targeting LiquidityQuick Summary
EURUSD is expected to pull back into the 1.15191 15 Min orderblock, where a bullish reaction may form. If confirmed with a candle close and rejection signal, price may reverse upward toward the 1.15528 liquidity target on the H1 timeframe.
Full Analysis
Continuing the previous EURUSD outlook on the H4 timeframe, the pair is now approaching a notable orderblock around 1.15191. This zone has structural significance, as it aligns with the recent corrective leg and represents an area where institutional buying may reappear.
From a market-structure perspective, the movement toward this level appears corrective, suggesting that sellers may only be gathering liquidity before the next impulsive move higher. The market has a clear pool of targeted liquidity at 1.15528 on the H1 timeframe, making it a logical upside target if bullish orderflow resumes.
The preferred entry approach is a reaction from the 1.15191 orderblock, but only if the market provides proper confirmation. This includes a clear 15-minute candle close inside the zone, combined with a strong rejection signal, indicating that buyers are defending the level and absorbing sell-side liquidity.
If these confirmations align, the setup offers a clean continuation opportunity toward 1.15528, where liquidity rests above previous highs.
BTCUSD: Bullish Pressure Targets the $94,000 Resistance AreaHello everyone, here is my breakdown of the current BTCUSD setup.
Market Analysis
Bitcoin remains in a broader recovery phase after breaking out of the descending wedge structure that previously guided price lower. The initial breakout from the wedge led to a strong bearish continuation, but once BTC reached the major $90,200 Support Zone, selling pressure weakened and buyers stepped in aggressively. This support area has now been defended multiple times, confirming it as a key demand zone. From this base, price formed a clear Upward Channel, signaling a short-term bullish structure with higher lows respected along the channel support.
Currently, BTC attempted to break above the $93,700 Resistance Zone, but this move resulted in a fake breakout, showing that sellers are still active at this level. After the rejection, price pulled back toward the channel support and the $92,000–$90,200 support cluster, where buyers once again defended the market. Currently, BTC is trading back inside the ascending channel and attempting to resume the upward swing toward the upper boundary. The overall structure suggests a recovery trend as long as the price holds above the main support zone.
My Scenario & Strategy
My scenario is bullish, as long as BTC holds above the $90,200 Support Zone and continues to respect the ascending channel structure. I expect price to continue climbing toward the $93,700 Resistance Zone, which remains the key short-term target for buyers. A clean and confirmed breakout above this resistance would open the way for a continuation toward higher levels near the top of the channel.
Therefore, if price reaches the resistance again and produces another strong rejection, we may see a temporary pullback back toward the mid-channel area or even a retest of support. The bullish structure remains valid as long as BTC stays above $90,200. For now, the market supports a long bias with focus on a renewed attempt toward the $93,700 resistance zone.
That's the setup I'm tracking. Thank you for your attention, and always manage your risk.

Gold Bulls Hold Control — Targeting $4,320 ResistanceHello traders! Here’s my technical outlook on XAU/USD (Gold) based on the current market structure shown on the chart. After a strong bullish impulse earlier in the period, Gold formed a distribution Range below the main Resistance Level, where multiple upside attempts were rejected and the price eventually turned around from the upper range boundary. This rejection initiated a corrective decline that respected the descending Resistance Line, while buyers gradually began to defend the Support Line, leading to a compression structure that later transitioned into a reversal phase. Following this consolidation, Gold successfully broke above both the internal range and the descending resistance, confirming a shift in market structure. Price then entered a well-defined ascending channel, forming higher highs and higher lows along the rising Support Line. Several clean breakouts inside the channel confirm sustained bullish momentum, with buyers clearly in control as long as the channel structure remains intact. Currently, price is consolidating just above the $4,160–$4,140 support zone, holding above former breakout levels and respecting the lower boundary of the ascending channel. This behavior suggests a healthy bullish pullback rather than trend exhaustion. As long as Gold remains above this support area and holds inside the channel, the bullish scenario remains valid. My expectation is for a continuation move toward the upper boundary of the channel, with the main upside target at TP1 around $4,320, where the previous resistance and projected channel resistance converge. A clean breakout above this level would open the door for further bullish expansion. However, a sustained break below the $4,140 support or a drop out of the channel would weaken the bullish structure and could trigger a deeper corrective move. Please share this idea with your friends and click Boost 🚀

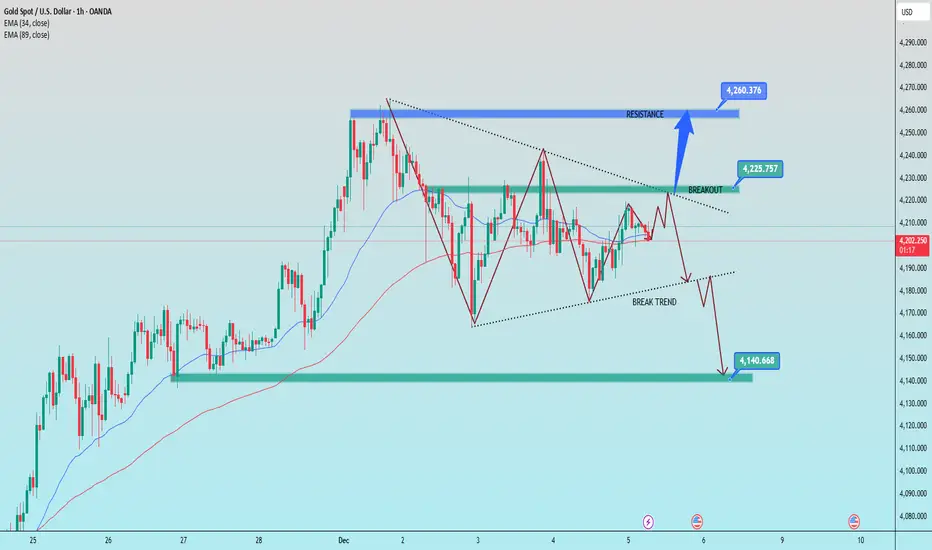
Gold price developments at the end of the week of December 51️⃣ Trend Line
Descent trend line (above – dashed line)
Price has been touched and rejected several times → becomes strong dynamic resistance.
The 4,225–4,230 price zone is a key area:
→ Valid breakout = opens upward momentum towards 4,260.
→ Failed breakout = price returns down following the previous trend.
Ascending trend line (below – dashed line)
This is dynamic support that maintains the short-term upward structure.
If price breaks through this trend line, a downtrend will activate.
2️⃣ Support Area – Key Resistance
4,225 – 4,230:
Confluence of the descending trend line + the previous supply zone → a designated area for buyers.
4,260 – 4,265:
Strongest resistance. When price touches this area, a downward reaction is likely.
Support
4,190 – 4,195:
The first area to be tested if the trend line is broken.
4,140 – 4,135 (lower green zone):
Very strong support – the main target if the downtrend is confirmed.
📌 Trading Signals
BUY GOLD: 4,140 – 4,138
Stop Loss: 4,130
Take Profit: 100 – 300 – 500 pips
SELL GOLD: 4,260 – 4,262
Stop Loss: 4,270
Take Profit: 100 – 300 – 500 pips
XAUUSD Long: Channel Support Holding — Buyers Target 4,300 ZoneHello, traders! The price auction for XAUUSD has been unfolding within a clearly structured bullish progression after a period of heavy distribution inside the Supply Zone. Earlier, gold established a wide Range between the Supply and Demand areas, with multiple sharp rejections forming the top of the structure. Eventually, sellers pushed the price lower, initiating a corrective decline that developed into a well-defined Triangle Pattern, marked by a descending Triangle Supply Line and a rising Triangle Demand Line. This compression ended with a clean breakout to the upside, signaling the beginning of a new bullish phase. Following the breakout, XAUUSD formed a Pivot Point near the mid-range level, where price briefly rejected before continuing its upward trajectory. Another notable phase was the formation of an inverse Head-and-Shoulders structure, confirming buyer strength after a fake breakout below the neckline. This reversal pattern provided the foundation for the current bullish continuation.
Currently, gold is trading inside a strong Ascending Channel, respecting both channel boundaries with consistent higher highs and higher lows. The latest breakout from the mid-channel zone has kept the bullish structure intact, and after a corrective pullback to the lower channel boundary, price is attempting to resume upward movement. As long as price holds within this channel, the market dynamics favor a continuation toward the 4,300 resistance target, which aligns with the upper boundary of the channel and the previously broken structure.
My scenario for the development of events is bullish, with expectations of a rebound from the lower channel boundary followed by a continuation toward the 4,300 resistance level. In my opinion, maintaining structure within the ascending channel supports further upside as long as buyers defend the 4,110 support region below. Manage your risk!

Fundamental Market Analysis for December 4, 2025 GBPUSDEvent to watch today:
15:30 EET. USD - Unemployment Claims
GBPUSD:
Sterling holds near five-week highs versus the dollar thanks to contrasting rate expectations: markets see an earlier Fed cut, while the Bank of England proceeds more cautiously given sticky services inflation and wages. Improved macro assessments for the UK and firmer global risk appetite support the pound and encourage demand for GBP-denominated assets.
At the same time, the dollar remains under pressure from softer U.S. indicators, redirecting flows toward higher-yielding G10 currencies. U.S. yields have stabilized without clear upside, reducing the dollar’s appeal as a defensive asset.
If this configuration persists, the pound has room for a gradual advance against the dollar. Risks relate to potential upside surprises in U.S. data or remarks from policymakers; however, for now the fundamental picture remains moderately constructive for GBP.
Trading recommendation: BUY 1.33500, SL 1.33150, TP 1.34550

$ETH/USDT ANALYSISOn the 15-minute ETH/USDT chart, price is trading inside an ascending channel, showing a gradual bullish structure but currently facing short-term weakness after rejecting near the upper boundary around $3,239. The candles have started pulling back below the 9- and 15-EMA zone, indicating momentum loss. Volume has slightly increased on the recent red candles, confirming mild selling pressure. The key intraday support lies between $3,120 – $3,140, which also aligns with the lower trendline and previous consolidation block visible in green. As long as ETH holds above that zone, overall intraday bias remains bullish, and the price could attempt another push toward $3,200 – $3,240. However, a confirmed candle close below $3,120 would signal potential short-term reversal or deeper correction toward $3,080 levels.

Tired of Entering Too Late? Here’s the Setup You Shouldn’t Miss1️⃣ Key Resistance Zone Rejected
Price tapped into the resistance area around 1.1638 – 1.1652, which previously acted as a strong supply zone.
The sharp wick rejection signals that buyers were unable to maintain momentum.
This is a high-probability reversal behavior.
2️⃣ Market Structure: Rounded Top + Liquidity Grab
The rounded top formation indicates slowing bullish momentum.
The long upper wick suggests a liquidity sweep before the expected bearish leg.
This aligns with institutional behavior:
➡️ sweep liquidity → fill orders → drop.
3️⃣ Short Entry Confirmation
The chart clearly marks the ideal ENTRY SHORT as the candle rejects resistance.
Entry Zone: 1.1635 – 1.1650 (depending on spread)
Stop Loss: Above 1.1652
Take Profit: Targeting the weak support zone and then deeper into the strong support below.
4️⃣ Expected Price Path
Based on structure + support layers:
- First drop toward 1.1570 – 1.1560
- Beak of this level → continuation to the 1.1551 zone
- If momentum is strong, eventual return to the major support block
This aligns with the clean pullback–drop model typical in a trending market.
📌 Summary
This is a textbook short setup:
- Clear resistance rejection
- Liquidity sweep
- Bearish structure forming
- Targets lining up with both weak and strong support levels
High-probability trade for sellers.

Gold plans in Asian and European trading sessions1️⃣ Trend Lines
• Descending Trend Line (Key Dynamic Resistance)
Price has touched this trend line several times but has not broken through, confirming that selling pressure remains dominant.
This is a crucial area: if a breakout does not occur, the price could potentially reverse sharply lower.
• Long-Term Ascending Trend Line
This is the main bullish structure in the market.
A larger decline will likely break through this trend line before the price reacts.
2️⃣ Resistance (Red Zone Above)
This is the intersection of:
✓ Descending Trend Line
✓ Nearest Local Peak (High)
This is the best sell zone under current market conditions.
Only if the price is able to close the candle with a strong breakout can a bullish reversal be confirmed.
3️⃣ Support (Green zone below)
This zone has been a recurring price reaction area, serving as important short-term support.
If the price breaks through this support zone, the downtrend will likely continue towards the long-term uptrend line.
📈 BUY GOLD: 4167 – 4165
Stop Loss: 4155
Take Profit: 100 – 300 – 500 pips
📉 SELL GOLD: 4264 – 4266
Stop Loss: 4276
Take Profit: 100 – 300 – 500 pips
