Fundamental Market Analysis for October 7, 2025 EURUSDThe euro (EUR) is weakening against the US dollar (USD) after France's new Prime Minister Sébastien Lecornu and his government resigned on Monday, just hours after the cabinet was announced.
Sébastien Lecornu resigned just a few weeks after his appointment, making his government the shortest-lived in modern French history. This raises concerns about a new political crisis in France and puts some pressure on the euro.
The ongoing US government shutdown may raise concerns about its impact on the country's economy, which could lead to a decline in the dollar and become a favorable factor for the main currency pair.
The Federal Reserve (Fed) is expected to cut rates by 25 basis points (bps) at its October meeting amid signs of a weakening labor market.
Trade recommendation: SELL 1.1665, SL 1.1745, TP 1.1480
Analysis

AUDUSD: Trend ContinuationKey Observations
Daily Timeframe:
EMA20 remains above EMA60 > uptrend indication
Price holds above HTL > no strong downside momentum
H1 Timeframe:
Price crossed above DTL and holds
Price pulled back to DTL and held above it
Price also exited EMA band with momentum strength

EURSEK: Trend ContinuationKey Observations
Daily Timeframe:
Price breaks HTL and shows downtrend confluence with EMAs
EMA20 is also expanding away from EMA60 to indicate the downtrend continuation
H1 Timeframe:
Swinging this downtrend as intraday upside is exhausted
Price is also showing confluence with EMA20 and EMA60

Bitcoin hits all-time high, altcoins follow suit!Bitcoin (BTCUSD) has smashed a new all-time high, reaching $125,700! The rally is fueled by steady inflows into spot ETFs, rising institutional interest, expectations of a softer Fed policy, and growing demand for safe-haven assets. Additional tailwinds include tech upgrades across networks and a revival in trading activity. This historic milestone for Bitcoin has lifted the entire crypto market. Investors are turning their attention back to top-10 altcoins — names with strong recognition, loyal communities, and clear development roadmaps.
Ethereum (ETHUSD) — trading around $4,558.76. The network has undergone major upgrades, making wallets more user-friendly and transactions faster and more stable. Layer-2 solutions are gaining traction, fees are becoming more predictable, and the network load is better distributed. As a result, investor interest in ETH-based tools and its ecosystem continues to grow. If Ethereum’s roadmap stays on schedule, it could further strengthen its position as the go-to platform for decentralized applications.
Solana (SOLUSD) — around $233.30. The ecosystem is preparing a high-performance validator module aimed at significantly boosting speed and resilience. This is critical for high-traffic use cases like exchanges, gaming, and micro-payment services. Solana is also set to gain the spotlight during a major industry conference later this year — a typical launchpad for new partnerships, grants, and product announcements. If improvements are implemented successfully, Solana could gain more ground in the fast and low-cost transactions segment.
BNB (BNBUSD) — approximately $1,208.83. The network continues to cut costs for users and developers, expand its toolkit for launching apps, and maintain price stability through regular supply control. The easier it becomes to build and scale on BNB Chain, the greater the volume — and the stronger the token demand. With security and performance updates expected on schedule, BNB remains a top-tier infrastructure asset.
FreshForex analysts believe Bitcoin’s record high reaffirms the global appetite for digital assets, while strong developments across major altcoins add depth and resilience to the market. Q4 2025 could deliver solid returns for active buyers — with the most powerful surge expected in Q1 2026.

EURUSD: Price Bounce Down from Triangle ResistanceHello everyone, here is my breakdown of the current Euro setup.
Market Analysis
From a broader perspective, the key event that has defined the current market structure was a 'fake breakout' above the 1.1785 Resistance. After briefly trading above this level, the price was aggressively sold off, signaling strong seller presence and shifting the market into a corrective phase.
Currently, this corrective phase has taken the form of a large symmetrical triangle.
My Scenario & Strategy
The current rally to the triangle's resistance is, in my view, a corrective move that is likely to fail as it runs into an area of seller interest.
I'm looking for the price to complete its move and test the Triangle Resistance Line. The key signal would be a clear rejection from this line, confirming that sellers are still in control and that the consolidation is likely to resolve to the downside.
Therefore, the strategy is to watch for this rejection. A confirmed failure would validate the short scenario, potentially leading to a breakdown from the triangle. The primary target for this move is the 1.1695 Support.
That's the setup I'm tracking. Thank you for your attention, and always manage your risk.

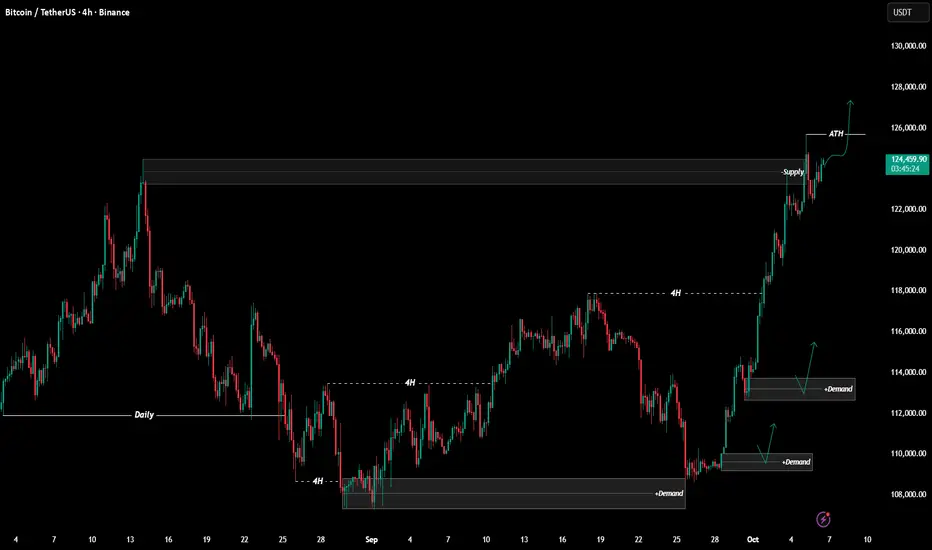
$BTCUSDT Analysis - Oct 6 | 4H Time FrameBINANCE:BTCUSDT Analysis - 4H
Hello and welcome to another analysis from the Satoshi Frame team!
I’m Abolfazl, and today we’re going to analyze Bitcoin on the 4-hour timeframe.
After reaching a new all-time high and making a slight correction, Bitcoin has started moving upward again and could rise up to $127,000
If we see any trend reversal in Bitcoin, we’ll discuss it in future analyses.
On the lower timeframe (15 minutes), you can look for buy positions targeting $127,000** and $130,000.
See you in the next analyses!
Stay tuned with the Satoshi Frame team...
USDCAD: H1 ConfluenceKey Observations
Daily Timeframe:
On Friday's close last week, price held above the daily level
This week's open indicate price is likely held supported
H1 Timeframe:
There's confluence on the H1 timeframe where price is crossing above the DTL
Price is also moving away from the EMA band, which indicates momentum could be picking up here

Fundamental Market Analysis for October 6, 2025 USDJPYThe yen weakened sharply in response to political news in Japan: the outcome of the leadership race in the ruling party boosted expectations of expanded fiscal stimulus. The market interprets this as a factor of easier domestic financial conditions and a more prolonged period of low rates. Long-dated Japanese government bonds are under pressure, further reducing the yen’s appeal as a funding currency.
The yield differential between the U.S. and Japan remains substantial, and the probability of a Fed rate cut already in October does not fully offset this gap. At the same time, the Bank of Japan remains cautious about the pace of normalisation, watching wage dynamics and services inflation. So far, signals from the regulator do not point to readiness for a series of rate hikes, which keeps the upward bias in USDJPY.
In the short term the pair is sensitive to Japanese authorities’ comments on FX volatility; however, against the current backdrop the fundamental vector remains upward. A move toward 150.950 is our base case; risks include verbal intervention and an abrupt drop in U.S. yields on weak data.
Trading recommendation: BUY 149.950, SL 149.250, TP 150.950

AUDUSD: Momentum Picking UpKey observations
Daily Timeframe:
Price holds above EMA20 and bullish bar indicates potential upside momentum
EMA20 remains above EMA60 to technically indicate uptrend
H1 Timeframe:
Price cross above DTL to indicate upside momentum
Price also crossing above EMA20 to indicate uptrend resumption

ES (SPX, SPY) Weekly Game Plan (Oct 6–10)Big Picture
Price is leaning into the 6,788–6,800 ceiling after a steady grind higher. Underneath, you’ve got stacked shelves: 6,778, 6,771/6,760, and 6,754. Lose that 6,754 floor and there’s an air pocket toward the 6,720s → 6,680s demand band. Expect rotations until the market either gets above 6,800 and sticks (trend-up week) or gets swatted back (rotate lower into value).
Weekly Bias & Likely Paths
Base case: Rotational around 6,788–6,800 until proven otherwise.
Bull path: Get above 6,800 and stick → pit stops 6,818–6,825 (TP1) → 6,856–6,862 (TP2) → stretch 6,895–6,905.
Bear path: Pop-and-fail at 6,800 → drift to 6,778 → 6,771/6,760 → 6,754.
Trend-down only if we close below 6,754 and fail the check-back, opening the 6,720s → 6,680s window.
Tomorrow’s Playbook — Level-KZ Protocol (15/5/1)
(NY AM window 09:30–11:00 ET; PM window 13:30–16:00 ET. Two tries per level max.)
Pop-and-Go LONG over 6,800 (Tier-1, full size)
Trigger: 15m close above 6,800 → 5m holds 6,788–6,792 and re-closes up → 1m higher high to enter.
Entry: 6,799–6,804 on the re-break.
Stop: Below the 15m trigger wick −0.5.
• Targets: TP1 6,818–6,825, TP2 6,856–6,862, TP3 6,895–6,905.
Management: No partials before TP1. At TP1 take ~70%, set runner to BE, no trail until TP2. Time-stop 45–60m if flat.
Pop-and-Fail SHORT at 6,788–6,800 (Tier-1, full size)
Trigger: Wick above 6,800 that can’t stick → 15m close back under 6,788, 5m confirms down → 1m lower high to enter.
Entry: 6,786–6,792.
Stop: Above the rejection wick +0.5.
• Targets: TP1 6,778, TP2 6,771.5–6,760.5, TP3 6,754 → 6,742.
Note: If TP1 prints in <10m, take ~50%, consider re-adding on a 5m LH.
Quick-Reclaim Bounce LONG at 6,758–6,754 (Tier-2, ¾ size)
Trigger: Flush into 6,758–6,754 that snaps back → 15m close back over 6,760, 5m holds → 1m HL entry.
Entry: 6,758–6,762.
Stop: 6,749–6,752 (below the sweep low −0.5).
• Targets: TP1 6,778, TP2 6,788, TP3 6,800.
Continuation SHORT under 6,754 (Tier-1, full size)
Trigger: 15m body under 6,754 plus a failed check-back into 6,754 on 5m.
Entry: 6,751–6,754 on the failed retest.
Stop: 6,762.
• Targets: TP1 6,736–6,728, TP2 6,720–6,700, TP3 6,685–6,680.
Price Action Road Map for NY Trading Session
Opening Analysis:
- We'll begin by monitoring if the price can hold above the 6,788 level. If it does, look for a push toward 6,800. If the price gets rejected at this level, we will shift our strategy to Scenario B.
Bearish Scenario:
- If the price slips below 6,760, anticipate a potential stop run targeting the 6,758 to 6,754 range.
Response Strategies
- If we observe a quick snap back from this region, be prepared to target the VWAP area, along with revisiting the 6,788 and 6,800 levels.
- Should we fail to reclaim these higher levels, prepare for a move down towards the 6,720s and potentially the 6,680s.
Afternoon Strategy:
- In the afternoon session, if we establish a clear comfort zone during the morning, consider fading the extremes until we see a definitive 15-minute body break from this zone.
Stay focused on these levels and remain adaptable to the market's behavior throughout the session. Good luck!

AUDCAD: DTL BreakoutDaily Timeframe:
Bullish bar on market open indicates strength
Bullish bar also covering dojis on two previous days
H1 Timeframe:
Price crosses above DTL as first indication of momentum
Price is above crossing above EMA20
EMA20 is also expanding away from EMA60
Price crossing back above EMA60 indicates bearish sentiment is unlikely to hold

#XAUUSD AnalysisHello friends
#NEW forecast on GOLD
The price continues to support level and retesting the upward trend line .
Price action is moving towards the resistance area around 3950.
By regards, Honeytrading

Wall Street Weekly Outlook - Week 41 2025Every week I release a Wall Street Weekly Outlook that highlights the key themes, market drivers, and risks that professional traders are watching.
This week promises to be particularly important, with important fundamental developments... 📊 Stay ahead of the curve—watch the video now and get prepared like a Wall Street insider.
Any questions? Drop a comment or reach out directly.
-Meikel

XAUUSD Long: Path to 3975 After CorrectionHello, traders! The price auction for XAUUSD has been in a powerful and sustained bullish phase, with the market structure being clearly defined by a major ascending trend line. This uptrend has demonstrated significant strength, breaking through multiple key resistance levels such as the 3630 demand 2 and the 3820 demand 1 levels, confirming that buyers are in full control of the market.
Currently, after reaching a new high, the price has entered a corrective phase. This pullback is guiding the auction down towards the major ascending trend line that has been the backbone of this entire upward move. This area represents a critical test of the trend's integrity and a key zone for buyers to show their initiative.
My scenario for the development of events is a continuation of the primary uptrend. I believe that this correction is a healthy pullback and an opportunity for buyers to re-enter at a value area. In my opinion, the price will find strong support on the ascending trend line, leading to a reversal and the start of the next impulsive wave higher. The take-profit is therefore set at 3975. Manage your risk.

GBP/AUD – Triangle Breakout (03.10.2025)📊 Setup:
GBP/AUD has broken down from a Triangle Pattern on the 30M chart. Price rejected the resistance zone and confirmed bearish momentum by closing below the trendline support. The breakout signals potential continuation towards lower support levels.
📉 Trade Plan:
Bias: Bearish as long as price remains below the resistance zone and triangle breakout level.
1st Support Target: 2.0273
2nd Support Target: 2.0225
✅ Support Factors:
Triangle breakout pattern
Rejection from resistance zone
1.Ichimoku alignment showing bearish momentum
2.Volume profile showing weakness above current level
#GBPAUD #Forex #Trading #TechnicalAnalysis #PriceAction #TriangleBreakout #ForexSignals #FXTrading #BearishSetup #TradingView
⚠️ Disclaimer:
This analysis is for educational purposes only and not financial advice. Always use proper risk management and do your own research before entering trades.
💬 Support the Analysis:
If you find this useful, Like 👍, Comment 💬, and Follow ✅ for more trade setups & updates.

EURUSD Long: Awaiting Bullish Breakout from PennantHello, traders! The price auction for EURUSD has been in a corrective phase, which has taken the form of a large downward pennant. This bullish reversal pattern has been defined by a series of complex lower highs and lower lows, with the price consolidating between the descending supply line and the demand line near the 1.1715 demand level.
Currently, the auction is at a critical inflection point, trading at the apex of this pennant where the supply and demand lines converge. The price has found support near the 1.1715 demand zone, and after a complex series of moves, is now challenging the immediate overhead resistance. This compression of volatility indicates a significant breakout is imminent.
My scenario for the development of events is a bullish resolution of this downward pennant. I expect the price to make an impulsive move and break out above the descending supply line. In my opinion, this breakout will have enough momentum to carry the price up to the major horizontal supply zone. The take-profit is therefore set at the 1.1815 supply level. Manage your risk!

EURUSD Short: Continuation Within the Downward WedgeHello, traders! The prior market structure for EURUSD was a bullish ascending channel, which failed and led to a breakdown. This reversal has established the current bearish market phase, which has taken the form of a downward wedge. This pattern has been guiding the price auction lower through a series of lower highs and lower lows, confirming that seller initiative is dominant.
Currently, the price action is consolidating within this wedge. Following a minor bounce, the market is showing signs of weakness and appears ready to continue the established downtrend, respecting the wedge's boundaries.
My scenario for the development of events is a direct continuation of the decline within this wedge. I expect the price to complete another leg down from the current levels. The take-profit is therefore set directly at the 1.1615 level, targeting the demand zone which aligns with the lower support line of the pattern. Manage your risk!

Gold can Start a Corrective Move After a Strong RallyHello traders, I want share with you my opinion about Gold. The broader market context for Gold has been decidedly bullish since the price reversed and broke out from a prior descending channel. This structural shift established a new uptrend, which has since been neatly contained within a well-defined ascending channel, guiding the price action of XAU higher through a series of higher highs and higher lows. After breaking two key levels, the price has completed another full rotation and is now at a critical inflection point. Currently, the asset is trading very close to the resistance line of this ascending channel. My strategy is based on the expectation that the price will reach this line and then be rejected, initiating a corrective decline. I think that after such a strong run, a pull-back is a probable scenario. A confirmed reversal from this upper boundary would validate the short idea. Therefore, I have placed my TP at 3715 points. As noted, this is an intermediate target not located at a major support zone, designed to capture the initial phase of the anticipated downward correction. Please share this idea with your friends and click Boost 🚀
Disclaimer: As part of ThinkMarkets’ Influencer Program, I am sponsored to share and publish their charts in my analysis.
Euro will potentially Fall to 1.1680 After a Fake RallyHello traders, I want share with you my opinion about Euro. The market dynamic for the Euro has shifted from bullish to corrective after the price broke down from a prior upward channel. This structural change has led to the formation of a large downward pennant, a consolidation pattern that has been guiding the price of EURUSD lower. The market is currently trading near the resistance line of this pennant, with volatility compressing as it approaches the apex, signaling that a significant move is imminent. In my mind, an immediate breakout from this pennant could be a deceptive move designed to trap buyers. I expect that the price may initially break out to the upside and rally towards the major 1.1800-1.1780 seller zone. I think this rally will fail upon testing this significant area of historical resistance, creating a 'bull trap'. A confirmed and strong rejection from this seller zone would validate the overarching bearish scenario and likely trigger a sharp reversal to the downside. Therefore, I have placed my TP at the 1.1680 level, representing a logical objective for the decline that would follow such a failed breakout. Please share this idea with your friends and click Boost 🚀
Disclaimer: As part of ThinkMarkets’ Influencer Program, I am sponsored to share and publish their charts in my analysis.

Bitcoin may be Rejected from Channel ResistanceHello traders, I want share with you my opinion about Bitcoin. The established market structure for Bitcoin remains bullish, with the price action being methodically guided higher within a well-defined upward channel. This pattern has been in effect since the resolution of a prior consolidation, creating a clear sequence of higher highs and higher lows. The price of BTC has just completed another full upward rotation within this structure and is now positioned at a critical inflection point. Currently, the asset is directly testing the upper boundary of the upward channel 2, a level which forms a powerful confluence of resistance with the horizontal 117500 - 118200 seller zone. In my mind, the resistance of this channel is likely to hold, initiating a corrective phase. I expect a rejection from this area, leading to a downward move that will break the current support level at 115600. I think this decline will continue towards the channel's main support line. Therefore, I have placed my TP at 113250, which aligns with this dynamic support line. Please share this idea with your friends and click Boost 🚀
Disclaimer: As part of ThinkMarkets’ Influencer Program, I am sponsored to share and publish their charts in my analysis.

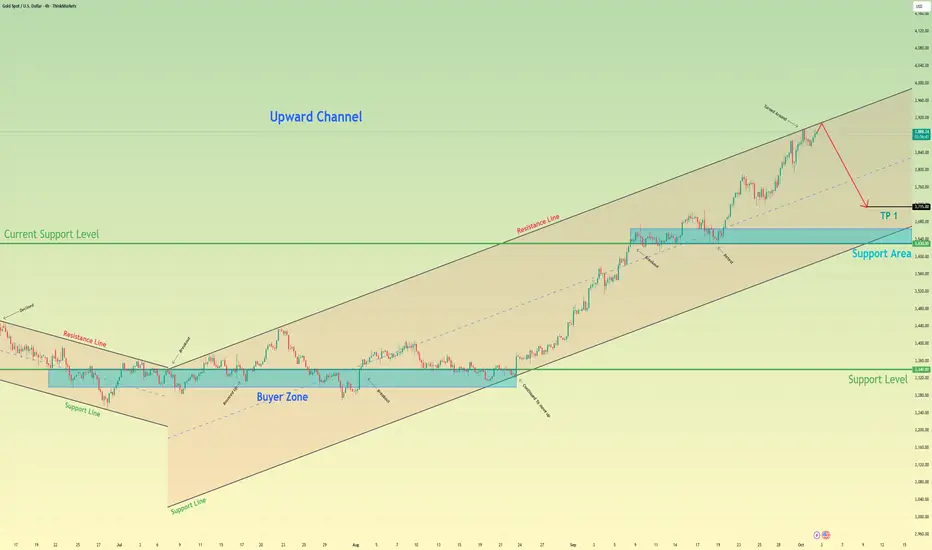
XAUUSD: Rally will Continue inside Upward ChannelHello everyone, here is my breakdown of the current Gold setup.
Market Analysis
From a broader perspective, the market for Gold has been in a complex but strong uptrend. We've seen the price break out of an initial consolidation and push through multiple support levels, like the one at 3700, establishing a clear bullish market structure defined by an Upward Channel.
Currently, after a strong rally, the price has entered a corrective phase. This pullback is guiding the price down towards the major ascending trend line, which has acted as the backbone for this entire upward move. This is a critical area to watch for a potential reaction.
My Scenario & Strategy
My scenario is built on the idea that this correction is a healthy pullback within a larger uptrend. The major ascending trend line is a significant structural level, and I expect it to act as strong dynamic support, providing a logical place for buyers to re-enter the market.
Therefore, the strategy is to watch for this bounce. A successful defense of the trend line would validate the long scenario. The primary target for the next impulsive wave higher is 3945, which aligns with the resistance line of the upward channel.
That's the setup I'm tracking. Thank you for your attention, and always manage your risk.

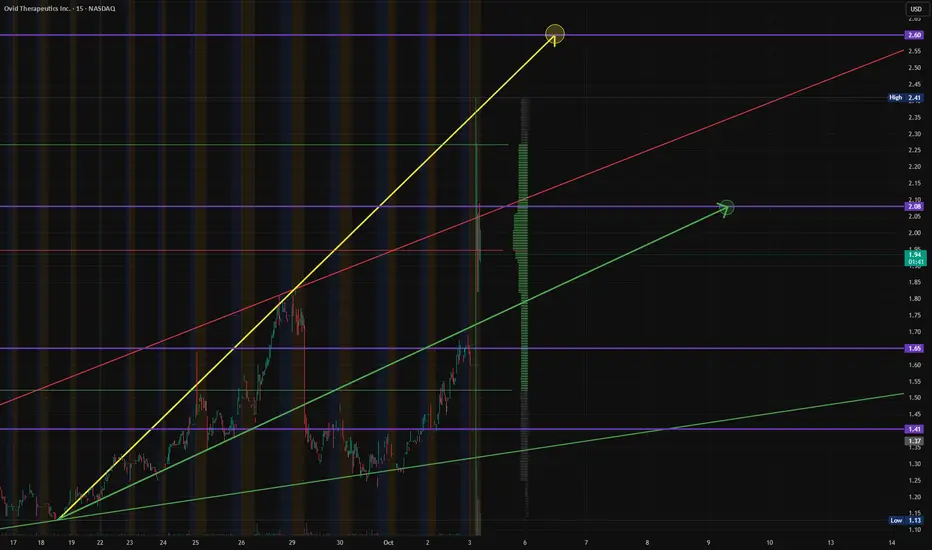
$OVID - OVID Therapeutics - $2.08 Retest & Breakout - $2.60PTNASDAQ:OVID broke out in the Pre-Market, hitting $2.41, breaking through the $2.08 Levels of Resistance. We were looking for support above that $2.08 but see consolidation to that Lower Suport Trend, which we expect a continuation through the $2.08 to our $2.60 PT and Retest Expectations.
This comes after OVID reported Positive Topline Data on it's OV329 for Drug Resistant Epliepsies.
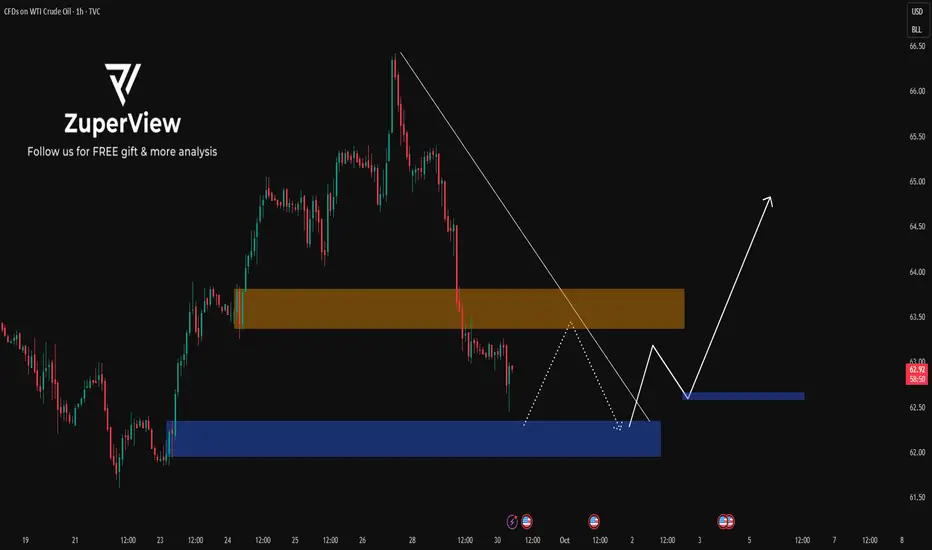
USOIL: Waiting for breakout after sidewaysTo better understand my current outlook on USOIL, please refer to my previous higher-timeframe and fundamental analyses.
* Trend: assessed using at least three trend indicators, with market structure as the primary guide.
** Weak or Reversal Signals: Assessed based on one of our criteria for trend reversal signals.
*** Support/Resistance: Selected from multiple factors – static (Swing High, Swing Low, etc.), dynamic (EMA, MA, etc.), psychological (Fibonacci, RSI, etc.) – and determined based on the trader’s discretion.
**** Our advice takes into account all factors, including both fundamental and technical analysis. It is not intended as a profit target. We hope it can serve as a reference to help you trade more effectively. This advice is for informational purposes only and we assume no responsibility for any trading results based on it.
Please like and comment below to support our traders. Your reactions will motivate us to do more analysis in the future 🙏✨