USD/JPY(20260114)Today's AnalysisMarket News:
The U.S. Labor Department reported on Tuesday that the U.S. CPI rose 2.7% year-on-year in December, unchanged from November. Excluding volatile food and energy costs, the core CPI rose 2.6% year-on-year, also unchanged from November. Both figures were below market expectations.
On Tuesday, traders increased their bets that the Federal Reserve might not wait until Fed Chairman Powell's term ends in May to cut interest rates. While traders still believe a June rate cut is the most likely outcome, the latest data projects a 42% probability of a Fed rate cut in April, up from 38% before the data release.
Technical Analysis:
Today's Buy/Sell Threshold:
158.72
Support and Resistance Levels:
160.01
159.53
159.22
158.23
157.91
157.43
Trading Strategy:
If the price breaks above 159.22, consider buying with a first target price of 159.53.
If the price breaks below 158.72, consider selling with a first target price of 158.23.
Analysis

Symmetrical Triangle Signals an Imminent ExpansionGold is currently trading in a high-compression environment on the H1 timeframe after a strong impulsive rally that printed a fresh all-time high (ATH). Following this aggressive bullish expansion, price has transitioned into a symmetrical triangle consolidation, reflecting a temporary balance between buyers and sellers rather than a structural reversal.
The triangle is forming above the rising EMA, which is a key bullish characteristic. This indicates that the broader trend remains intact and that the current consolidation is likely a pause for continuation, not distribution. Higher lows are being respected, while lower highs reflect profit-taking and short-term supply entering the market near the ATH.
From a price action perspective, the triangle is developing after an impulsive leg higher — a classic continuation setup. Each rejection from the upper trendline has been met with shallower pullbacks, suggesting sellers are losing strength while buyers continue to absorb supply near the apex. This behavior typically precedes a volatility expansion.
The bullish scenario favors a clean breakout and acceptance above the descending trendline, which would confirm continuation toward the next upside objective near 4,648 and potentially beyond, as breakout traders and trapped shorts add momentum. Given the ATH context, upside liquidity remains largely untapped, increasing the probability of an expansion move once price escapes compression.
Alternatively, a temporary downside sweep toward the lower triangle boundary or EMA could still occur as a liquidity grab, but as long as price holds above the rising EMA and the structure remains intact, such a move would be considered corrective rather than bearish.
In summary, Gold is coiling tightly beneath ATH in a symmetrical triangle continuation pattern. The broader bias remains bullish, and the market is approaching a decisive moment where compression is likely to resolve into a strong directional move with upside continuation currently holding the technical advantage.

EURUSD Is Trapped Below Resistance — Accumulation 1. Market Structure
EURUSD remains in a clear bearish structure on the H1 timeframe. Price continues to form lower highs and lower lows, with the EMA 89 acting as dynamic resistance, confirming sellers are still in control.
The recent bullish impulse is corrective, not impulsive — there is no structural break to suggest a trend reversal.
2. Key Technical Zones
Resistance Zone: 1.1695 – 1.1700
→ Previous support turned resistance, aligned with EMA
Accumulation Zone: 1.1670 – 1.1685
→ Price is currently compressing here
Demand Zone: 1.1615 – 1.1620
→ Next high-probability downside liquidity target
3. Price Action Insight
Price is currently accumulating below resistance, showing signs of distribution rather than strength. Repeated failures to hold above the EMA signal that buyers are getting absorbed, while smart money prepares for continuation lower.
This type of tight consolidation below resistance often precedes a bearish expansion.
4. Trading Scenarios
🔴 Primary Scenario – Bearish Continuation (High Probability)
- Rejection from 1.1685–1.1700
- Breakdown below accumulation range
- Targeting the demand zone at 1.1618
🟢 Invalidation Scenario
- Only a strong H1 close above 1.1700
- Followed by acceptance above EMA
- Would shift bias to short-term bullish correction
🔹 Summary
As long as EURUSD trades below the EMA and below 1.1700, the bearish bias remains dominant. The current structure favors patience for short setups, not chasing longs.
📌 Market favors sellers — wait for rejection, then continuation.

Demand Zone Holds — Is ETH Preparing for a Trend Reversal?ETHUSD is currently transitioning out of a clear bearish phase into a potential basing structure. After an impulsive sell-off and extended trading below the descending EMA, price has now stabilized and pulled back into a well-defined demand zone, suggesting selling pressure is weakening. The recent price action shows loss of downside momentum, with shorter bearish legs and increased reaction buying from the lows a classic early signal of accumulation rather than continuation.
EMA & Momentum Context
Price is hovering around the EMA (dynamic resistance turned neutral). While ETH is not yet in a confirmed bullish trend, the EMA has started to flatten, which often precedes either:
- a range expansion to the upside, or
- a final liquidity sweep before reversal
Importantly, bears have failed to push price significantly lower despite multiple attempts — signaling absorption at demand.
Key Zones & Levels
- Demand Zone: 3,080 – 3,120
This is the critical area holding structure. As long as price remains above this zone, downside is considered corrective.
- Resistance / Upside Targets:
3,160 (first reaction level)
3,220 (range high / structure test)
3,275 (major resistance & liquidity target)
Scenario Outlook
➡️ Primary Scenario (Bullish Continuation):
Sustained support above the demand zone opens the path for a higher low formation, followed by a push toward 3,160 → 3,220. Acceptance above 3,220 would strongly confirm a trend reversal, targeting the 3,275 zone next.
⚠️ Risk Scenario (Range Failure):
A clean breakdown and acceptance below the demand zone would invalidate the bullish setup and expose ETH to renewed downside pressure. Until that happens, sellers are at a disadvantage.
Conclusion
ETH is no longer trending aggressively lower. Instead, the market is showing early-stage accumulation behavior, where patience favors waiting for confirmation rather than chasing moves. As long as demand holds, risk-reward continues to favor upside expansion.

EURUSD at a Structural Turning Point — Reversal Confirmation On the H1 timeframe, EURUSD is showing early signs of a potential trend transition, but the market is still positioned at a highly sensitive decision zone where confirmation is critical. The broader context remains bearish, as price has respected a well-defined descending structure and stayed below the dynamic resistance represented by the moving average. The recent sharp bullish candle from the 1.1618 support zone indicates a liquidity sweep and aggressive short covering, suggesting that sellers may be temporarily exhausted. This impulsive move breaks the immediate bearish momentum and introduces the possibility of a short-term bullish cycle starting to form. However, from a structural perspective, this alone is not enough to confirm a full reversal. Price is currently reacting around the 1.1670–1.1695 resistance zone, which aligns with prior breakdown structure and acts as a key supply area. This level will determine whether the move is a genuine change of character or simply a corrective retracement within the larger downtrend. If EURUSD can achieve clean acceptance above the 1.1695 level, followed by a higher low, the market would officially transition into an early bullish cycle. In that scenario, upside expansion toward the 1.1720 and 1.1750 liquidity targets becomes highly probable as buyers take control. Conversely, failure to hold above current levels would strongly suggest a bearish continuation scenario. A rejection from resistance would likely send price back toward the 1.1618 support, where liquidity rests. A breakdown below that level would invalidate the reversal attempt and confirm continuation of the bearish cycle.
In summary, EURUSD is currently sitting at a cycle inflection point. Bulls have made their first statement, but the market still requires structural confirmation. Until price proves acceptance above resistance, this move should be treated as a corrective phase rather than a confirmed trend reversal.

Market Analysis & Today's TrendCurrent Market Analysis & Today's Trend
- Currently, the gold market is entering a distribution phase after a strong upward move (Markup) originating from the previous accumulation zone. Prices are fluctuating within a narrow upper range, indicating weakening buying pressure and the emergence of profit-taking pressure.
TODAY'S LIMITED STRATEGY JAN 13
Intraday trading: Adjust
📌 SET UP 1. Timming Sell Zone
XAUUSD SELL ZONE: 4629 - 4632
💰 Take Profit(TP): 4626 - 4621
❎ Stoploss(SL): 4636
Note capital management to ensure account safety
📌 SET UP 2. Timming Buy Zone
XAUUSD BUY ZONE: 4559 - 4562
💰 Take Profit(TP): 4565 - 4570
❎ Stoploss(SL): 4555
Note capital management to ensure account safety
🔎 Market Structure:
- The upper zone is forming a sideways distribution pattern; prices are no longer creating clear new highs.
- Upward momentum is gradually decreasing, with weaker upward rallies → a sign of dwindling buying power.
- Prices are far from the lower liquidity zone, raising the risk of a correction to balance supply and demand.
📉 Preferred Scenario for Today:
- If the market fails to break through the upper distribution zone, it is likely to reverse and correct (Mark Down) to:
- Nearest support zone / liquidity zone
- Major MA area – where money flow previously accumulated
- Only with a clear break and a strong closing candle above the distribution zone will the uptrend continue.
🎯 Trading Strategy:
- Avoid FOMO buying at high levels.
- Prioritize observing price reactions at the distribution zone:
- Weakness signal → look for short-term sell opportunities during corrections.
- Strong break, volume & confirmation candle → follow the trend, manage risk carefully.
👉 The current market offers many opportunities, but it is only suitable for those who are patient and disciplined. At this stage, reading the structure is more important than finding entry points.

EURUSD at a Cycle Decision Point — Accumulation Break or BounceOn the H1 timeframe, EURUSD is currently sitting at a critical transition point within the market cycle, where price must choose between continuing a new bullish phase or reverting back into bearish continuation.
From a cycle theory perspective, the market previously completed a markdown phase, visible through the sustained series of lower highs and lower lows. Selling pressure dominated, and price consistently accepted lower value until it reached the 1.1620–1.1650 area, where downside momentum began to noticeably weaken.
This zone marks the end of the markdown phase and the beginning of accumulation behavior. Price stopped trending impulsively and instead formed a compressed structure with smaller candles and reduced volatility, indicating that sellers were losing control and liquidity was being absorbed by stronger hands.
The recent sharp bullish impulse from the lows represents a preliminary sign of markup initiation. This move is important from a cycle standpoint, as it often acts as a “change of character,” signaling that the market may be transitioning from accumulation into early expansion. However, cycle theory also reminds us that not every impulse automatically confirms a full trend reversal.
At this stage, EURUSD is reacting around a mid-range decision zone, where two scenarios are valid: If price can hold above the impulse origin and continue forming higher lows, the cycle will shift into a confirmed markup phase, targeting the upper liquidity levels near 1.1710 and potentially extending toward the 1.1740–1.1750 region. This would confirm that accumulation is complete and demand has taken control. On the other hand, failure to maintain acceptance above the current structure would indicate that this move was merely a corrective rally within a larger bearish cycle. In that case, price is likely to rotate back down toward the lower liquidity pool around 1.1620, completing a secondary test of demand before any sustainable bullish cycle can begin.
In summary, EURUSD is no longer purely bearish, but it is not yet fully bullish either. According to cycle theory, the market is transitioning from accumulation toward markup, but confirmation depends on structure holding. Until a clear continuation is established, this remains a high-impact decision zone where patience and confirmation are critical.

Bullish Continuation Still on the Table After the PullbackBitcoin on the H1 timeframe is currently trading within a broader bullish context, despite the recent sharp pullback from the local highs. The overall structure suggests that price is undergoing a corrective phase rather than signaling a full trend reversal. After a strong impulsive rally toward the upper resistance band, BTC faced profit-taking and short-term selling pressure, which pushed price back toward a clearly defined support zone.
This support area, located around the 90,000–90,200 region, represents a key liquidity pocket where buyers previously stepped in. The reaction from this zone is critical, as it acts as the decision point between continuation and deeper correction. So far, price has respected this support, indicating that sell-side momentum is weakening and that the market may be absorbing supply rather than accelerating lower.
The rejection from higher resistance levels aligns with a healthy market rotation, allowing Bitcoin to reset momentum before the next directional move. As long as price continues to hold above the support zone and does not establish acceptance below it, the bullish continuation scenario remains valid. In this case, the market is likely to rotate higher again, with successive upside targets lining up around 91,500, 92,200, and ultimately the upper resistance near 93,700.
From a structure and liquidity perspective, the recent dip can be interpreted as a pullback to demand, offering stronger hands an opportunity to accumulate before the next expansion phase. A clean bullish reaction from support would confirm this outlook and open the path toward the marked upside targets.
However, a decisive breakdown and sustained trading below the support zone would invalidate the bullish continuation scenario and expose Bitcoin to a deeper retracement. Until that occurs, the technical bias remains cautiously bullish, with the market favoring higher prices after this corrective reset.

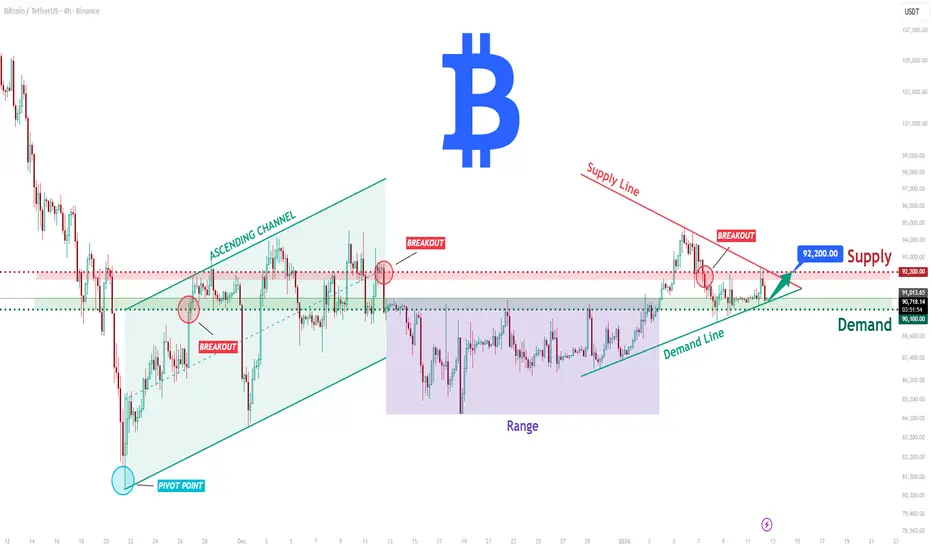
BTCUSDT Long: Demand Holding at 90,100 - Eyes on 92,200 SupplyHello traders! Here’s a clear technical breakdown of BTCUSDT (4H) based on the current chart structure. After a strong bearish move, BTC formed a clear pivot low, from which price transitioned into a bullish recovery phase. From this pivot point, the market developed a well-defined ascending channel, confirming a shift in market structure and increasing buyer control through a sequence of higher highs and higher lows. This channel guided price higher until BTC reached a key Supply Zone around 92,000–92,200, where selling pressure emerged. At this supply area, price experienced a rejection and breakout failure, indicating that sellers are actively defending this level. Following the rejection, BTC briefly broke below short-term structure and moved into a consolidation range, reflecting temporary balance between buyers and sellers. More recently, price has started to recover again, respecting a rising Demand Line, which signals that buyers are still defending the broader bullish structure.
Currently, BTC is trading between a key Demand Zone near 90,100–90,300 and the overhead Supply Zone around 92,200. This area represents a critical decision zone for the market, where the next directional move is likely to be defined.
My scenario: as long as BTCUSDT holds above the Demand Zone and continues to respect the rising demand trend line, the bullish bias remains valid. I expect buyers to attempt another push toward the 92,200 Supply Zone. A clean breakout and acceptance above this level would confirm bullish continuation and open the door for further upside. However, a strong rejection from supply followed by a breakdown below demand would weaken the structure and increase the probability of a deeper corrective move. For now, price remains in a compression phase between demand and supply — patience and proper risk management are key. Manage your risk!
IREN financial report and investment ideaExecutive summary (≤200 words)
IREN (NASDAQ: IREN) trades near $50.33 (market cap $16.53B). Recent metrics show strong profitability (ttm net income $523.3M; diluted EPS ttm $1.74) and large operating cash generation (OCF ttm $392.2M) but negative levered FCF (ttm −$957.1M) driven by heavy capex. Enterprise value $16.46B implies EV/Revenue 23.9x and EV/EBITDA 16.93x. Using updated inputs (shares 328.34M, net cash ≈ $64M, revenue ttm $688.6M, EBITDA ttm $232.1M), I run a 5‑year DCF and multiples checks. Conservative DCF (WACC 9.0%, terminal g 2.5%) yields fair value below market; comparable EV/EBITDA expansion scenarios can justify materially higher market prices if growth/margins exceed conservative assumptions.
Key catalysts: Sweetwater commissioning cadence, Microsoft contract billing milestones, NVIDIA delivery timing. Key risks: execution on buildouts, high GPU & DC CapEx, high short interest (15.8% of float) amplifying volatility.
Key inputs
Price (close Jan 12, 2026): $50.33; pre‑market $50.93
Market cap: $16.53B; EV: $16.46B
Shares outstanding: 328.34M; float: 257.98M
Revenue (ttm): $688.55M; Gross profit (ttm): $480.75M
EBITDA (ttm): $232.12M; Net income (ttm): $523.26M; EPS (ttm): $1.74
OCF (ttm): $392.15M; Levered FCF (ttm): −$957.13M
Total cash (mrq): $1.03B; Total debt (mrq): $965.63M → Net cash ≈ $64M
Valuation ratios: P/E (trailing) 28.93; EV/Revenue 23.90; EV/EBITDA 16.93; P/S 19.47
Short interest: 50.01M (15.78% of float); Beta 4.27
Modeling approach and adjustments
Use revenue ttm $688.6M as new base (FY‑end 6/30). Translate ttm figures to FY2026 starting point and derive starting unlevered FCF from OCF and known capex patterns. Incorporate known GPU CapEx (if confirmed) as incremental investing outflow; otherwise treat as contingent and show sensitivity. Use shares 328.34M and net cash ~$64M to move from EV → equity value. Present DCF (5‑yr explicit) plus sensitivity table (WACC ±1%, terminal g ±0.5%). Provide multiples valuation using implied EV/EBITDA and peer ranges.
Assumptions applied (explicit)
Base unlevered FCF (Year 0 / FY2026 base): derive from OCF ttm $392.2M; subtract normalized CapEx. Given levered FCF ttm −$957.1M, I treat FY2026 base unlevered FCF ≈ $200M after heavy one‑off GPU/DC spend adjustments (conservative).
Growth profile (5‑yr): FY2027 +40%, FY2028 +30%, FY2029 +20%, FY2030 +12% (decelerating to terminal). These reflect aggressive commercialization of contracted capacity but remain conservative vs market optimism; alternative high‑growth scenario shown below.
EBITDA margin expansion to 25% by FY2028 (from current ttm ~33.7% implied by EBITDA/Revenue but recognizing gross/net distortions — model uses progressive margin improvement).
WACC base: 9.0%; terminal growth g: 2.5%.
Updated DCF (concise results)
Projected unlevered FCF (illustrative)
FY2026 (base): $200M
FY2027: $280M (+40%)
FY2028: $364M (+30%)
FY2029: $437M (+20%)
FY2030: $489M (+12%)
Terminal value = FCF2030(1+g)/(WACC−g) = 489*(1.025)/(0.09−0.025) ≈ $7.68B
Discounted PV of explicit FCFs (WACC 9%): approx $200/1.09 + 280/1.09^2 + 364/1.09^3 + 437/1.09^4 + 489/1.09^5 ≈ $183 + $236 + $272 + $298 + $318 = $1,307M
PV(Terminal) ≈ 7.68B / 1.09^5 ≈ $4,991M
Enterprise value (EV) ≈ $1,307M + $4,991M = $6,298M
Adjust for net cash (~$64M): Equity value ≈ EV + net cash = $6,298M + $64M = $6,362M
Per‑share fair value = $6,362M / 328.34M ≈ $19.38 per share (conservative baseline)
Sensitivity (concise)
Base: $19.4 (WACC 9%, g 2.5%)
WACC 8% / g 2.5% → fair ≈ $28–30
WACC 10% / g 2.5% → fair ≈ $13–15
Terminal g +0.5% → ~ +10–15% on base value; terminal g −0.5% → ~ −8–10%
Multiples check
Current implied EV/EBITDA = 16.93x (from dataset). Apply this to projected FY2026–FY2028 EBITDA scenarios:
If FY2026 EBITDA (conservative) = Revenue2026 (estimate) * margin. Using revenue base $688.6M and projected growth +40% → Revenue2027 ≈ $964M; but to compare simply: use FY2026 prox EBITDA ≈ $232M (ttm) as baseline.
EV = 232M * 16.93 ≈ $3.93B → Equity = EV + net cash ≈ $3.99B → per share ≈ $12.15 (low)
If market prices IREN with premium growth (apply EV/EBITDA 30x): 232M * 30 = $6.96B → Equity ≈ $7.02B → per share ≈ $21.4
If forward EBITDA (post‑ramp) = $1.2B (aggressive, used in earlier illustrative peer exercise), EV = 1.2B * 18 = $21.6B → Equity ≈ $21.66B → per share ≈ $66.0 (aligns with market upside scenarios).
Interpretation & key takeaways (short)
Conservative DCF produces a fair value materially below current market price (~$19.4 vs market $50.33) — driven by heavy near‑term capex and conservative FCF ramp assumptions.
Multiples/comps can justify significantly higher valuations only if EBITDA scales rapidly (>$1B) and market assigns premium growth multiple (20–30x+ EV/EBITDA).
Net cash position (~$64M) improves liquidity relative to prior assumed net debt, lowering immediate solvency risk — but levered FCF is deeply negative (ttm −$957M), indicating ongoing heavy financing needs unless capex pauses or cash receipts accelerate.
High short interest (15.8% of float) and elevated beta indicate potential for amplified price moves around execution milestones (Sweetwater commissioning, Microsoft billing, NVIDIA deliveries).
Risks & catalysts (bullet)
Catalysts: Sweetwater tranche commission dates and realized billing from Microsoft; NVIDIA B200/B300 delivery & deployment; sequential quarters with positive FCF conversion.
Risks: execution delays, higher than expected CapEx, weaker realized margins, requirement to raise equity (shelf $660M) or debt at unfavorable terms, customer concentration, regulatory/permits delays.
Deliverables attached if you want more detail (I will produce on request)
Full DCF table (year‑by‑year FCF, discount factors, PVs) and sensitivity grid (WACC vs terminal g).
Multiples table: EV/Revenue and EV/EBITDA scenarios with implied per‑share values (low / base / high cases).
Short‑interest & liquidity dashboard and a concise two‑paragraph investment recommendation (Buy/Hold/Sell with rationale and hedges).

EMA Reaction Sparks a Bounce — Correction or the Start of TrendEURUSD is still operating inside a broader bearish structure, with the dominant trend defined by a clear sequence of lower highs and lower lows. However, the most recent price action shows a counter-trend corrective bounce emerging from oversold conditions rather than a confirmed trend reversal. The strong bullish candle from the recent low signals short-term short covering and reaction buying, but this move should be treated as corrective within a downtrend until proven otherwise.
EMA Reaction & Technical Confluence
Price has just reacted precisely from the EMA zone, which has acted as dynamic resistance throughout the downtrend. The current push above the EMA reflects momentum relief rather than structural change.
Importantly:
- The EMA is still sloping downward
- Price remains below major prior supply
- No higher high has been formed yet
This setup often leads to a pullback–continuation sequence, where price retests higher resistance levels before sellers reassert control unless strong acceptance occurs above key levels.
Key Levels
Resistance:
1.1698 – 1.1713 (prior supply / corrective target)
1.1750 – 1.1760 (major structure resistance / trend invalidation)
Support:
1.1650 – 1.1660 (EMA reaction zone)
1.1620 (recent swing low / bearish continuation trigger)
EMA / Dynamic Level:
EMA acting as short-term balance, still bearish in slope
Scenarios
➡️ Primary Scenario (Corrective Bounce):
Price continues the corrective move toward the 1.1698–1.1713 resistance zone. This area is expected to attract selling interest, where the market may form a lower high before resuming the broader downtrend.
⚠️ Risk Scenario (Trend Shift Attempt):
A strong breakout and acceptance above 1.1750 would weaken the bearish structure and signal a potential transition into a broader range or trend shift. Until that level is reclaimed, bullish moves remain corrective.

ETHUSD At a Critical Support Test — Accumulation or Breakdown?On the H1 timeframe, ETHUSD is currently trading at a key decision zone, where market structure, EMA positioning, and liquidity dynamics are all converging. From a broader perspective, the market previously completed a clear bearish cycle, with price trending below the EMA and producing lower highs and lower lows. This confirms that the dominant structure before the current phase was bearish, not impulsively bullish.
As price reached the lower area around 3,080–3,100, selling pressure began to weaken. The market transitioned into a sideways accumulation phase, marked by compressed candles and reduced downside follow-through. This zone now acts as a critical support and liquidity base, where buyers and sellers are actively battling for control.
Currently, price is trading below the EMA, which is an important technical detail. As long as ETH remains below this dynamic resistance, upside moves should be treated as corrective pullbacks, not confirmed trend reversals. The recent push up and rejection back into the support zone reinforces the idea that the EMA is still capping price.
Two primary scenarios are now in play:
In the bullish cycle continuation scenario, if price holds above the highlighted support zone and forms a higher low, this would signal successful absorption of sell-side liquidity. A reclaim and acceptance above the EMA would then shift the structure into early markup. In this case, the first upside target sits near 3,163, followed by a higher liquidity objective around 3,218, where previous supply and imbalance remain untested.
In the bearish continuation scenario, a clean break and close below the support zone would confirm that accumulation has failed. This would open the door for a renewed markdown phase, with price likely targeting the lower liquidity pool around 3,036–3,026, where unfilled demand and stops are resting.
In summary, ETHUSD is sitting at a cycle inflection point. The support zone is the line between accumulation and further distribution. Traders should remain patient and wait for confirmation — either a strong reclaim above the EMA for bullish continuation, or a decisive breakdown below support to confirm bearish expansion.

Bitcoin Rejected at EMA — Bearish Continuation Still in PlayPrice has failed to reclaim the EMA around 90,900, confirming the EMA as dynamic resistance within a broader downtrend. The sharp rejection from this level signals that buyers lack follow-through and sellers remain in control. As long as BTC stays below 90,900–91,000, downside pressure is favored, with a move toward 90,200 as the first reaction level. A clean breakdown below 90,200 would likely accelerate selling into the 88,500–88,400 target zone. Only a strong close back above the EMA would invalidate this bearish continuation setup.

Ethereum Enters a New Market Cycle — Accumulation CompleteOn the H1 timeframe, Ethereum is showing a classic market cycle transition, aligning well with Wyckoff / cycle theory rather than random price movement. The recent structure strongly suggests that ETH has already completed a full corrective cycle and is now rotating into a new bullish expansion phase.
From a cycle perspective, the market first experienced a distribution phase near the previous highs around the 3,280 region, where strong selling pressure entered and ended the prior uptrend. This was followed by a markdown phase, clearly visible in the sustained bearish leg where price traded below the fast and slow moving averages, confirming bearish control and momentum continuation to the downside.
As price approached the 3,050–3,080 area, selling pressure began to weaken. This zone marked the accumulation phase of the cycle. Price action shifted from impulsive bearish candles into a rounded, basing structure, forming a smooth curvature that reflects smart money absorption rather than panic selling. This rounded bottom is a textbook sign that supply is being absorbed and that the market is preparing for a trend transition.
The current price action shows Ethereum moving into the early markup phase. This is confirmed by higher lows, improving structure, and price reclaiming and holding above the faster moving average while compressing toward the slower one. The slope of price is now turning upward, indicating momentum rotation from bearish to bullish control.
From a cycle continuation standpoint, as long as ETH holds above the basing area and maintains acceptance above the moving averages, the bullish cycle remains intact. The projected path aligns with a healthy expansion structure: impulsive pushes higher followed by shallow pullbacks, targeting the previous liquidity high near 3,280 as the next major cycle objective.
In summary, Ethereum is no longer in a corrective or bearish phase. The cycle has reset, accumulation appears complete, and the market is transitioning into markup. Unless price aggressively re-enters the accumulation range, the dominant expectation remains higher highs as the bullish cycle unfolds.

The Wyckoff Trading MethodThe Wyckoff Trading Method
The Wyckoff Method is a classical approach to market analysis designed to help traders understand trend development, market cycles, and potential reversals. Despite being developed over a century ago, it remains highly relevant in modern financial markets and is widely used across stocks, forex, and cryptocurrencies.
What Is the Wyckoff Method?
The Wyckoff Method is a form of technical analysis created in the early 20th century by Richard D. Wyckoff, a pioneering trader and market analyst. The core idea behind this method is that price movements are governed by supply and demand, and that large institutional participants (often referred to as “composite operators”) leave identifiable footprints on the chart.
Wyckoff believed that by studying price, volume, and time, traders could anticipate future price behavior rather than react to it.
Core Principles of the Wyckoff Method
The Wyckoff methodology is built around several foundational concepts:
1. Supply and Demand
Price rises when demand exceeds supply and falls when supply exceeds demand. Observing how price responds to changes in volume helps traders identify who is in control of the market.
2. Market Structure and Phases
Markets move in recurring cycles, typically broken down into:
- Accumulation
- Markup
- Distribution
- Markdown
Recognizing these phases allows traders to align with institutional activity rather than trade against it.
3. Price and Volume Relationship
Volume acts as a confirmation tool. Strong price movement with weak volume often signals exhaustion, while strong volume supports trend continuation.
4. Liquidity and Institutional Behavior
The method emphasizes how large players accumulate or distribute positions over time, often through range-bound price action designed to absorb liquidity.
The Market Cycle
The Wyckoff Market Cycle
The Wyckoff methodology describes market behavior as a repeating four-phase cycle driven by supply and demand. These phases help traders understand where the market is in its process, rather than simply reacting to price movements.
Accumulation Phase
Accumulation typically appears as a range-bound market after a decline. During this phase, large institutional participants quietly build long positions while price remains relatively stable. To most traders, the market appears directionless, but in reality, buying is taking place without pushing price higher. The true intent of the market is concealed until accumulation is complete.
Markup Phase
Once sufficient long positions have been accumulated, institutions begin to drive price higher. This phase is characterized by a clear uptrend as increased demand attracts additional buyers. Breakouts from accumulation ranges often trigger momentum traders and breakout strategies, reinforcing the trend. Markups may include re-accumulation phases, where price pauses and consolidates before continuing higher.
Distribution Phase
Distribution occurs after an extended advance, when upward momentum begins to slow. During this phase, large players gradually offload long positions and build short exposure. Price often moves sideways in a range, giving the illusion of stability, while smart money exits positions. This phase prepares the market for the next directional move lower.
Markdown Phase
The markdown is the declining phase that follows distribution. Selling pressure overwhelms demand, leading to a sustained downtrend. As price falls, traders are encouraged to enter short positions, further accelerating the move. Similar to markups, markdowns may include redistribution phases, where price consolidates before continuing lower.
Why the Wyckoff Model Works
Large financial institutions must execute trades of significant size, which requires liquidity. Liquidity is often found around stop losses, breakout levels, equal highs and lows, and key support or resistance zones. By intentionally pushing price into these areas, institutions can fill large orders efficiently without excessive slippage. This interaction between liquidity and market psychology forms the foundation of the Wyckoff model across all asset classes.
Core Principles of the Wyckoff Method
A key concept in Wyckoff theory is the Composite Man, a symbolic representation of institutional or “smart money” participants. Traders are encouraged to analyze price action as if a single, highly informed entity is controlling the market. The Composite Man accumulates or distributes positions strategically before allowing price to trend.
The Law of Supply and Demand explains that price rises when demand exceeds supply and falls when supply exceeds demand. The Law of Cause and Effect states that the size and duration of accumulation or distribution determine the magnitude of the subsequent price move, with higher-timeframe structures producing larger effects. The Law of Effort versus Result compares volume (effort) with price movement (result), highlighting potential trend continuation or exhaustion when these two factors diverge.
Wyckoff Schematics
Wyckoff schematics visually represent accumulation and distribution structures. Although these patterns may appear complex at first, they are mirror images of each other, with accumulation and distribution sharing identical phases and logic—only inverted. Studying these schematics helps traders recognize institutional behavior and align their trades with the dominant market process.
Type 1 Schematics
Accumulations
Phase A: Stopping the Downtrend
Phase A marks the transition from a markdown to the beginning of accumulation, where selling pressure starts to weaken.
- Preliminary Support (PS): After a prolonged decline, initial buying emerges and temporarily halts the downtrend. Volume increases as early demand appears, signaling that selling pressure is no longer dominant.
- Selling Climax (SC): Panic selling accelerates as long positions are stopped out and breakout traders enter short positions. At this point, the Composite Man absorbs this excess supply. The SC often leaves long lower wicks, reflecting strong buying interest.
- Automatic Rally (AR): Once selling pressure is exhausted, price rebounds quickly as shorts cover and new buyers step in. The high of the AR establishes the first resistance boundary of the accumulation range.
- Secondary Test (ST): Price revisits the SC area to test remaining supply. This test may form equal or slightly higher/lower lows, usually with reduced volume, confirming that selling pressure has diminished.
Phase B: Building the Cause
Phase B is where accumulation develops over time. The Composite Man continues to build long positions while price fluctuates within a range.
- Sign of Strength in Phase B (SOS(b)): In some cases, price rallies above the AR, creating a higher high within the range. This move suggests improving demand but still remains below preliminary resistance.
- Secondary Test in Phase B (ST(b)): A sharp decline follows, designed to trigger stop losses below prior lows and attract breakout sellers. This “liquidation” move provides the liquidity institutions need to continue accumulating, forming the underlying cause for the next trend.
Phase C: The Final Shakeout
Phase C is the critical phase that distinguishes accumulation from continuation lower.
- Spring: Price makes a final push below established support, sweeping remaining stop losses and trapping late sellers. This move briefly violates the range before quickly reversing.
- Test: After the Spring, price retests the area to confirm that supply has been fully absorbed. These tests typically form higher lows and occur on lower volume, signaling reduced selling interest.
Phase D: Transition to Markup
Phase D confirms that accumulation is complete and the market is ready to trend higher.
- Last Point of Support (LPS): Following the test and a rally, price pulls back shallowly, forming a higher low. This pullback reflects strong demand and is often the final opportunity before markup.
- Sign of Strength (SOS): Price breaks above the accumulation range with expanding volume, confirming bullish control. After this breakout, the market enters the markup phase, where the effect of prior accumulation is realized through sustained upward movement.
Distributions
Phase A: Stopping the Uptrend
Phase A marks the transition from an uptrend into distribution, where demand begins to weaken and supply quietly enters the market.
- Preliminary Supply (PSY): After a sustained advance, large operators start unloading positions, causing the first noticeable pause or pullback in price.
- Buying Climax (BC): Buying pressure reaches an extreme as late buyers enter aggressively, often accompanied by very high volume. This is where smart money sells into strength.
- Automatic Rally (AR): Once buying is exhausted, price pulls back sharply as demand fades. The AR typically forms below the BC and defines the first support boundary of the distribution range.
- Secondary Test (ST): Price revisits the BC area to test remaining demand, usually failing to make a new high. Volume is generally lower, indicating reduced buying interest and building liquidity for later phases.
Phase B: Building the Distribution
Phase B is where the Composite Man continues distributing positions while price fluctuates within a range.
- Sign of Weakness in Phase B (SOW(b)): A decline below the AR signals that supply is beginning to dominate. This move does not always appear, but when it does, it establishes a second support boundary.
- Upthrust (UT): Price briefly breaks above resistance to trigger buy stops and attract breakout buyers. This false breakout allows institutions to sell into increased demand and build short exposure.
Phase C: The Final Liquidity Grab
Phase C completes the distribution process by targeting remaining demand.
- Upthrust After Distribution (UTAD): Similar to a Spring in accumulation, UTAD is the final false breakout above resistance. It is designed to capture the last wave of liquidity before the true bearish move begins.
- Test: Price often revisits the UTAD area to confirm that demand has been fully absorbed. These tests typically occur on lower volume, signaling weakening bullish participation.
Phase D: Transition to Markdown
Phase D confirms that distribution is complete and bearish control is established.
- Last Point of Supply (LPSY): After price begins to decline, weak rallies attempt to test demand. These rallies are shallow and usually represent the final bullish reactions before the markdown.
- Sign of Weakness (SOW): Price breaks decisively below the range, confirming a bearish structure. Additional LPSYs may form, but this phase marks the final transition into the markdown.
Type 2 Schematics
Type 2 Wyckoff schematics contain the same structural components as Type 1, but without a Spring (in accumulation) or a UTAD (in distribution). In these cases, the market does not perform a final liquidity sweep before trending.
A Type 2 schematic can be identified by observing a direct transition into trend confirmation:
- In accumulation, price forms a Secondary Test (ST) and possibly an ST(b), then proceeds directly into a Sign of Strength (SOS) followed by markup.
- In distribution, price forms an ST or Upthrust (UT), then transitions directly into a Sign of Weakness (SOW) followed by markdown.
If markup or markdown begins without a Spring or UTAD, the structure should be classified as Type 2. Importantly, Type 2 schematics are traded using the same principles and execution logic as Type 1 structures.
The Five-Step Wyckoff Trading Strategy
Richard D. Wyckoff proposed a structured five-step approach to applying his methodology in real market conditions. This framework helps traders align with market structure and institutional intent.
1. Determine the Market Trend
Identify whether the broader market environment is bullish or bearish. Trading in alignment with the dominant trend increases probability.
2. Select a Suitable Market
Choose an asset or trading pair that clearly reflects the identified market trend and shows strong structural clarity.
3. Identify Accumulation or Distribution
Focus on assets that are currently forming a Wyckoff accumulation or distribution structure rather than those already trending.
4. Assess Readiness for a Move
Analyze the current Wyckoff phase and volume behavior. Events such as a Spring, UTAD, SOS, or SOW help confirm whether the market is prepared for markup or markdown.
5. Execute the Entry
Entries are commonly taken on Tests, Last Points of Support (LPS), or Last Points of Supply (LPSY), where risk can be controlled and structure is clear.
Does the Wyckoff Method Still Work?
- Despite being developed nearly a century ago, the Wyckoff Method remains highly relevant in modern markets. Its core principles supply and demand, market structure, volume analysis, and liquidity behavior are universal and apply across forex, stocks, commodities, and cryptocurrencies.
- When combined with complementary tools such as support and resistance, indicators, or pattern analysis, Wyckoff can form the foundation of a robust and disciplined trading approach. Its enduring value lies in teaching traders how markets move, not just where price is going.
Educational Disclaimer
This material is provided for educational purposes only. It reflects a general interpretation of the Wyckoff methodology and should not be considered financial advice, investment recommendations, or an offer to trade. Traders should always conduct their own analysis and manage risk responsibly.

Fundamental Market Analysis for January 13, 2026 EURUSDEUR/USD is holding around 1.16600–1.16700. Demand for the dollar has eased on reports of political pressure on the US Federal Reserve: investors are treating US assets more cautiously and are partially reducing dollar positions. The euro is receiving moderate support, although overall market sentiment remains restrained ahead of US macroeconomic releases.
For the dollar, key drivers remain rate expectations and confidence in the predictability of the regulator’s policy. When uncertainty rises, Treasury yields fluctuate more and interest in alternative currencies increases. Inflation is also important: signs of slowing price growth raise the likelihood of lower rates later this year and limit the upside potential for USD strength.
In the euro area, inflation moved closer to target levels by the end of 2025, and the economy looks relatively resilient, supporting a scenario of a prolonged pause by the ECB. If nervousness around the US persists, the baseline risk for the pair is further dollar weakening and a gradual shift in EUR/USD higher as the market weighs fresh data on prices and consumption.
Trading recommendation: BUY 1.16600, SL 1.16400, TP 1.17300

Gold Is Expanding After Accumulation — Bulls Eye the Next Major Price has successfully broken out of the accumulation price zone around 4,450, confirming a strong bullish continuation after a prolonged consolidation and liquidity absorption phase. The EMA alignment and impulsive candles signal smart money participation and trend expansion.
The recent pullback and consolidation near 4,580–4,600 (POC area) appear corrective, forming a healthy pause (wave 4) rather than distribution. As long as price holds above this zone, bullish control remains intact.
A clean continuation above 4,600 opens the path toward the next upside target near 4,650–4,670, completing the next expansion leg. Only a sustained breakdown back below 4,550 would weaken the bullish structure, but for now, the trend clearly favors further upside continuation.

How did gold prices fluctuate on January 13, 2026?1️⃣ Trendline
Short-term trend: CLEARLY BULLISH
Price is respecting the rising trendline and staying above the EMA, which means buyers are in control.
Market structure: Higher High – Higher Low ⇒ no reversal signal yet.
2️⃣ Support
4548 – 4550 Nearest support, not tested yet → good zone for scalp buys
4520 – 4515 Strongest support (Demand zone + Fibonacci 1.618 + Rising trendline)
➡ If price pulls back to 4,520 and holds, it’s a high-probability trend-buy setup.
3️⃣ Resistance
4630 – 4632 Short-term resistance → scalp sell / profit taking
4643 – 4645 Major resistance (Fibonacci 2.618 + previous supply zone)
➡ 4,645 is a high-probability reversal / heavy profit-taking zone.
4️⃣ Price Scenarios
Main scenario (preferred):
Price pulls back to 4,520 → bounces → moves to test 4,645.
Bearish scenario:
If H1 closes below 4,520, the trendline breaks → price may drop to 4,495 – 4,480.
🎯 Trade Plan
BUY GOLD
Entry: 4520 – 4522
Stop Loss: 4510
Take Profit: +100-300-500 pips
SELL GOLD
Entry: 4643 – 4645
Stop Loss: 4653
Take Profit: +100-300-500 pips

Weekly outlook: XAUUSD, #SP500, #BRENT | 16 January 2026XAUUSD: BUY 4570.00, SL 4540.00, TP 4660.00
Gold starts the week near $4,570 per ounce, holding close to record highs amid stronger demand for safe-haven assets. Support comes from rising geopolitical tensions and a softer US dollar as investors reassess the stability of US monetary policy.
Over the coming days, the main driver will be US inflation data and the Fed’s messaging: if price growth remains moderate, expectations of rate cuts should keep gold in demand. A sharp jump in government bond yields could cap gains, but ongoing buying by central banks continues to provide a fundamental cushion.
Trading recommendation: BUY 4570.00, SL 4540.00, TP 4660.00
#SP500: BUY 6970, SL 6940, TP 7060
The S&P 500 begins the week near 6,966 after setting fresh record highs. Sentiment is supported by expectations of resilient corporate earnings, but the market has become more sensitive to Fed-related headlines and potential political and legal risks in the US.
Key focal points this week are US inflation data and the start of the earnings season for major banks and technology companies. Softer inflation and strong results may sustain demand for equities, while higher inflation and a new wave of uncertainty could increase caution and temporarily cool risk appetite.
Trading recommendation: BUY 6970, SL 6940, TP 7060
#BRENT: SELL 63.40, SL 64.00, TP 61.60
Brent starts the week around $63.39 per barrel: geopolitical risks in the Middle East add a premium, but the market is not yet pricing in serious supply disruptions. At the same time, attention is growing around a potential recovery of Venezuelan exports.
Over the week ahead, pressure comes from expectations of excess supply in 2026 and cautious demand estimates. Support could appear if there are signs of production cuts or new restrictions on supply from major producers, but without such news the balance of factors still favors a modest decline in Brent.
Trading recommendation: SELL 63.40, SL 64.00, TP 61.60

RSI and MACD TogetherRSI and MACD are often paired together under the idea of confirmation. If both indicators point in the same direction, the trade feels safer. In practice, this combination frequently creates confidence without clarity. The reason is simple. Both indicators are derived from the same source, price, and they often respond to the same information at different speeds.
RSI reacts relatively quickly to changes in momentum. MACD responds more slowly, smoothing price action to highlight broader momentum shifts. When traders wait for both to align before entering, they are often reacting to a move that has already unfolded. The result is late entries, compressed risk-to-reward, and increased sensitivity to pullbacks.
Confluence adds value only when each tool is assigned a clear role. RSI can help assess the current momentum environment, showing whether price behavior supports continuation or suggests slowing participation. MACD can help keep traders aligned with the dominant swing, reducing the urge to exit positions prematurely during normal retracements. Used this way, the indicators support decision-making rather than replacing it.
The combination becomes misleading when it is used to anticipate reversals. Divergences lining up across RSI and MACD feel powerful, but they often appear multiple times during strong trends. Momentum can weaken and reaccelerate without price structure ever breaking. Traders who act on indicator-based anticipation usually enter before the market has resolved its internal balance.
Another issue is redundancy. When both indicators are used to trigger entries, they rarely provide independent information. Agreement between them does not necessarily increase probability. It often just reinforces an interpretation the trader already wants to believe.
RSI and MACD work best after structure and location are established. When price has already shown intent, indicators can help manage timing, confidence, and trade duration. When used in isolation, they tend to encourage reaction instead of understanding.

EURUSD Long: Bulls Defend 1.1620 Demand, Targeting Supply 1.1680Hello traders! Here’s a clear technical breakdown of EURUSD (2H) based on the current chart structure. EURUSD initially traded within a well-defined range, where price moved sideways for an extended period, reflecting a balance between buyers and sellers. During this consolidation phase, the market attempted several breakouts, including a fake breakout to the upside, which signaled weakness and lack of bullish continuation. Eventually, price achieved a valid range breakout, initiating an impulsive bullish move. Following this breakout, EURUSD reached a pivot point, where bullish momentum stalled and sellers began to step in. From this pivot high, price structure shifted into a descending channel, characterized by a series of lower highs and lower lows, confirming short-term bearish control. Price respected the channel boundaries well, indicating an orderly corrective move rather than panic selling. As EURUSD continued lower, it approached a strong Demand Zone around 1.1620, which aligns with a rising higher-timeframe trend line. This confluence area acted as a key support, where buyers responded aggressively. From this demand zone, price broke out of the descending channel, signaling weakening bearish momentum and a potential shift back toward bullish control.
Currently, price is reacting positively from demand and attempting to move higher. The next key level to watch is the Supply Zone around 1.1680, where previous selling pressure is expected to reappear. This level also coincides with prior structural reactions, increasing the probability of a pause or rejection.
My scenario: as long as EURUSD holds above the 1.1620 Demand Zone and respects the rising trend line, the bullish bias remains valid. I expect buyers to push price toward the 1.1680 Supply Zone, where a reaction or short-term pullback may occur. A clean breakout and acceptance above supply would confirm bullish continuation. However, a strong rejection from supply or a breakdown below demand would increase the probability of bearish continuation. For now, price is at a key decision area, and disciplined risk management is essential. Manage your risk!

XAUUSD Long: Demand Defended - Bulls Prepare for Push To $4,530Hello traders! Here’s a clear technical breakdown of XAUUSD (3H) based on the current chart structure. Gold is trading within a well-defined ascending channel, confirming sustained bullish control and a strong trending environment. Price has consistently respected both the channel support and resistance, forming higher highs and higher lows. This structure highlights healthy momentum rather than an exhausted move.
Earlier, XAUUSD pushed into the Supply Zone around 4,500–4,530, where selling pressure appeared and price experienced a sharp rejection. This rejection led to a corrective pullback, during which price briefly broke below short-term structure before finding support at the Demand Zone near 4,400. This area aligns with the channel support and acted as a key reaction level. Within the pullback, price formed a Head and Shoulders–type corrective pattern, which completed near demand. Instead of continuation lower, sellers failed to follow through, and buyers stepped in aggressively. Price reclaimed structure with a clean breakout back above local resistance and the rising Demand Line, signaling that the move lower was corrective rather than a trend reversal. Currently, XAUUSD is holding above the 4,400 Demand Zone and continues to respect the ascending channel. Price is consolidating and building higher lows, suggesting accumulation before the next impulse.
My scenario: as long as Gold holds above the demand zone and the rising demand line, the bullish structure remains intact. I expect buyers to defend this area and push price toward the 4,530 Supply Zone (TP1). A clean breakout and acceptance above supply would confirm bullish continuation and open the door for further upside expansion. However, a decisive breakdown below the demand zone would weaken the structure and increase the risk of a deeper correction. For now, the trend favors the bulls, with demand holding and momentum gradually rebuilding. Manage your risk!

BTCUSDT: Consolidates Above Support, Bulls Preparing Next MoveHello everyone, here is my breakdown of the current BTCUSDT setup.
Market Analysis
BTCUSDT previously traded inside a well-defined range, where price moved sideways for an extended period, indicating balance and accumulation between buyers and sellers. This consolidation phase ended with a clean breakout to the upside, confirming a shift in market control toward buyers. Following the breakout, price respected a rising trend line, forming higher highs and higher lows, which validated a bullish market structure. As BTC continued higher, it reached a key Resistance Zone around 91,700, where selling pressure appeared. Price reacted from this area and pulled back, but the move remained corrective rather than impulsive. During the pullback, BTC found support at the Support Zone near 90,100, which aligns with previous breakout structure and the rising trend line. At the same time, price is trading below a descending triangle resistance line, suggesting compression and preparation for a directional move.
Currently, BTC is holding above the support zone and the ascending trend line, while consolidating below resistance. This structure suggests buyers are still defending the market, and the overall bullish bias remains intact as long as support holds.
My Scenario & Strategy
My primary scenario: as long as BTCUSDT remains above the 90,100 Support Zone and continues to respect the rising trend line, the bullish bias remains valid. I expect buyers to defend this area and attempt a breakout above the 91,700 Resistance Zone, which would open the door for continuation toward higher levels.
However, a decisive breakdown below support and the trend line would weaken the bullish structure and increase the probability of a deeper corrective move. Until that happens, price action favors consolidation followed by potential upside continuation.
That's the setup I'm tracking. Thank you for your attention, and always manage your risk.
