GOLD H1 HART OUTLOOKGold is currently trading in a range between 5000 and 5010. The 4990 area is acting as a key support zone based on recent price action. If price holds above this level, a potential retest of the upper range near 5100 (previous resistance) could be observed.
This analysis is based purely on technical structure and price behavior. Market conditions may change, so confirmation from price action and proper risk management are essential.
Analysischart

EURUSD Continuation of Bullish TrendMonday broke the price ranging level suggesting the books of orders are in the market.
The continuation of the bullish trend momentum in HTF.
M-W-D will continue to push OANDA:EURUSD higher and higher.
H4,H1 some pull-up into those short term resistance will be sufficient for entry.
BULL in the market ! www.tradingview.com
www.tradingview.com

EURUSD and Assets against USD are in strong bullishness ! The EURUSD and the Assets against USD are in continuity of the bullish momentum trend .
Target level in EURUSD of 1.1920 reachable by today may be the best outcome going forward a we reach the end of bullishness.
OANDA:EURUSD
www.tradingview.com

EUR/USD CHART ANALYSIS (LONDON SESSION) I 01/061. Price Action Analysis
Stalling at Resistance: The price is currently trading at 1.17347. While it's slightly higher than the previous screenshot, the recent candles are showing upper wicks and smaller bodies. This indicates that buying momentum is slowing down as it approaches the psychological resistance near 1.1740.
Trendline Adherence: The price is still hugging the ascending trendline (the diagonal black line). While staying above this line is a bullish signal, the steep angle suggests a high risk of a "break" for a technical correction.
2. Key Price Levels (Support/Resistance)
Upper Resistance: The 1.1743 - 1.1745 zone remains the biggest hurdle. Without a strong bullish candle closing decisively above this area, a reversal is likely in the short term.
The "Golden" Support (1.1720): Looking at your Volume Profile, the light blue shaded area around 1.1720 remains the Point of Control (POC) with the highest trading volume. This is a critical buffer; if the price returns here, we expect strong buying interest.
3. Volume Profile & Liquidity
The horizontal volume bars to the left of the current candles are relatively thin. This suggests the price is currently in a Liquidity Void. Prices tend to move quickly through these gaps but lack stability until they find a high-volume node to consolidate.
Summary & Strategy:
Phase: Wait for Confirmation
Scenario 1 (Correction): If the price closes below the black trendline and breaks 1.1730, the next target is a retest of the 1.1720 zone. This would be a safer entry for a Long position with a tight Stop Loss.
Scenario 2 (Breakout): If a 30-minute candle closes strongly above 1.1745, the uptrend is confirmed with a target of 1.1760.

AUDUSD (Structure High Broken)The Sells just got liquidated and there was a sharp break of structure higher high, a sell might form for tomorrow. If the consolidation does happen I think we will see a deep pullback tomorrow during red high impact news for AUD. Anyways the sells are too risky and early and price hasn't given structure for a sell with a protected high yet... This is the waiting period for structure to form. So this week I am looking for a buying opportunity because the structure sells just got invalidated, the week just started so that buy might happen at the end of the week if my analysis is correct.

Zen Technologies Limited | Technical AnalysisMarket Structure
The stock is in a long-term downtrend, marked by a clearly defined descending trendline (lower highs).
Price is currently consolidating around ₹1,350–1,400, indicating compression before a directional move.
Key Price Zones
Major Support: ₹1,000–1,100 (strong demand zone, previous base)
Immediate Support: ₹1,300–1,350
Major Resistance: ₹2,450–2,600 (strong supply zone, multiple rejections in the past)
Trend Bias
Neutral to Bullish, but only after a confirmed weekly close above the descending trendline.
A successful breakout can shift the structure from lower highs to higher highs and higher lows
Bullish Scenario
Break and sustain above the trendline with good volume:
Upside targets: ₹1,900 → ₹2,200 → ₹2,500–2,600
A pullback and hold above the broken trendline would add strength to the bullish case.
Bearish Scenario / Risk
Failure to break the trendline and a decisive breakdown below ₹1,300:
Price may move back toward ₹1,100–1,000 support zone.
Key Confirmations to Watch
Weekly candle close above the descending trendline
Increase in volume during breakout
Higher low formation after breakout
Disclaimer
This analysis is for educational purposes only and should not be considered financial or investment advice.

EURUSD Under Structural StressHello Traders,
On the H1 timeframe, EURUSD is currently trading in a corrective-to-bearish structure after failing to hold above the previously marked resistance zone. Price was repeatedly rejected from this supply area, confirming it as an active distribution zone rather than a continuation base.
Following the rejection, price expanded lower and is now rotating toward the lower range, approaching a clearly defined support zone. The recent downside impulse shows increasing bearish pressure, suggesting that sellers remain in control in the short term.
This support zone now represents a critical decision area. If price stabilizes and holds above this level, a corrective rebound toward the prior intraday targets becomes possible. Such a move would be classified as a pullback within a broader range, not an immediate trend reversal.
However, failure to hold this support — especially with acceptance below the zone — would signal further structural weakness. In that scenario, downside continuation becomes the dominant path, invalidating any short-term bullish recovery expectations.
From a structural perspective, EURUSD is currently not offering a clean entry. Price is transitioning between resistance rejection and support testing. The next directional move will be defined by whether the market defends this support or breaks through it with conviction.
At this stage, patience is required. Let price confirm its reaction at the support zone before committing to directional bias.
Share your view below.

Can Bitcoin Hold This Level?Hello Traders,
On the H1 timeframe, Bitcoin is currently trading back into a clearly defined resistance zone after recovering from the prior sell-off. The recent price action shows a series of higher lows, indicating short-term bullish pressure rebuilding as price rotates upward toward supply.
This resistance zone is a key decision area. Historically, this level has acted as a distribution zone, and price reaction here will determine whether the move develops into a sustained continuation or another corrective rotation.
If price manages to break above the resistance and hold with acceptance, the structure opens the path toward higher targets, as marked on the chart. In this scenario, continuation would likely unfold in stages, with upside extensions toward Target 1, then Target 2, and potentially Target 3, assuming structure remains intact.
However, failure to accept above resistance would likely trigger a pullback. A rejection from this zone could rotate price back toward the mid-range support levels. As long as price holds above the broader support zone, such a move would still be considered a corrective pullback within a developing recovery, not a full bearish reversal.
The bullish continuation scenario is invalidated if price decisively breaks below the marked support zone and shows acceptance below it. That would signal a structural failure and reopen the downside.
At this point, Bitcoin is not at a high-conviction entry area but at a decision zone. Patience and confirmation are required. Let the market show whether it accepts above resistance or rotates back toward support before committing to directional bias.
Share your view below.

BTC/USD H1 CHART ANALYSIS I 12/261. Volume Profile Analysis
The chart highlights three critical levels of the Value Area, representing where the majority of trading activity has occurred:
VAH (Value Area High) - 88,682: This acts as the "ceiling" of the value area. Currently, the price is reacting exactly at this level. The slight wick on the recent candle suggests some selling pressure as it hits the top of the range.
POC (Point of Control) - 87,735: This is the price level with the highest traded volume (indicated by the thin yellow line). It acts as a "magnet," often pulling the price back if the momentum fails.
VAL (Value Area Low) - 86,864: This is the "floor" of the value area, serving as a strong short-term support level.
2. Current Price Action
Impulse Move: There is a strong bullish candle (Marubozu-style) surging from the 87,000 zone to above 89,000. This indicates a sudden influx of aggressive buyers.
Rejection at Local Highs: After hitting a peak near 89,400, the price is showing signs of rejection and is currently retesting the VAH (88,682).
Market Structure: The price has broken out of the previous minor consolidation zone, shifting from a sideways range to a short-term bullish trend.
3. Potential Scenarios
Scenario 1: Bullish Continuation
If the H1 candle closes firmly above 88,682 (VAH) and holds this level in the following sessions:
The price will use the VAH as a "launchpad" to retest the 90,000 psychological level and potentially move toward the 90,800 resistance (previous highs).
Strategy: Look for long opportunities if the price successfully retests VAH with low selling volume.
Scenario 2: Mean Reversion (Correction)
If the price fails to hold 88,682 and slips back into the light blue shaded zone:
The price will likely gravitate toward the POC (87,735). This is the equilibrium zone where buyers and sellers will battle again.
If the POC fails to hold, the next target is the VAL (86,864).
Strategy: Wait for price action signals at the POC to see if "dip buyers" step in.
4. Overall Assessment
The market sentiment is short-term bullish due to the recent strong breakout. However, since the price is sitting right at the upper boundary of the Volume Profile, the reaction at 88,682 is crucial.
Pro Tip: If you are in a Long position, consider moving your Stop Loss to the 88,000 area to protect profits. If you are looking to enter, wait for a clear consolidation above VAH to avoid a "fakeout."

ETH Is Free — But Not Trending YetETH/USD – 1H
Price has broken the descending trendline, signaling selling pressure is weakening.
However, this is a technical rebound, not a confirmed uptrend.
Key Levels
Support: 2,760–2,800 (strong buyer reaction)
Current zone: 2,940–2,960 (decision area)
Resistance: 3,150–3,160 (major supply)
Outlook
Base case: range / shallow pullback, then a retest toward 3,050–3,160.
Bullish continuation only if price closes and holds above 3,160.
Bottom Line
Momentum has improved, but the real move comes after resistance breaks.
Patience beats prediction here.

SIGNAL #1 XAUUSD I 12/15🕯BUY GOLD: 4338-4340
⚠️ SL: 4334
✔️ TP: 4345-4348-4351
📌 My analysis
The 4336–4339 zone represents a previous swing low on the M30 timeframe, acting as a key technical support. On the M15 timeframe, multiple long lower-wick candles formed since Friday, indicating strong buying absorption and intense price consolidation in this area.
This price behavior suggests a high probability that the market will pull back into the 4336–4339 zone for accumulation, before resuming its upward continuation toward higher levels.
Executing BUY positions around this support zone aligns well with the prevailing bullish structure.

GOLD (H1) Price Action Analysis I 12/15On the H1 timeframe, gold is maintaining a clear bullish trend, characterized by a higher high – higher low structure, supported by an ascending price channel. The previous impulsive move shows strong buying pressure and active capital inflow, pushing price away from the prior consolidation zone and expanding higher.
After the strong rally, the market experienced a sharp pullback, but the overall structure was not broken. Price was quickly absorbed and recovered, indicating that buyers are still in control. Currently, price is trading above the VAH zone around 4254, which is acting as a high-value area and a dynamic support within the uptrend.
On the downside, the POC zone around 4208 represents a key equilibrium level where heavy volume was previously accumulated. If price pulls back deeper, this area is the next major support to watch. Below that, the VAL zone around 4169 serves as the final defensive zone for buyers; a return to this area would significantly weaken the short-term bullish structure.
Given the current context, the preferred scenario remains buying with the trend, waiting for price to retrace into value areas (VAH or POC) and looking for confirmation from price action. Chasing price at higher levels is not recommended, as the market is likely in a re-accumulation phase after the strong rally. Overall, the trend remains bullish, but the optimal approach is to stay patient, trade selectively, and manage risk strictly.

Key Levels & Bullish Bias – Intraday XAUUSD Outlook for Nov 26Gold Market Analysis – M30 Intraday Outlook
- Gold continues to push higher on the M30 timeframe, maintaining a strong bullish structure after the previous breakout.
- Current price is around 4155–4160, showing clear buyer strength and healthy continuation behavior.
- From a structural perspective, the market continues to print higher highs and higher lows, confirming that bullish momentum is still dominant.
- As long as gold remains above the 4128 pivot zone, the probability favors further upside expansion toward the next liquidity targets.
Key Levels
- Pivot Level: 4128
- Resistance / Target Zone: 4185 – 4210
- Support: 4109
- Extended Support: 4083
Trading Recommendations
✅ Primary Strategy – BUY Bias
Buy above 4128
Target 1: 4185
Target 2: 4210
As long as price holds above 4128, bullish continuation remains the most likely scenario.
🔁 Alternative Scenario
If price breaks and sustains below 4128:
Target 1: 4109
Target 2: 4083
This signals a deeper pullback into previous demand zones before any continuation attempt.
Technical Insight
- RSI remains in bullish territory, supporting further upside momentum.
- Market structure is clean and bullish, with no confirmed reversal patterns at this stage.
What are your thoughts on GOLD? Comment now or join my group to trade with me on description

E2E Networks : Future Multi-Bagger in Data Center IndustryE2E Networks is currently moving inside a large symmetrical triangle on the weekly chart, indicating a phase of long-term consolidation before a potential major move.
🔹 Support Trendline : The lower trendline has been respected multiple times since mid-2023
🔹 Resistance Line : Price is repeatedly getting rejected from the upper descending trendline
🔹 Key Buying Zone : Around ₹2,280 – ₹2,300, which aligns with the long-term support trendline
🔹 Volume : Noticeable spikes during pullbacks, showing active participation on dips
As long as the price holds the ascending support line, this zone can offer a favorable risk–reward setup for long-term investors. A breakout above the upper trendline may trigger the next strong uptrend.
📌 Not financial advice. Do your own analysis before investing.

BTCUSD 2H – Demand Reaction, Bullish Continuation Expected BITSTAMP:BTCUSD
Structure | Trend | Key Reaction Zones
BTC completed a strong liquidity grab near the supply rejection zone, confirming heavy distribution.
Price has now dropped into the strong demand box, aligning perfectly with the previous accumulation area.
Structure remains corrective within a macro bullish context — looking for confirmation candles from demand.
Market Overview
Bitcoin faced rejection at the supply zone after multiple liquidity sweeps, sending it into a 6K-point decline. However, the current price is sitting on the key demand region around 109–111K, which previously acted as the launch base for a massive uptrend. Market structure suggests potential absorption and re-accumulation here — a clean setup for a bullish continuation once buyers confirm strength.
Key Scenarios
✅ Bullish Case 🚀 → 🎯 Target 1 : 114K | 🎯 Target 2 : 118K | 🎯 Target 3 : 120K
❌ Bearish Case 📉 → 🎯 Target 1 : 109K | 🎯 Target 2 : 108K
Current Levels to Watch
Resistance 🔴 : 114K – 118K
Support 🟢 : 109K – 108K
⚠️ Disclaimer: For educational purposes only. Not financial advice.

XAUUSD - MARKET CONTEXT #2 I SEP/26/2025📈 Main Trend
Gold is showing signs of breaking out of the short-term downtrend line as price continues to form Higher Lows (3732 → 3739 → 3745). This indicates active buying pressure, with bulls gradually taking control.
🔎 Price Structure
Previously, price formed a Low at 3737, then maintained a sequence of Higer Low → Higer Low → Higer Low, confirming steady recovery momentum. If price holds above the H1 trendline, the likelihood of forming a new Higher High increases.
🛡 Key Zones
- Support: 3732–3739 (Higher Low zone). A successful retest and bounce here would confirm bullish continuation.
- Resistance: 3770–3780 (previous highs + rejection zone). A breakout above this range would strengthen the bullish trend further.
📊 Market Sentiment
Following key news (Powell’s speech + recent GDP/Unemployment Claims), the market reacted but failed to trigger a strong dump — showing weakening selling pressure. Currently, price is waiting for a clear breakout to confirm the next directional move.

MARKET CONTEXT I SEP/22/2025🔎 MARKET CONTEXT
- Gold has rallied strongly, breaking past previous resistance zones and is now testing the H1 Resistance Zone around 3705–3710.
- The main trend remains bullish with a Higher Low – Higher High structure.
- However, the current price area overlaps with strong H1 resistance → short-term profit-taking pressure may appear.
- Volume supports the bullish trend but is slowing down as price hits the H1 supply zone.
📍 TRADING SCENARIOS
🟢 Scenario 1 – BUY on pullback to 3683–3685 (H1 Support + VaH zone)
Conditions:
Price retraces slightly to 3683–3685
Bullish reversal candles appear (Pin Bar / Bullish Engulfing)
Volume recovers after pullback
Reason:
Confluence of H1 VaH + uptrend line
Strong support for the main bullish trend
🎯 Target: 3705 → 3715 → 3735
🛑 SL: below 3675
🟡 Scenario 2 – BUY on breakout and hold above 3710
Conditions:
H1 candle closes above 3710
Successful retest of 3710 without breaking back below
Strong breakout volume
Reason:
Confirmed breakout of resistance → opens a new bullish leg
Triggers long-term trend-following buying
🎯 Target: 3725 → 3735 → 3750
🛑 SL: below 3700
🔴 Scenario 3 – SELL rejection at 3705–3710
Conditions:
Strong bearish rejection (Bearish Pin Bar / H1 Engulfing)
Weakening volume at the top
Reason:
This is a strong H1 resistance zone with multiple prior reactions
Short-term profit-taking may trigger a corrective move
🎯 Target: 3685 → 3665
🛑 SL: above 3715
⚠️ Scenario 4 – SELL if support 3683 breaks
Conditions:
H1 candle closes below 3683
Failed pullback back above the zone
Volume confirms strong selling pressure
Reason:
Losing this key support shifts momentum to sellers
Price could test deeper H4 support levels
🎯 Target: 3660 → 3636
🛑 SL: above 3690
📌 SUMMARY
- Main priority: BUY on pullback to 3683–3685 support or breakout above 3710.
- SELL setups are only short-term and require strong confirmation signals.
- Zone 3705–3710 is the key decision point today for the next market direction.
- Manage risk strictly as the market is at a sensitive area (near major resistance).

ACTION PLAN I SEP/18/2025(BUY or SELL) Right now the market is at a sensitive point and may reverse in both directions ⚡️.
👉 That means there’s nothing certain enough to rush into a trade yet.
✅ Action plan:
Stay on the sidelines to avoid getting trapped by noise.
Only trade at the value zones I’ve analyzed and marked out.
Patience and discipline remain the key to capital protection and profit growth.

3,417 – 3,360 (final defense for buyers).1. Price Structure
Gold has surged strongly from 3,360 → 3,657, forming a steep uptrend inside a rising wedge channel.
Currently, price is near the upper boundary of the wedge and has just made a pullback.
2. Pattern & Technical Signals
A rising wedge pattern is visible, which often signals downside pressure when price touches the upper boundary.
The recent candlestick shows a long upper wick, indicating strong selling pressure around the 3,657 top.
The blue arrow on the chart highlights a potential correction back toward the wedge’s lower trendline.
3. Fibonacci Support Levels
From the rally 3,360 → 3,657:
Fib 0.786 = 3,573: short-term support, likely to be tested.
Fib 0.618 = 3,508: key medium-term support.
Fib 0.382 = 3,417: if this breaks, the short-term uptrend could reverse.
Red zone (3,360 – 3,417): a strong demand zone, may attract buying interest again.
4. Possible Scenarios
Scenario 1 (primary):
Price continues to correct down toward 3,573 – 3,508, then rebounds if the trendline holds.
Suitable for trend-following buys if reversal signals appear around the 0.618 Fib.
Scenario 2 (breakdown of wedge):
If price breaks below the wedge and Fib 0.5/0.382, it could drop back to 3,360 – 3,417.
In that case, the short-term bullish trend weakens → short opportunities may open up.
5. Conclusion
Gold is currently in a correction phase after a strong rally.
Key levels to watch:
3,573 – 3,508 (decisive for holding or losing the uptrend).
3,417 – 3,360 (final defense for buyers).
👉 Short-term: wait for price action signals around 0.786 – 0.618 Fib zone to consider buying with the trend.
👉 Medium-term: if 3,417 breaks, bearish momentum could return.

“Layers of Liquidity: The Hidden Brushstrokes in XAUUSD”“Layers of Liquidity: The Hidden Brushstrokes in XAUUSD”
When I observe this chart, it feels much like studying a Renaissance painting—full of depth, contrast, and hidden meaning. Every candle tells a story, just like brushstrokes on a canvas.
The strong support zone at 3260–3300 acts like the foundation of the painting, the solid base on which the entire composition stands. Just as an artist relies on balance in structure, the market relies on this level for equilibrium.
The resistance zone near 3440–3460 resembles the sky in a painting—bright and tempting, yet out of reach for now. The fake breakout projected above this level can be compared to an illusion of light in art: it draws the eye upward, but the truth lies in the shadow beneath.
Every higher low crafted along the way mirrors the gradual layering technique used by master painters, building depth and strength in the image. It is not a random stroke—it’s deliberate, showing that buyers are stepping in consistently, giving the chart rhythm and structure.
The liquidity sweep resembles the hidden symbolism often placed in classical artworks. At first glance, it might look chaotic, but its purpose is intentional—to trap participants and prepare for the next phase of movement.
From an educational perspective, this chart demonstrates that markets, like art, are a mixture of illusion and reality. Breakouts may be false, supports may be tested, but the true skill lies in learning how to interpret these strokes. Just as art critics read the layers of paint, traders must read the layers of price action.

XRP Price Poised for at Least 30% Growth or DeclineA look at the XRP price shows that if it breaks the $3.2 resistance level, it could surge to at least $4. Conversely, if negative news emerges and the $2.9 support level breaks, it could plunge to around $2.

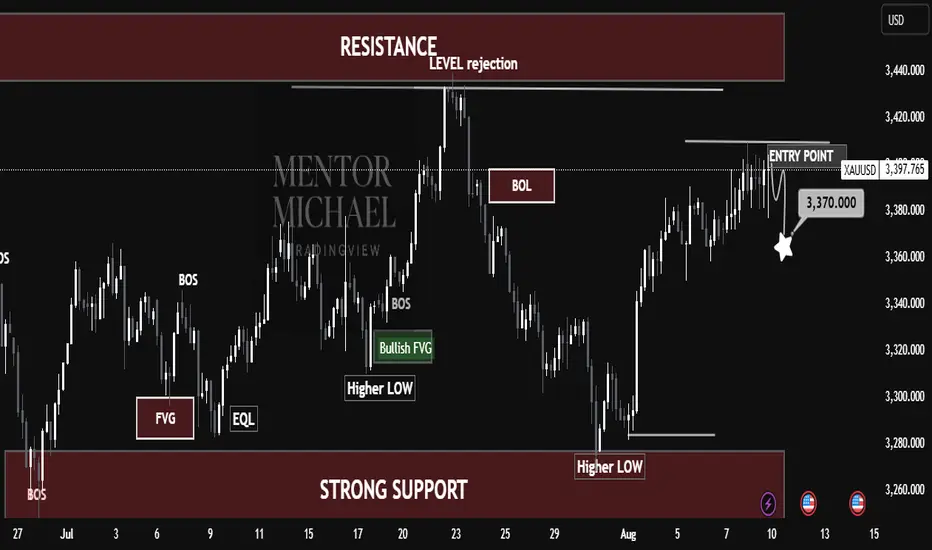
Gold on the Verge of a Big Move – Key Level in Focus!Gold on the Verge of a Big Move – Key Level in Focus!
Market Structure:
BOS (Break of Structure) signals have confirmed bullish momentum in prior swings.
Price created a Bullish FVG (Fair Value Gap) around mid-July, which provided demand for the next upward leg.
Consecutive Higher Lows indicate that buyers remain in control.
Key Levels:
Strong Support: $3,260 – A major demand area where buyers have stepped in multiple times.
Resistance Zone: $3,420–$3,440 – This is a significant supply area where price faced rejection earlier.
BOL (Breakout Level) around $3,390 – Price recently tested and is attempting to break above.
Trade Setup Highlighted:
Entry Point: $3,397 (short bias suggested by chart structure at resistance)
Potential Target: $3,370 – aligns with minor liquidity grab and possible retest of broken structure.
Market Logic:
Price is currently testing a resistance level rejection zone.
The expectation in this setup is a short-term pullback to collect liquidity before a possible continuation.
If $3,370 holds, bulls may resume toward the higher resistance zone at $3,420+.
Educational Takeaway:
BOS indicates a shift in control (bearish BOS = sellers taking over; bullish BOS = buyers taking over).
FVG is a gap in price that often acts as a magnet for retracement.
Higher Lows are key signs of a bullish trend.
Support & Resistance act as decision zones where traders can anticipate reversals or breakouts.
📌 Summary:
XAUUSD is in a bullish structure but is currently testing a resistance rejection zone. A short-term retracement to $3,370 is probable before any continuation higher. Swing traders should watch price behavior at support for a potential long continuation setup.
#PENGUUSDT confirms a bearish impulse📉 SHORT BYBIT:PENGUUSDT.P from $0.034625
⚡ Stop loss $0.035646
🕒 Timeframe: 4H
⚡ Overview:
➡️ A Double Top pattern BYBIT:PENGUUSDT.P has formed, signaling a bearish reversal.
➡️ The price broke the $0.0355 support and is consolidating below, confirming seller strength.
➡️ Increasing sell volume confirms bearish control.
➡️ Main focus on targets in the $0.034–0.033 zone.
➡️ The POC at $0.03113 remains the ultimate bearish objective.
🎯 TP Targets:
💎 TP 1: $0.033947
💎 TP 2: $0.033369
💎 TP 3: $0.032948
BYBIT:PENGUUSDT.P Trade Recommendations:
📢 Hold short towards the TP zones.
📢 Watch for reaction around $0.0339 — partial profit-taking possible.
📢 Invalidation if price reclaims above $0.0356.
⚠️ As long as bearish pressure holds, the price is likely to continue towards TP2–TP3.
⚠️ A recovery above $0.0356 would invalidate this setup.
🚀 The signal confirms a bearish impulse — expecting further downside!
