GBPJPY 2025GBPJPY was a banger this year, a great one. I'm already out of the market and looking for the next great opportunity.
Analyst

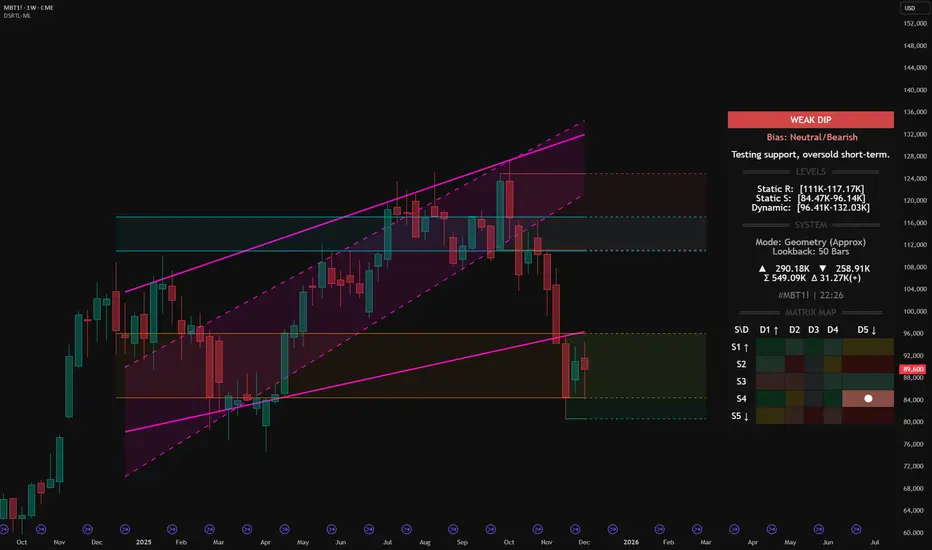
Micro Bitcoin Futures (MBT1!) – DSRTL‑ML Weak Dip at supportMicro Bitcoin Futures (MBT1!) – DSRTL‑ML Weak Dip at S4–D5 Support
We are analyzing the weekly structure of Micro Bitcoin Futures (MBT1!) using the institutional DSRTL‑ML support/resistance engine. On this bar the indicator classifies the state as WEAK DIP with a Neutral/Bearish bias and the system message:
Testing support, oversold short-term.
This reading comes from the current matrix position S4–D5 on the Matrix Map and defines the context for the price action inside this support zone.
1. DSRTL Matrix Diagnosis – State S4–D5
S4 – Static Support in Control
Price is trading inside the DSRTL Static Support band:
Static S: 84.47K – 96.14K
In the logic of DSRTL‑ML, this green support zone marks a historical high‑volume demand node where passive buy liquidity has previously absorbed aggressive selling. It behaves as a structural floor rather than a neutral price area.
D5 – Overshoot Below the Dynamic Channel
At the same time, price is positioned below the 5‑Point Dynamic Channel:
Dynamic Band: 96.41K – 132.03K
State D5 describes a downside extension beneath the lower boundary of the dynamic channel. Within this framework, that move is read as an oversold displacement away from the equilibrium path of the trend geometry, not as a fully confirmed new downtrend on its own.
Combined Reading – WEAK DIP with Neutral/Bearish Bias
The overlap of:
price sitting inside Static Support S4, and
price being oversold relative to the Dynamic Channel (D5)
produces the WEAK DIP classification. The Neutral/Bearish bias tells us that the dominant leg into this area is still downward, but the current candle represents a weaker phase of that dip occurring directly into a pre‑defined demand floor.
2. Key DSRTL Levels on This Chart
From the Levels and System panels on the chart:
Static Resistance (Supply Block): 111K – 117.17K
Upper structural ceiling derived from the DSRTL matrix of historical volume and price interaction.
Static Support (Demand Block): 84.47K – 96.14K
The active S4 floor where the current weekly bar is developing.
Dynamic Channel (Trend Geometry): 96.41K – 132.03K
The 5‑Point trend channel that defines the dynamic path of price; its lower edge around 96.41K is the first mean‑reversion checkpoint above the market.
Volume Metrics on This Bar:
Buying volume (▲): 290.18K
Selling volume (▼): 258.91K
Total volume (Σ): 549.09K
Delta volume (Δ): +31.27K
The positive delta together with the WEAK DIP label supports the idea that, inside S4, aggressive selling is meeting responsive buying rather than progressing as a fresh impulsive breakdown.
3. My Structural View Based on DSRTL‑ML
From a structural perspective, I read this configuration as follows:
Context of the Trend
The Neutral/Bearish bias confirms that the larger move into this zone is still a downward leg. The market is not flagged by DSRTL‑ML as a confirmed bullish reversal; instead, we are in a weak phase of the decline, pressing into defined support while the geometry is stretched.
Support Floor and Invalidation
As long as weekly closes remain above roughly 84.5K – the lower boundary of the S4 block – I consider this area a working demand floor for the current sequence. A decisive weekly close below that level would invalidate the weak‑dip narrative and shift the focus to a more developed breakdown of support.
Primary Path While S4 Holds
If S4 continues to hold, my expectation is that the oversold S4–D5 state will tend to resolve through mean reversion back toward the lower edge of the Dynamic Channel around 96.41K. In DSRTL terms, that is the first structural magnet above price once an overshoot has occurred.
Next Reference Above the Channel
Should price manage to re‑enter and hold inside the Dynamic Channel, the next major reference becomes the Static Resistance block at 111K – 117.17K. In my view, that zone represents the upper boundary of the current weekly structure and the area where I would expect supply and volatility to increase again.
In short, DSRTL‑ML currently maps MBT1! as a weak dip into S4 support with a still‑bearish background trend. My directional view is that, while this support holds, the structure favors a corrective mean‑reversion phase toward the dynamic band rather than an immediate continuation breakdown, with any weekly close below the S4 floor acting as a clear structural invalidation.
Indicator used for this analysis: DSRTL‑ML (Dynamic Support & Resistance Trend Logic).
Disclaimer: This publication expresses my personal opinion on the MBT1! chart based solely on the DSRTL‑ML indicator and standard price/volume analysis. It is not financial or investment advice and does not constitute a recommendation to buy or sell any instrument.
GBP/JPY Bullish Continuation Toward 215.00 TargetGBP/JPY is trading around 201.09, maintaining an upward trendline support. The pair is consolidating near resistance at 201.50, with a potential bullish target set at 215.00 if price breaks above the current range.

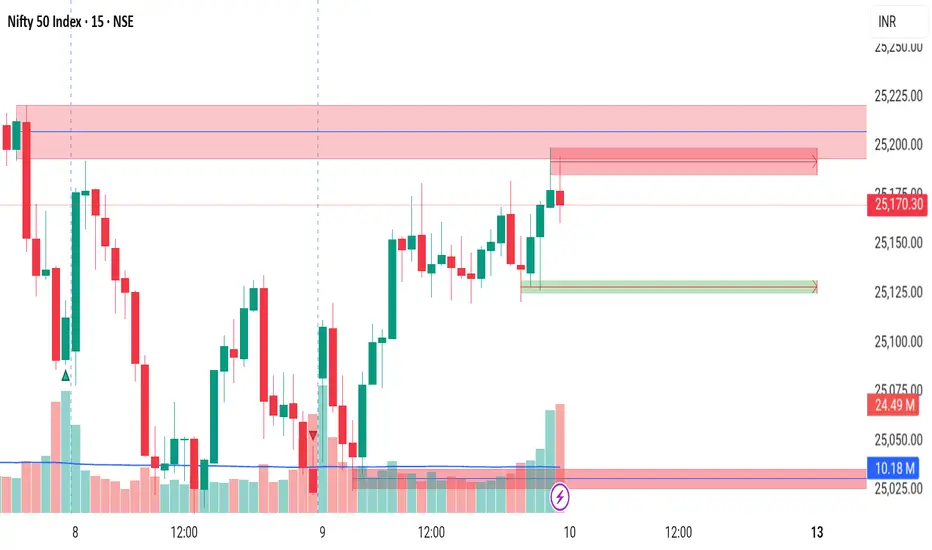
#Nifty 10th October Friday - #CatchAndRead Nifty50 10th October Friday - zigzag untadaa - #CatchAndRead
Follow my Yt channel link in dp
BTC/USD Trap to bullish Trend Still This chart shows *Bitcoin (BTC/USD)* on a daily time frame with a *bullish* outlook.
- *Current price*: 97,924
- *Target 1*: 101,980
- *Support level*: Around *81,053*
The price has recently made a correction from the highs, and there's a potential for a *bounce back* towards *101,980*. The support zone around *81,053* suggests a possible area for a reversal if the price drops. Traders should be cautious of any potential downside movement towards this level, but the overall trend appears to be *bullish* towards the target.
*Key points*:
- *Resistance* around 101,980
- *Strong support* near 81,053
- *Bullish scenario* in the short term
This setup suggests a potential price rise back towards *101,980*, with key support at *81,053* in case of a downturn. Always consider proper risk management and stay updated with market movements.

GoldToday price headed up wonderfully, and it may do so next opening but I'm expecting a retracement before new highs are formed watch the Sibi shown and the inversion. GOOODTRADING YALL. $£

NZD/CAD Buy Opportunity Our market update already hit TP on NZD/CAD before with the sell position, which played out well. Now, we're shifting gears with a BUY possibility!
Entry: 0.82530
Take Profit: 0.84505
Stop Loss: 0.81089
This setup is based on a careful analysis of the current market conditions. As always, trade responsibly and manage your risk wisely! This is not financial advice.

ETHEREUM EYEING 4000 LEVELS AGAIN ! Buy @ 2550 or above
Target : 3000, 3500,4000
Stoploss : 2000
Month chart clearly shows buy trend.

Cake USDT - 21/03/24 UpdateAfter 14 hours 30min of waiting finally TP has got reached.
Long Live & Prosper Cake! 🖖

PayPal Holdings, Inc.💰Daily log chart.
Uptrend with short-term acceleration, in the second channel.
The question, will prices exit the medium-term channel, from above?
Price above the 200-day moving average.
Make up your mind.

BTC Stage 2 of 3 Gann Analysis “Test Post” 1st ever Please let me know if you see the image of my charting, if so I will post about more in depth. Absolute high as you can see can go no higher than price seen until 2025.

BuyI looked in chart this pattern and want to share chart for experts advice so any one who looked this chart please respond back and correct me thank you for your advice

Shibainu ... Harmonic pattern I see an ascending butterfly pattern in this chart, it is likely to have significant growth. I see an ascending butterfly pattern in this chart, it is likely to have significant growth.

Shibausdt ,, tecnicall analyst 🐕From the number 663 in Shiba, we have been placed in the ascending channel, I also specified the ascending channel in (Rsi). Now we are waiting for the psychological number of 1000 for Shiba, in which Shiba has always reacted. So in the number 1000 . Maybe this will happen with a downward pullback, but it will happen very quickly, and it will continue its growth path soon, great choices always give great answers. Be profitable🌹

Tesla to $315Fibonacci retracement on the annual time frame indicates that Tesla will return to the highs north of $300 within the coming months.

Market go up from here?NSE:BANKNIFTY
Price is supporting the trendline on the 1-day time frame, so is this fall just a retracement?

XAUUSD Technical Analysis 11.04.2023 1h chart– Previous Daily candle closed Bearish at 1991.100 respecting Daily Resistance formed on Thursday 6th April 2023.
– Buys on close above 1994.400 targeting 1h Resistance at 2002.000, Leaving Runners to the next 1h Resistance at 2007.900.
– Sells on close below 1987.200 targeting 1h Support at 1981.900 which is also the wick fill of the previous Daily Low, Leaving Runners to the 1h Strong Support formed at 1978.000.
– FOMC Member Harker due to speak about the economic outlook at an event hosted by Wharton Business School in Philadelphia.

GBPJPY Technical Analysis 11.04.2023 1h chart– Previous Daily candle closed strong Bullish at 165.350 breaking above the Daily Resistance formed on Wednesday 5th April 2023.
– Buys on close above 165.500 targeting 4h Resistance at 165.810, Leaving Runners to the 1h Resistance at 166.210.
– Sells on close below 165.180 targeting 1h previous Resistance formed at 164.910, Leaving Runners to the 1h Support formed at 164.670.
– Ideally is to wait for price to pullback to form Support on the lower timeframe allowing the new Daily candle to form a bottom wick before breaking the previous Daily High for more potential Buys.

4/6 Watchlist + NotesInitial Thoughts: Incredible day, markets closed friday, minimal inside day setups
SPY - Mentioned yesterday that we were bearish going into today for a number of reasons. Early on in the session we saw SPY push up slightly only to be rejected by a downward trend line created in premarket. We hit our downside target at the mid 406 level and even pushed lower than that before making an afternoon reversal. We also hit our lower trend line on the broadening formation created yesterday on the daily. Overall played out perfectly, only could have asked for more downside to 404 if anything
TOMORROW: Due to how we closed and previous daily patterns similar to the one we're in now, I am still slightly bearish going into tomorrow, but I think we need to be cautious. With this week being a 4 day trading week, and being at the beginning of a potential daily/weekly reversal point, I think we could see some consolidation just as easily as we could see more downside. Full disclosure, I am not extremely confident in us seeing more downside tomorrow, but it makes the most sense based on our situation. Ideally I would like to see a move lower to the 404 area before consolidating. OVERALL BIAS: Cautiously Bearish
Watchlist + Bias:
BABA 2-1 Daily: Slightly Bearish (Only inside day to show up on the scanner)
SQ - 3-1 Weekly: Neutral (Still has not broken out)
DOCU - 1-1-2D Weekly: Bearish (Finally broke out of inside week setup. Watching for continuation going into tomorrow and next week)
SHOP - 50% Rule Weekly: Bearish (Finally saw the downside we wanted the other day due to a failed 2U reversal today. Looking to see SHOP hit 44.01 between tomorrow and next week)
Main Watch:
SQ - Not a crazy good setup, but definitely interested with the weekly chart. We still remain within our inside week setup. I am watching tomorrow to see if we can breakout in either direction to pick up a swing position for next week. I would prefer downside due to my bias with SPY, but I will be open to playing upside as well since SQ is set up to do well in either direction. It is worth noting we made a failed 2D on the daily, which gives us a small bullish bias for tomorrow on SQ, but the past 4 days have been failed 2s, so that may be irrelevant. Entry Long: above 68.24. Upside Targets: 69.74, 70.53, 72.64. Entry Short: Under 66.62 Downside Targets: 65.81, 64.56, 63.51, 61.55
Yesterday's Main Watch:
DOCU: What a solid trade. Opened at our short entry, and then dropped steadily throughout the day until reversing with SPY. Cons ran well over 400% from entry (.21 -> 1.06 If I remember correctly). I hope you all can take this play and learn from it, specifically how powerful trades can be if you have a crazy setup like we did with the double inside week. Hope everyone was able to make some money on this one.
Watchlist Stats:
3/3 SPY predictions
3/4 Main Watch Plays
Top Winner: DOCU (400%+)
Personal Stats:
2/3 On The Week
Overall: Green
- Completely turned the week around for myself after being barely red from monday's session. I credit this to patience and discipline. Most traders would be super eager to start trading again after a losing day. Having patience and waiting for that right trade to turn things around is absolutely key to mastering emotions and being successful in trading. All it takes is 1 good trade per day. Don't overtrade (I know it is very easy to do, and I used to struggle with this), have patience, and most importantly, be comfortable with taking losses, not conditioned to taking losses.
Tomorrow will be tricky if I had to guess. Trade smart, and be careful as it is the end of the trading week. And if I am unable to make monday's watchlist until later this weekend, enjoy the holiday for those who celebrate it!

NAS100 Quick Long. Practicing for my 10k Funded Account challenge. I'm taking a quick long noting on the one hour is showing support and i'm just looking for a 1.5 too 2.5% on a 10k Account per day which would be around 150$ to 250$

SPY PRICE ANALYSIS - ANOTHER VERY VOLATILE WEEK Hello All!
Expect some crazy volatility this week due to all the economic data thats coming out. Currently i'm only playing scalps on movements that i see. I do expect the market to go down further going into the next coming months but it will take some time- so dont over trade and end up blowing your account.

NEW SHORT ENTIRES FOR SPY!The market has finally seen that leg down for which we were hoping for. We shorted 405 with avg of 406.5 and Ive been taking profits as we make lower lows. We should see some further upside to maybe 386-388 which is the next area to short.

SPY THE NEXT LEG DOWN TO 360s The market is finally breaking down! We had another short entry at 405 which is discussed in my last video; if you aren’t already in a short- its best to wait for a entry. The market WILL go to 360s however your entry needs to be on point otherwise you will take a loss on any small move up on the way down!
