NFLX Watching for another BreakoutNFLX gapped up on the morning of 5/18 with high momentum and a volume spike both of
which faded by mid-day shown on this 15- minute chart. Since then price has been in a narrow
consolidation range centered about the POC line of the multisession volume profile. Price is
in the fair value area between the mean anchored VWAP and the +1 STD band. The zero lag
MACD is confirmatory for a trend resting in consolidation
I will watch for green candles in a row with the second having more range than the first. I will
check to see if the relative volume is 2X the running mean. If so, I will enter and try to get
the early breakout. Stop loss will be $365 below the POC line. I will exit upon seeing upper
wicks and volume falling back down to the mean. My expectation is for a quick 3 to 5 percent
trade with a R:R of better than 10:!.
Anchoredvwap

CVNA - Retracement UnderwayCVNA in the past couple of trading sessions had a 20 % move and then reversed downward.
As shown on the 1 hour chart, price is below the demand/ resistance zone and sitting on the
POC line of the multisession volume profile where volatility is often at its highest. The
anchored VWAP indicator shows the bands are nearly flat. Price is in the fair value zone and
falling towards VWAP. RSI is near 60 and dropping.
I see this as a decent short setup.
The first target is before the VWAP at 11.20 while the second target is at 10, the confluence
of the bottom of the high volume area and the first VWAP band below the mean. the stop
loss is near to the first VWAP band above the mean at 12.55.
Fundamentally, CVNA has a decent earnings report but is subject
to an impending recession where consumers may be not inclined to make big purchases such
as cars.

BOH Bank of Hawaii Is this a safe short?BOH has been in a downtrend for 2 months since the very beginning of the small bank crisis all
precipitated by the fed and its rate hikes confounding the value of bonds with fixed yields.
As can be seen on the 4H chart, price was in consolidation in January and February but the
dropped out of the supply / resistance zone which is quite thick by the Luxalgo indicator.
Price hit another consolidation range at about $ 50 and then moved lower as the banking crisis
was temporarily stabilized but then took another downside leg. the moving averages show
price underneath both the EMA 100 and EMA 20 while also in the range of three standard
deviations below the mean anchored VWAP. the EMA100 and the mean anchored VWAP
provide confluent super-trend direction. Support is breaking down; Price is in the deep
undervalued area and has not stabilized where it is. As such it bargain hunter's dream but
more likely a solid and sate shorting candidate. I always keep in mind if a catalyst such as
federal rescue measures comes into play, and price reverses above say $36.00 some buying
momentum could come into effect especially if short sellers need to cover their positions to
out with a small profit or loss. This play would have far less liquidity than PACW but perhaps
more room to the downside from which to realize profit.

ACB Aurora Cannabis Long SetupOn the 4H chart ACB has dropped out of a head and shoulders pattern list winter with high
volume into a downtrend with lower volume now into support / demand as shown by the
Luxalgo indicator. The anchored VWAP is also trending downward with support at the minus 1
and minus 2 standard deviations. The volume profile shows the majority of the recent share
exchanges have been at the $0.65 per share area. If price rises above that POC line of the
profile, ACB will get the attention of new buyers while short sellers will begin to cover thus
causing buying pressure and momentum. I will buy a sizeable quantity for perhaps $1-2K shares
once price gets over that POC line. Prospective buyers will consider this to be a reversal
confirmation. I will be one of them. The first target is the volume void at $0.79 or about
25% with the other target being one standard deviation above VWAP at about $.90. Stop loss
will be set at $0.05 below the entry. For profit insurance I will hedge with a single put option
contract at a strike of $0.70 with a 90-120 DTE to diminish risk at a minimal cost.

PSNY Polestar EV Startup Can it Rise from Bottom?PSNY ( Polestar) has dropped to its lows after an earnings report which shown it still has no
cash flow but at least the losses are less than projected by the analysts. On the chart zoomed
out, price is in megaphone pattern which demonstrates increasing volatility. Price is at the
bottom support trendline and one standard deviation below the anchored VWAP. This suggests
15% upside in the immediate short term. Price action is starting to resemble that of Fisker
(FSR) . I see this as a risky swing long trade as price tries to rise to the VWAP and POC line
of the volume profile. ( PSNY is in better shape than NKLA and RIDE but not by a whole lot )
I would be very reluctant to make an investment in Polestar but happy to play the volatility
for profit.

BLUE Biotechnology New Earnings Catalyst LONGBlueBird Bio / BLUE had an earnigns report this past week showing earnings for the firat time
but revenue was far below analyst's projections. Price has appreciated 40% in the 4 weeks
since earnings which is about 500% annualized. GO BLUE.
On the daily chart, price was above VWAP and consolidating much of last fall then dropped
this YTD until the earnings report of last week. An uptrend is seen after the earnings.
This has been a significant reversal sustained over the past month
with price rising above the support / demand zone below it. At present, price is one
standard deviation below VWAP making it undervalued and ascending.
I see this as a risky long trade like many biotechology penny stocks but with a decent
probability of profit in consideration of a target of 6.15 which is the top of the long
term high volume area. the stop loss is just below the POC line of the volume profile
at 3.15 An entry at 4.62 ( limit order above SMA200 (redlne) would yield at profit of
1.50 with a risk of 0.48 making for a R:R of 3:1. Another earnings report is coming up this
week. If it is favorable, BLUE could go parabolic to hit the target in a day or two.
If not, it will be time to exit the trade.

TRLY Undervalued / Fed Fix Long SetupThe 2H chart on TLRY shows a volume profile showing the highest concentration of shares
traded at $2.65 or about 15% above the current price. Short sellers dominated there. Price has
descended down onto the support/demand zone. It is near to tow standard deviations below
the mean VWAP and so very undervalued.
Federal legislation intended to remedy the cannabis industry's issues with banking, commercial
loans and other financial liquidity has begun. This is huge for this subsector and could cause a
breakout from the deep undervalued territory.
I will take a long setup here for a decent amount of shares and hedge with a single
put option for risk management/insurance. ACB is similarly positioned.

UVXY Volatility Index ETFUVXY as shown in the 15 minute chart is slightly above the basis line on the Bollinger Bands
as shown also on the BB indicator or Luxalgo. Price is slightly below the mean VWAP of the
anchored VWAP situated in the fair value area as also confirmed by the volume profile and
its POC line confluent with the VWAP bands. Given impending federal data reports and news,
I expect volatility will rise. UVXY could have positive price action in the range of 10% in
tomorrow's trading day which can be day traded or scalped.

F Surprised on Earnings Ready for Rising PriceFORD ( F) significantly surprised on earnings no matter that a recession may be underway and
no matter its balance sheet is saddled with debt which is increasingly more expensive to
services. Pre-orders for the Lightning F -150 are strong. On the 2H chart, price has yet to
react to the earnings surprise. Volume has picked up but nothing dramatic. The zero-lag
MACD lines have crossed under the histogram and are now crossing over the zero line.
Price in a sign of strength rose out of its Fibonacci band channel and is just below the
anchored mean VWAP while at the uppermost portion of the high volume area of the volume
profile. I see this as a good place to take a long position targettting $ 12.80 to 13.00
with a stop loss at $ 11.80 below the POC line of the volume profile.

FAZ Bear Leveraged Financial Economy ETF LongAs the fed raises rates to try to throttled down inflation, the economy and the financial sector
suffer. FAZ got its catalyst today in the federal news. It is a bearish fund that will go up
while the FAS ETF will go down.
On the 2-hour chart, the price can be seen rising to crossover the VWAP anchored a month back.
It is nearly crossing over the POC line of the intermediate-term volume profile.
These are both bullish moves confirmed by a dramatic increase in trading volumes perhaps
4-5X of the moving average volume.
The overall picture is a long trade setup either with stock or strategic but more risky
call options which could 10X.

EURGBP SHORT @ ResistanceEURGBP on the 30-minute chart has ascended to the supply / resistance zone marked by
the LuxAlgo indicator. It is far extended in the overvalued zone two standard deviations
above the mean anchored VWAP. There is confluence in the volume profile which shows
price far above the POC line and also above the top margin of the high-volume area of the
profile. Finally, the stochastic RSI is showing bearish divergence. Accordingly, I will take
a short position and also check the EURUSD pair and GBPUSD pair for analysis.

AUDUSD Rising LONGOn the 4H chart, AUDUSD is rising over the intermediate term volume profile POC and ascending the anchorded
VWAP bands as well; Price rose from undervalued to fair-valued on the VWAP bands.
The Chris Moody RSI indicator flashed a a pair of buy signals and RSI rose over the 50% line.
Another good sign is price is approaching a volume void /gap on the volume profile. Finally
there was a mild volume spike when price reversed from the bottom of the high volume area on
the profile. I am looking for rising price action in the intraday upcoming once both London
and New York sessions are overlapping.

ULTA has Overextended Strength SHORTULTA a women's beauty focused company has benefitted from the end of the Covid Era,
Earnings reports have been rock solid for sure.
I think ULTA is overdue for a correction.
On the 4H Chart, supply and demand zones are per the LuxAlgo indicator. Price touched
and retested demand several times last summer and early fall. It is now touching and testing
the supply zone above the POC line of the long term volume profile. It is in the overvalued
region of the long term anchored VWAP bands.
The Wycoff buying /selling oscillator is still positive but with a decreasing amplitude.
I see ULTA as setting up for a short sell entry. The entry could be now but a better
entry would wait for price to get under the POC line at HKEX:528 and the volume oscillator
turn to negative with the histogram below the zero line showing bearish volume momentum.
My preferred position is a put option at a strike of HKEX:530 expiring on 5/19/23.

SPY Long Term Trending Up LONGOn the weekly chart, SPY has formed an inverted head and shoulders in the past
9 months Importantly price has now passed above the POC lines of the long term
and intermediate term volume profiles. The inverted head and shoulders pattern
is classical for a bullish bias for price action. Price has been cconsolidated about
the central VWAP of the anchored VWAP bands locked onto the covid lows.
SPY should now make an attempt to rise toward the 2022 high of 480.
The RSI indicator confirms the long term trend with increasing strength.
In consideration of this I will take a call option trade of the strike of
$415 to HKEX:425 with 90-120 DTE. Overall, the SPY weekly chart, suggests
a general market recovery is increasingly probable. Those keeping their powder
dry and staying ready with cash will be rewarded once the market slows down for
the summer and gets more active in the fall months/

SPY's Triangle Reflects the Chop, but Battle Lines ConvergePrimary Chart : 195m chart of major US index, the S&P 500 represented by the SPDR® S&P 500® ETF Trust, with symmetrical triangle pattern and anchored VWAPs
SquishTrade has posted fewer analyses lately as markets have been quite uncertain and choppy. When there is less certainty in the analysis, there should be less to say. And prudence dictates avoiding confusion by creating analyses and forecasts when trends are unclear and markets remain choppy.
This post will not present a directional view given the high level of choppiness and uncertainty. Instead, it will show where the battle lines, so to speak, are drawn. The market may deign to inform us where the next trend move will be when key levels begin to break. And sometimes, markets will not inform us until after a few false moves—in other words, lies come before the truth perhaps. Indeed, this market has been difficult to trust even for directional moves under one or two days' time.
First, the smaller triangle within the larger triangle will likely break even if a false break comes before the real one. This may coincide with price breaking to the other side of key anchored VWAPs shown as well. This may signal whether the upper or lower trendline of the larger symmetrical triangle will be tagged next. But until the upper or lower trendlines of the triangle are broken decisively, i.e., not a false break, the trend may remain unclear.
Rate volatility has perhaps exacerbated the uncertainty in equity markets to an even greater degree as rates on the shorter end of the curve have whipsawed dramatically, e.g., 2-year note and yield both whipsawing along with Fed Funds rate futures and other interest-rate products and instruments like the Eurodollar futures.
Here are the key points to watch in the coming weeks:
The longer-term symmetrical-triangle pattern shown on the Primary Chart
The smaller triangle within the larger symmetrical triangle, shown on Supplementary Chart A below
Supplementary Chart A
The key anchored VWAPs, Supplementary Chart B, that are converging and compressing similar to the very nature of the larger triangle's own converging trendlines, though VWAPs are more fluid and curvy
Supplementary Chart B
The POC on a daily chart has remained around 395-396 for quite some time (not shown), and this remains a key pivot for SPY
The POC on a weekly chart has remained around 393.70-394.90 for quite some time (not shown), reinforcing the key pivot on the daily at 395
Several Anchored VWAPs and Fibonacci levels all coalesce around 390 (ranging from 389-392); a key gamma level on PSY also lies here.
________________________________________
Author's Comment: Thank you for reviewing this post and considering its charts and analysis. The author welcomes comments, discussion and debate (respectfully presented) in the comment section. Shared charts are especially helpful to support any opposing or alternative view. This article is intended to present an unbiased, technical view of the security or tradable risk asset discussed.
Please note further that this technical-analysis viewpoint is short-term in nature. This is not a trade recommendation but a technical-analysis overview and commentary with levels to watch for the near term. This technical-analysis viewpoint could change at a moment's notice should price move beyond a level of invalidation. Further, proper risk-management techniques are vital to trading success. And countertrend or mean-reversion trading, e.g., trading a rally in a bear market, is lower probability and is tricky and challenging even for the most experienced traders.
DISCLAIMER: This post contains commentary published solely for educational and informational purposes. This post's content (and any content available through links in this post) and its views do not constitute financial advice or an investment or trading recommendation, and they do not account for readers' personal financial circumstances, or their investing or trading objectives, time frame, and risk tolerance. Readers should perform their own due diligence, and consult a qualified financial adviser or other investment / financial professional before entering any trade, investment or other transaction.
Thank you for reading. If this post added clarity or prompted additional thoughts on the technicals of SPY, please comment below!

MILN Electric Vehicle Penny Stock MULN is a nine-penny stock that is high volatile with a wide ATR.
On the 15-minute chart, price is currently sitting above the support zone
shown by the Luxalgo indicator. Upside to the resistance zone is
nearly 40% which this stock can do in 1-2 days. Just in the past two days
MULN formed a double top at 12 cents near to the VQAP + 2 then tended down.
After the downtrend price currently in the undervalued range one standard
deviation below VWAP which MULN is using for support.
The RSI confirms price as in the low oversold zone while the high relative
volume in the past couple of days affirms trader interest. Once a reversal
is steadily underway I suspect a volume surge will drive price higher
and do so quickly.
I see this as a great opportunity to take swing long trade looking for
at least 1/2 of the upside 40%. The stop loss will be set just below the support zone.
If price moves there the trade is invalidated. If not the target is 12 cents at the
level of the double top or alternatively a more conservative target of one standard
above VWAP ( blue line) at about 11.4 cents. Lastly, there is the alternative of
inexpensive options which if taken strategically can significantly leverage
the returns of a stock trade.

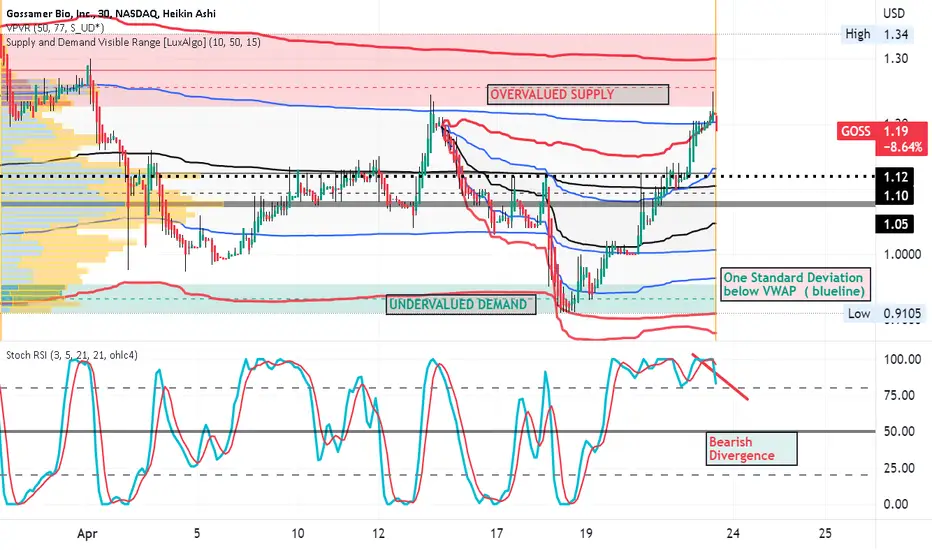
GOSS Penny Biotechology SHORTGOSS is a biotechnology penny stock without earnings valued based on future earnings
potential based on a "pipeline" which is subject to a long timeline of FDA regulation.
On the 30 minute chart. price is shown as being in the overvalued area in the upper VWAP
band and well above the POC line of the long-range volume profile. The RSI indicator is
now showing a bearish divergence as the relative strength is weakening. Price has bounced
down from the resistance of the line representing two standard deviations above VWAP.
The supply / demand zones are indicated by the Indicator applied which is authored by
Luxalgo. Price has hit the supply zone lower border and is now in an early reversal.
I see this as a swing short trade also played with taking put options. Stop loss is
in the upper area of the red supply zone. Targets include first the POC line of the volume
profile and then a final target at one STD below VWAP also being just above the demand zone.
Alternatively put options at the strike of $ 1.50 for the May monthly expiration of 5/18
This trade will benefit from any expected pullback in the general markets.
GE reversing to down trend SHORTGE has been trending recently off a base of consolidation after a downtrend. In the last session,
the reversal began. The 15 minute charts shows price riding the upper bands of the anchored VWAP
in the overvalued and overbought zone. The support resistance indicator of Luxalgo shows that
price bounced down from the resistance zone. The stochastic RSI shows bearish divergence and
loss of strength. I see this an opportunity for a swing short trade which will be synergized if the
general market takes a downturn in the week upcoming. I will play this with put options with
10 DTE at a strike a few percent above market price and look for 50 % return in the 5-7 trading
days upcoming. I will sell a few days before expiration no matter to avoid time decay affecting
the potential profil.

SIGA a Biotech breakout last summer- then breakdown ? reversalAs shown on the daily chart dating back to last summer SIGA has been on a persistent decline since the cooling down from the parabolic
breakout last summer. Is there a repeat in the picture? Fundamentally, earnings continue to be weak. much of the stock is held by insiders and
the whole monkey pox thing is settled down although the main product may have use in malaria, leper's disease or whatever other orphan use
it has indications by the FDA and its foreign counterparts.
The technical picture is that it is sitting just above support shown by the Supply Demand Zone indicator of Luxalgo having double bottomed
and now a bit above it. The volume indicator shows a mild increase in buying volume in the past couple of weeks. Price is more than one
standard deviation below the long-term anchored VWAP in the undervalued over-sold zone.
With a weak biotechnology company where insiders have a fair portion of the shares, manipulation can occur. Once a price rise issues
short sellers will buy to cover, and retail traders will jump on board, insiders will "manufacture" a catalyst to prime the pump further.
At some point, the run-up will stall, and the implode itself. I will get on the ride early, a biotechnology speculative trades are
in my playbook. The stop loss here is below the demand zone while the target is the 50% retracement of the downtrend drawn onto
the chart by the Fibonacci Retracement tool.

BTC May Take the Scenic RouteRegardless of whether you are a bear or a bull, BTCUSD will probably take the scenic route. This may sound like max pain theory, and it probably is.
One follower asked recently for an update on BTC. My last BTC post called for another push higher before going lower. A the time that was published, BTC traded in the upper $18000s and the downward TL (log scale) was just overhead. BTC then moved higher to the downtrend line, paused, and then broke above it. This coincided with major US equity indices and many other risk assets that broke above similar down TLs. This removes some of the certainty that an effective downtrend line provides, i.e., it contains price and provides a reasonable entry point for short positions in a downtrend and reasonable entry point for long positions in an uptrend.
For those who think the break of an uptrend is conclusive signal that price is returning to all-time highs, beware of the history of past bear markets in equities. This happened with SPX in 2000-2002. A chart of SPX from 2000-2002 is also included to show the break of the down TL that eventually failed.
Supplementary Chart A
SquishTrade does not assert that BTC will necessarily follow this pattern in SPX shown by a upside break of its major down TL in the 2000-2002 bear market. Rather, this example serves to illustrate why a trendline break alone isn't necessarily and all-clear signal or a trend-reversal signal on a larger time frame. It just takes away some of the certainty that had existed when that trendline effectively contained price below it, and reversed price every time it rallied to meet it.
Furthermore, a down trendline is not the only measure of a trend. Moving averages, Ichimoku Cloud and others perhaps capture the more flexible nature of a trend, and include a cushion (much like the wider cloud does within the Ichimoku system). Not every market participants market memory is at the same exact angled line. Using a weekly Ichimoku Chart, BTCUSD remains in a downtrend, characterized by the very wide cloud that is red colored (because the Senkou Span B line remains above the Senkou Span A line—bullish would be a green cloud where the SSA line is trending above the SSB line), and confirmed by price trending well below the cloud.
Supplementary Chart B (Ichimoku Cloud Weekly Chart)
The daily Ichimoku Cloud chart, however, looks quite bullish. Price has broken above the cloud, the cloud has turned green, and things look hopeful on this timeframe. So why is price stalling? Probably because major resistance lies overhead despite what shorter time frames suggest.
Another measure of trend includes VWAPs and long-term moving averages. The VWAP from the November 2021 all-time high lies around 30,000 today. The 50-week moving average, interestingly, lies right at the major resistance level shown by the blue rectangle sitting at mid-August 2022 highs. This 50-week MA (not shown) is at 25,040 today. The 100-week MA is even higher. These are important trend measures as well and lie overhead and slope downward.
Fibonacci retracements help to show where a corrective move may end, and the 50% retracement seems like a very firm resistance level that would not be broken in the near term absent market chicanery. The 50% retracement is at $32,681. In fact, corrective retracements at every degree of trend (here the primary degree is shown) can retrace up to 61.8% or 78.6% of the prior wave. In this case, the prior wave could constitute the decline from the ATH to the November 2022 low, and the retracement could run all the way to $38,900 before failing and returning to lows. Wish more certainty could be provided, but these possibilities remain on the table.
But overall, the technicals remain highly uncertain. Price could tag the $25,000 resistance, move down to the magenta uptrend line and then return to tag some key level in the lower half of the massive trading range that formed BTC's topping pattern in 2021. When price action is this uncertain in an asset, it makes sense to step aside unless one is acquiring for a very long term hold (like a buy-and-hold investor or a "hodler"). Even buy-and-hold investors should incrementally scale into their investment (a key tactical strategy often noted by @SPY_Master) with sound technical and fundamental arguments and invalidation levels too on larger time frames.
In the near term, price could easily move up to tag the resistance from the prior August 15, 2022 high, which may create a final, and more drastic divergence before a pullback. This seems a bit more likely, but again, don't rely on anyone's forecast, watch the price action and the levels if you can. To reiterate, that key level is just overhead, and lies at $25,200.
If that $25,200 level is broken above and held, then the .382 retracement—which coincides with the lower-edge of BTC's topping range—could easily be reached at $27,300-$28,032.
But before price can move any higher, it has to move over the teal-colored VWAP shown on the Primary Chart above. That has been a difficult level for BTC in the last couple weeks. BTC seems to be chopping above and below it. In the bulls favor (short term), that VWAP is flattening however.
The intermediate-term uptrend is defined by the magenta line on the Primary Chart above. A pullback to this line would actually be reasonable and healthy consolidation for bulls if this uptrend is to continue and actually attack the larger downtrend on weekly Ichimoku Charts or the downtrend as represented by the VWAP from the all-time high (dark blue at $30,000 today).
Finally, consider that major negative momentum divergences have appeared on the daily chart. This doesn't mean price will crash suddenly to new lows, but it does suggest the upward move is in its final stages right near major resistance levels. This could lead to a sharp pullback at a minimum to the uptrend line. Or it could break that uptrend line if enough fear and force allow. That should be watched closely. If the magenta uptrend line is broken decisively, watch out for a new low.
Hope this post helps provide new perspectives about what levels to watch in the coming weeks, and what price levels are important to consider.
________________________________________
Author's Comment: Thank you for reviewing this post and considering its charts and analysis. The author welcomes comments, discussion and debate (respectfully presented) in the comment section. Shared charts are especially helpful to support any opposing or alternative view. This article is intended to present an unbiased, technical view of the security or tradable risk asset discussed.
Please note further that this technical-analysis viewpoint is short-term in nature. This is not a trade recommendation but a technical-analysis overview and commentary with levels to watch for the near term. This technical-analysis viewpoint could change at a moment's notice should price move beyond a level of invalidation. Further, proper risk-management techniques are vital to trading success. And countertrend or mean-reversion trading, e.g., trading a rally in a bear market, is lower probability and is tricky and challenging even for the most experienced traders.
DISCLAIMER: This post contains commentary published solely for educational and informational purposes. This post's content (and any content available through links in this post) and its views do not constitute financial advice or an investment or trading recommendation, and they do not account for readers' personal financial circumstances, or their investing or trading objectives, time frame, and risk tolerance. Readers should perform their own due diligence, and consult a qualified financial adviser or other investment / financial professional before entering any trade, investment or other transaction.

CAT Swing Long ReversalCAT has a downtrend 10% from its 30-day high.
However, fundamentally the industrial is holding up quite well.
The downtrend was inverse parabolic accompanied with
an appropriate volume pattern showing 3X relative volume
This is sometimes called the retirement trade pattern
or V-type pattern. CAT has dropped to three standard
deviations below the anchored VWAP /
This makes it undervalued well below fair value.
I see this as a good setup for a long swing trade or a call options
contract with the expectation of a 50% retracement of a
10# drop or a 5% price target For the call options I will
target the anchored VWAP at a strike of $243 about 12 DTE.

ABNB rejected by anchored VWAPRejected three times but another test incoming... If over, bulls have control

MSFT Reaches Equilibrium within Its DowntrendPrimary Chart: Weekly Chart of MSFT Showing Down Trendline, 200-Week SMA, Key VWAPs and Fibonacci Levels
Microsoft Reaches a State of Equilibrium within Its Downtrend
Equilibrium means "a state of balance." Equilibrium has been reached precisely because MSFT is holding above long-term support, and below its primary downtrend resistance levels. It also has been acting bullishly (the failed breakdown today already discussed). SPX remains in a very tight triangle pattern, and this likely resolves soon (as the apex is approaching rapidly), perhaps after the February 1, 2023 FOMC. MSFT will likely follow suit with whatever direction SPX takes after that key decision. Markets seem to be interpreting every bit of news bullishly at the moment, giving even negative headline a positive spin. This should not be surprising, as markets do whatever they want, and this favors technical analysis. So markets may continue fighting the Fed even if nothing new is stated at the FOMC presser on February 1, 2023.
SquishTrade will briefly summarize key technical points concerning Microsoft Corporation NASDAQ:MSFT . This firm reported earnings yesterday after the closing bell. Initially, the stock popped vigorously on what appeared to be earnings that were not as bad as feared. But when it gave guidance on its earnings call, the firm fell just as violently. During trade today, however, the forces buoying markets helped MSFT recover back above its uptrend line that runs from early January 2023 lows. This "failed breakdown" is short-term bullish from a technical perspective.
Upside price targets have a lot of obstacles in their path given that the primary-degree downtrend remains intact from all-time highs in late 2021. Thus, any upside price target should be viewed as tenuous and conditional on substantial further progress in major indices (SPX / NDX). Upside price targets include two alternative Fibonacci and measured-move projections as well as major resistance from previous swing highs (blue rectangle) and down trendline resistance. Downside support remains at the 200-week SMA as well as the uptrend line off 2022 lows (dark blue).
Conditional upside price targets
1. If SPX breaks its triangle pattern (approaching its apex now) to the downside, upside price targets should be invalidated. The FOMC presser on February 1, 2023, may be a critical turning point for markets.
2. Provided markets continue pushing higher, with pivot-hopeful stocks leading the way, and provide SPX breaks above its triangle pattern even if only for a few weeks, MSFT can reach $254.67 (which it reached after hours yesterday after the earnings report), and the 200-day SMA also aligns with this level (not shown) as of today. The down TL also lies near this area. If the downtrend line is broken convincingly, $261-$263 can be considered a more aggressive upside target, with the most aggressive target around $270-$273.
3. Downside support remains at the blue uptrend line from 2022 lows. Shorter-term support at the parallel channel from January 6, 2023, lows is also important. This support held despite a volatile whipsaw below it today after earnings were reported.
Importantly, this post does not intend to imply that the Fed will pivot. No one knows when that happens, and the Fed has been stating that it intends to keep rates higher for longer, above 5% for all of this year. But mention of a pause by the Fed, or a discussion of a pause by the voting members, can fuel further rallies especially in technology stocks by participants who perceive this (perhaps incorrectly) as a pivot.
Summary of key technical evidence :
MSFT's weekly chart shows MSFT holding above an upward sloping 200-week SMA after piercing this long-term MA a couple of times.
But the down TL from MSFT's all-time high remains intact. In fact, MSFT's down TL has not been attacked the way that SPX and NDX's down trendlines have been in recent weeks.
Key VWAPs from all-time highs and from mid-August 2022 highs remain intact as well. The mid-August 2022 VWAP was resistance today, though barely so. The VWAP from the lows of 2022 was recovered today after a failed breakdown below it after earnings yesterday.
MSFT has been forming higher lows (and higher highs) since its low in 2022. An uptrend line can be drawn from the October 2022 low to the present price bar.
MSFT's candle this week has formed a doji—a technical signal of indecision (and equilibrium between buyers and sellers). This has followed large moves up and down in volatile trade after earnings were reported this week.
MSFT experienced a failed breakdown below recent support and the shorter-term uptrend channel after earnings. This is short-term bullish suggesting the possibility of further upside.
A major horizontal zone of resistance from 260-270 has rejected price firmly since late August 2022.
MSFT may follow the direction SPX takes out of its consolidation triangle, where price is rapidly nearing the triangle's apex.
Additional Charts
Supplementary Chart A
Notice how MSFT's price reclaimed the VWAP from the November 2021 low. That seems bullish. But it also failed at the anchored VWAP from the August 2021 high. That seems weak. This is yet additional evidence of the equilibrium between buyers and sellers, perhaps waiting to see if the Fed remains hawkish or if markets rally no matter what the Fed says, because the market has resolutely refusing to believe the Fed's dot plot anyway.
Supplementary Chart B
Notice this logarithmic linear regression channel's upper edge (+2 standard deviations) coincides with the downward trendline from the 2021 peaks as well as with the major area of resistance / supply (the blue rectangle shown).
Concluding Comments
Lastly, SquishTrade will address a few issues relating to the forces that appear to be at work as equities, including MSFT, rise higher despite bad news. It appears that markets are eagerly anticipating a Federal Reserve pivot or pause of some sort in the near future. There is some disconnect between what the Fed has said and what markets believe. Markets have priced in rate cuts later this year in fact, and the Fed's dot plot from the most recent FOMC meeting shows 5.1% as the terminal rate to be held throughout the entirety of 2023 with *no cuts anticipated.* Many believe that this Fed approach will soon change, as reflected by equity prices and Fed Fund futures pricing in rate cuts. Further, FOMO, combined with short covering, and CTAs that trade strictly with momentum in whatever direction, have driven prices near mid-December 2022 highs in the indices.
Disinflationary trends have caused investors to believe that inflation is history. While inflation may have reached its peak, certainty about whether it will return to the Federal Reserve's target of 2% remains elusive. Will sticky inflation keep monetary policy tight for the remainder of the year? Will the market be proved wrong and ultimately decline to new lows because the Fed's view is right and the markets are fighting the Fed? Will the Federal Reserve pause hikes and hold rates higher for longer until more evidence appears that inflation is well on its way to the target?
No one knows the answers to these questions, but they are relevant to what is happening in markets right now. If the market is wrong about inflation quickly returning to the Fed's target, or if the market is wrong about a "soft landing" (earnings and the economy not falling into a major downturn), then markets will quickly and viciously reach new lows. Until these become more apparent, expect prices to remain buoyed in MSFT and other major names.
Thank you for reading, and Happy New Year / Feliz Año Nuevo!
________________________________________
Author's Comment: Thank you for reviewing this post and considering its charts and analysis. The author welcomes comments, discussion and debate (respectfully presented) in the comment section. Shared charts are especially helpful to support any opposing or alternative view. This article is intended to present an unbiased, technical view of the security or tradable risk asset discussed.
Please note further that this technical-analysis viewpoint is short-term in nature. This is not a trade recommendation but a technical-analysis overview and commentary with levels to watch for the near term. This technical-analysis viewpoint could change at a moment's notice should price move beyond a level of invalidation. Further, proper risk-management techniques are vital to trading success. And countertrend or mean-reversion trading, e.g., trading a rally in a bear market, is lower probability and is tricky and challenging even for the most experienced traders.
DISCLAIMER: This post contains commentary published solely for educational and informational purposes. This post's content (and any content available through links in this post) and its views do not constitute financial advice or an investment or trading recommendation, and they do not account for readers' personal financial circumstances, or their investing or trading objectives, time frame, and risk tolerance. Readers should perform their own due diligence, and consult a qualified financial adviser or other investment / financial professional before entering any trade, investment or other transaction.
