EURUSD - Long (Head and shoulder pattern completed)Price has completed a head and shoulder pattern and is currently retesting break line. Looking for a signal to buy to 1.173.
For further confirmation, wait until price breaks daily resistance line and then place order.
AND

Right shoulder of inverted h&s forming smaller h&s patternNot sure which way this will break but its very important to be aware of the current smaller head and shoulder forming inside the right shoulder of the inverted head and shoulder pattern...the drop target for the this smaller h&s pattern is not enough to invalidate the inverted h&s but there is always a chance for it to fall well past the drop target. Definitely something to keep an eye on. The RSI + stochrsi on the daily, 4hr, and hourly should help give us some indication of which way is more likely. As well as any bullish or bearish divergences.
4 hour chart inverted cup and handle on ETCIm an ameture trader to a 't' although i belive that what im looking at could be an inverted cup and handle bullish on the release. Any ideas comments concerns appreciated.

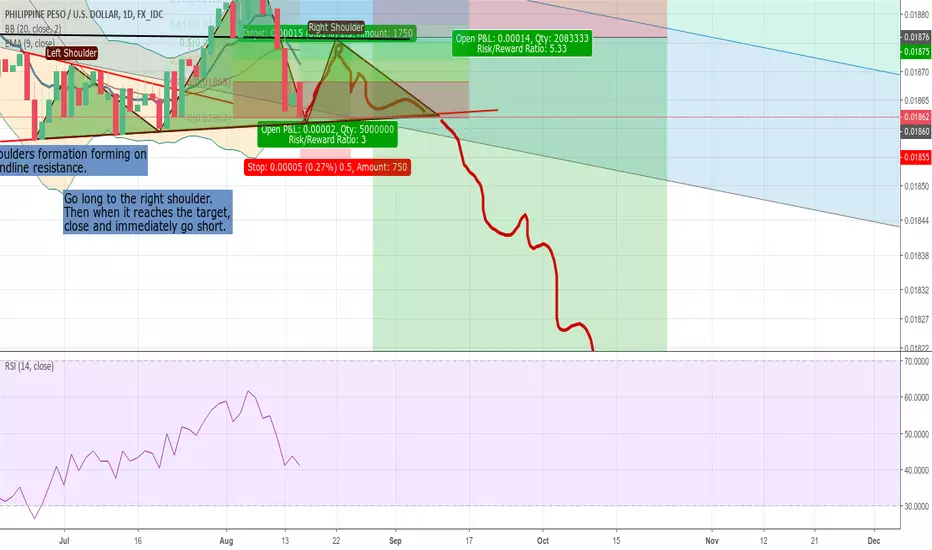
PHP downtrend continuation. Great R:R.The Peso continues to decline this month. Since the 10% crash from January to February, the long term trend is in a downwards channel. However I believe that it will once again break below the channel and continue to fall. (Click and drag on the price axis to move the chart).
Looking at more short term profits:
A Head and Shoulders pattern is forming on the daily chat. This is normally a reversal pattern and not a continuation, however I believe that a 50% retracement of the "head" will still act as resistance, as it has in previous red daily candles. See the black horizontal minor resistance level from the past month as this also lines up.
Normally the target of this H&S would be a 1:1 extension of the head to the neckline, however because it will be breaking this important channel, there is no resistance there to hold it so expect a drop fast. Possible resistance level is the black line on the chart.
The RSI is not near the oversold level, so still has further to fall.
Downsides:
-There have not been any noticeable H&S formations on this pairing in the past.
-H&S normally signifies a reversal rather than continuation.
-The resistance in the channel may be enough to push it back up as this "H&S" is not yet so big. If this fails then look for a short opportunity after a larger structure.
Good luck trading.
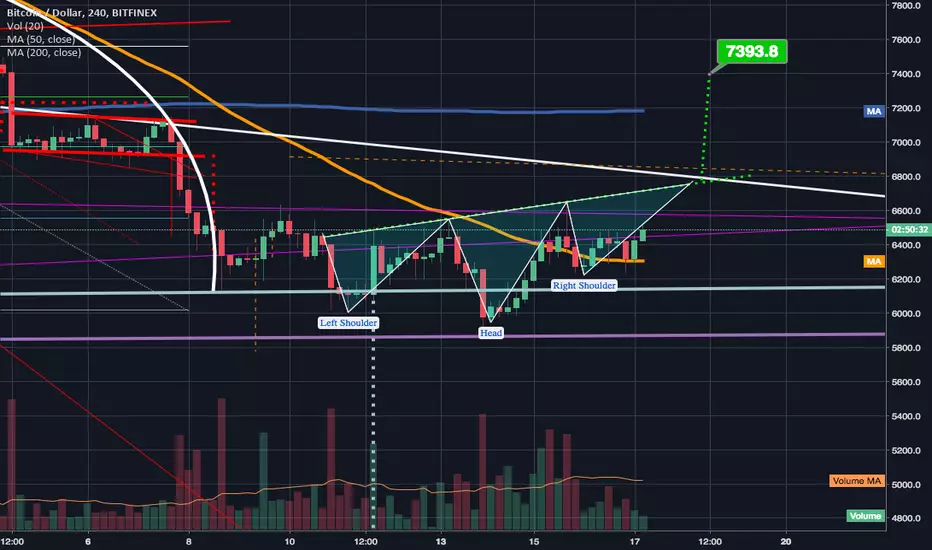
Potential Inverted Head & Shoulder Pattern on 4hr chartAfter seeing a nice fakeout on the daily of the inverted cup and handle pattern we are now seeing the 4hr chart form both a higher high and at least for now what appears like it will be a follow up higher low...if so the odds are favorable of following that up with another higher high and in doing so very likely we could trigger this currently developing inverted head and shoulder pattern. Though the 4hr chart is looking bullish we must still keep in mind that on the 1 day chart we have a giant bear flag and an inverted c up and handle to tend with...one of these 2 paths will be chosen either the bullish 4hr chart scenario will p;ay out or the bearish 1 day chart scenario. So be ready for either this idea for these reasons will be listed as neutral.
Technical and Fundamental Analysis of GBPUSD.On the daily chart, the 200EMA shows me where the long term trend will be for the currency, the EMA showed that price was below the EMA which indicates that the trend is bearish.I can also see a breakout on the price resistance line(1.26978) so it could show that the price will continue to go down.I switched to the 4 hour to see if the Ichimoku signals show bearish signals, there is bearish cross with Kijun Sen is in top of the Tenken sen which shows price is bearish. Price is also below the pink cloud which shows signal for the that the trend is bearish. Also the Chikou space shows that the line is below price which gives e the confirmation that the trade is more likely to go bearish. The fundamental news was on the GBP and it was the U.K. Average Earnings Index +Bonus is the measure of the change in the price businesses and the government pay for labour, including bonuses. The Average Earnings figure gives us a good indication of personal income growth during the given month, but also potential inflationary pressures. The U.K. Claimant Count Change is the measure change in the number of unemployed people receiving unemployment benefits in the U.K. during the reported month. A rising trend indicates weakness in the labour market.. as both of the readings were lower than previous, the Average Earnings Index +Bonus previous was 2.5% and the actual was 2.4%, the U.K. Claimant Count Change previous was 9.0K and the actual forecast was 6.2K .it means that price will do be in a bearish forecast. I would go short on this major pair.

GBP/AUD Broken Head and Shoulders - EntryHead and shoulders pattern on the daily chart. Now currently pulling back. Awaiting break of trendline on H1 chart to enter. Possible 1000 pip plus move to be had over the next couple of months (hopefully).

Inverted Cup & Handle Fakeout confirmed?As I said in the last 2 ideas wait for confirmation from the volume in this situation. I also said that with both the 4hr and 1 day charts rsi levels right near the oversold zone it would be very difficult for price action to sustain triggering an inverted cup and handle. Right now we are seeing lots of volume. and a big green candle spike...Odds are very good that we will be breaking upward from here but always be prepared for a fakeout even at this level. So far so good...need to keep a close eye on the close of this 4 hr candle as well as the next one to eb sure we will sustain this pump.

XRP in a potential inverted cup & handle as well.This cup and handle is a little more crude than btc's and is slanted downwad but could still be just as valid. Stay focused be careful and pay close attention. Try to avoid all fakeouts don't act until you see some sort of volume confirmation. Notes for myself of course and not financial advice. Best of luck in whatever strategy you choose to employ.

BTC threatening to break inverted cup and handle necklineHard to believe that when the 1 day rsi is this close to the oversold zone that this inverted cup and handle would have any room to plummet here. However if it does indeed trigger we could be lookin at a dip all the way down to 3.6-3.7k . There's a chance if it does trigger it would be a flash crash of sorts. Which could be what could finally catapult the price back up to where we need it to be. there' is 2 and a half hours left on the current 4hour candle to climb back above the neckline so for now we will wait and see...but it is indeed looking very ominous for now.

swing opportunity the seller is obviously struggling to bring the price lower as there must have not enough selling money down there , price most likely to go higher to find the big money .. most probably will enter this monday , looking for daily candle to close as a pinbar or demand zone created in lower timeframe

We saw a slight bounce but there's a chance of an inverted c&hShown hear is the potential cup of the inverted cup and handle play very close attention to price action and whether or not it dips below this neckline. To trigger an inverted cup and handle here could dip us to 3.6k-4k so I'm hoping this doesn't happen but after the last inverted cup and handle we broke down from its wise to at least be prepares and keep an eye on whether or not this pattern plays out...hopefully we go upward instead 3k is not something this market needs.

Small H&S TopWhat do you think about this possibility?
Small H&S being formed on BTCUSD with a
target of 6200?

BTC New Rocket? Sub Daily I am neutral. Daily I am definitely leaning bullish.
Analysis:
In most of these downtrends with BTC you see several triangle consolidations, and they become more visible with the Heikin Ashi. Right now we are breaking up out of one.
Moving Averages:
On my 8HR Heikin Ashi I have translated 50+200 Daily SMAs as well as 50+200 4HR EMAs.
All MAs are consolidating. The 50 EMA could create a nice rejection off the 200 EMA indicating bullish movement.
The Daily 50 SMA was pressed, possibly indicating a reversal.
Pivots/Fibs/Support/Resistance:
Monthly Pivot was breached but only recently. Weekly S2 was tested and held well.
Previous resistance zone 6850 and local Fib might be turned support now.
TD Sequential:
Daily had a fairly gentle decline, and 8 HR Heikin Ashi put out several bullish indicators recently.


DJIA Dow Jones Industials - Beware the Head and Shoulders DJIA Dow Jones Industial Average Futures: DJIA1!
This was a great short overnight on the break below 25257 line for a fall to the next line at 25094.
It fell to this level exactly.
Perfect, technically speaking.
It should now make a rally attempt back as high as 25245-25257 range at best before it falls away again.
This price action would also form a head and shoulders on this index with a 451 point downside target at 24643. Interestingly there is already fixed support waiting for it at the 24641 line.
Look to short the counter rally and if this fails from lower than we ideally want it to will have to short on a break lower than 25080 with stops at least 30 above.
*For fastest Updates on major markets in real-time through the Summer holidays please check link at top-left of main page. Be lucky !

SandP 500 Index Head and Shoulders Formation
SandP 500 SPX500USD
The head and shoulders formation mentioned in earlier posts has duly formed its right shoulder over the last 24 hours or so - it's higher than it should be for a perfect H&S but nevertheless it still looks quite powerful.
It carries with it a minimum downside target at 7242 which is close to the fixed support line at 2740.
It was a sell once the neck-line broke at 2797 back to the 2790 line for a quick scalp - sorry, was too busy with Bitcoin update to get an S&P update out quickly enough.
Right now it's holding up from a low at 2789 but the counter-rally cannot be trusted.
The mood is still febrile, animal spirits to the fore.
Earning season makes for jumpiness, not helped by Trump's level playing-field mantra playing out across the airwaves.
It's time to look for the next best opportunity from here...
Ideally the S&P will rally further back towards the neck line at 2797-2800 range around the US open before falling away again to the downside target.
And if we don't see the counter rally as above we need to be ready to short once the 2787 level is broken with stops above here by 4 points or so.
We should get some action today.
Get ready!
*For updates to major markets in real time over the Summer hiatus please see link to Global Markets at top-left of main page.
31st July Update
We also have Apple numbers after the close which should give some succour to the bulls today.
It can therefore counter rally to 2809 and above to the parallel immediately above it at likely best before it comes off again.
Eventually it should break the little dynamic underpinning the current counter rally and fall away to 2796 at least and more likely to the 2790 line where it should bounce again. A quick scalp at likely best.
If so it will start to form a potential head and shoulders - perhaps waiting for Apple numbers - which may then go on to create the right shoulder.
Still too sketchy right now to know that though.
At any rate cannot trust the rally yet - at least until we see a restest and double bottom form at 2796.
So far this looks like a dead cat bounce.
Was hoping for better clarity here, looking for a better/bigger short from higher up.
But Apple's figures may just upset that apple cart and muddy the waters even further.
Looks like scalps at best again so far today : (

USDJPY Weekly Trendline Violated! Chance To Go LONG
The weekly long term trendline on this pair has been broken and a potential long opportunity is setting up.
I am currently waiting for the channel that is forming on the 4 hour chart to break and retest the 50 EMA on 4 hr chart. Stay tuned for any updates!
However i will only take this trade when i exit my other active USD position. I do not want to risk my capital buying 2 USD pair at the same time. Nevertheless its a good opportunity and if your analysis meets the criteria you can execute at your own risk!


Up and ATUSOk so 5ish % growth is not that much but it looks like it's found a support at 16.40 I don't know but I have a feeling about this one, can it be a breakout? hmm...

Chain-Link forming a head n shoulder with a 9 forming Chain link forming a head n shoulder with a 9 forming on the support line via Thomas DeMarks sequential indicator....easy 12 - 15 percent gain before it tanks?

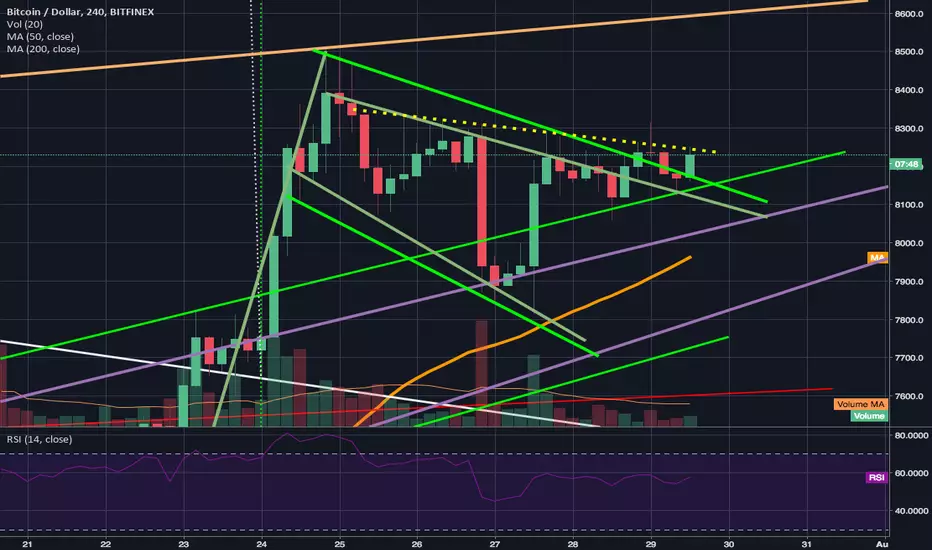
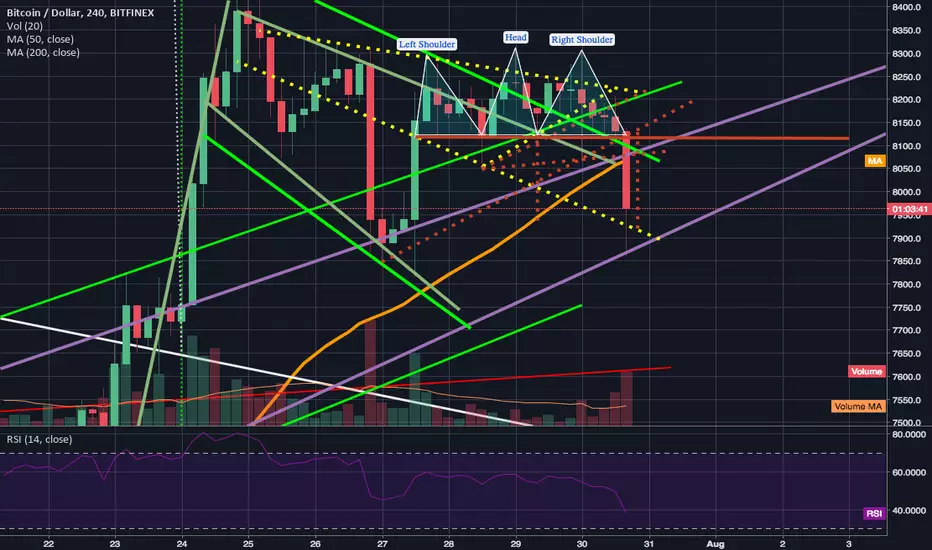
mini 1hr h&s pattern triggers reaches target forms higher lowI wouldn't be worried about more downside unless we achieve a lower low...we will have to get below 7800 to do so. until then I will ladder in moderate dip buys. *not financial advice*
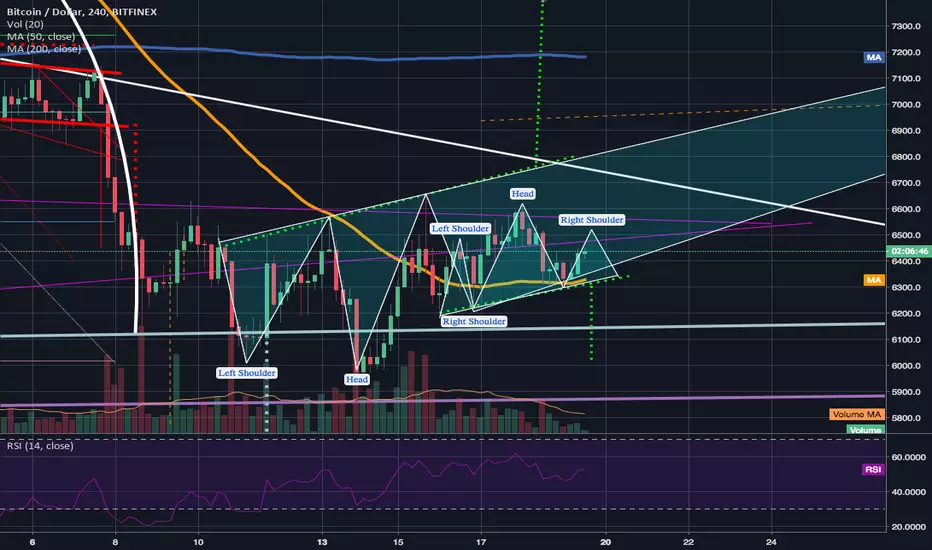
possible inverted head and shoulders inside the flagif the inv h&s is legit we have tested the neckline a few times a break of the necklien hsould help get us up out of the flag for good. Left shoulder is iffy but the rest looks legit.