YM Day Trade and Swing Trade (Setup Range Sell Continuation)For my Monday gameplan:
Downtrend continuation from the Range High to the Range Bottom
Pullback Somewhere in the 50% level
Take out the low from Friday and the 5 bottom liquidity from last Monday- Tuesday
Hit the mid point of the bottom of the range and close the gap from last Monday
Daytrade:

OHLC Statistical Mapping-manipulation got my attention when I am bullish and I targeted -Distribution. Simple bread & butter model on YM which presents nearly every day.

Wealth Building Trade Update (Long until 49,000) 25% Spike Down Just providing an update on the status of the market. Now that 40,000 is broken out of, it is on the march towards 50,000 or the 1.25X range expansion. After which the market will make a 25% spike down into the 0.50 level of 37,000 before continuing on the grind to 150,000.
This is all my own pers

Strategic Insights: Trading the Dow Jones US30 Amidst Historica**Volatility**
With the Dow Jones US30 index currently sitting at all-time highs, traders are closely monitoring potential movements and preparing strategies to navigate the market's next steps. The trend remains bullish, but the formation of a new demand area around the 40,150 mark introduces intri

YM - Still ChoppyMassive diversion between YM and ES, NQ.
Sell stops has been taken gibing YM a good leg to stand on if we were to shoot to 39,800 and possibly target the 39,999 buyside liquidity

Dow Jones Futures Daily Pullback Buy SetUp Wealth Building TradeI will be placing a buy order as soon as Sunday Opens for a pullback on the daily chart. I will be placing my stop loss UNDER 2024's open price marked as the fat Cyan line as I don't believe price will return down there.
I will be going for the throat on this trade and will be adding all the way u

Week of FOMC Bullish Continuation of Range Running HighsI anticipate next week of July FOMC to be a bullish week to run the highs inside this range.
I will be Day trading off of the 15-minute chart using the 4 hours as my structure. I will only be looking for buys.
Of course, seeing how this is a range, it could also just as easily sell back down int

YM - You Know I Like My Low Hanging Fruits.Got my sights dialled into $40,442 as YM, in comparison with ES and NQ is late to the game.
What game you might ask?
The game of savaging sellers!

Sell Opportunity on E-mini Dow Jones (5$)Hello,
We've identified a huge current opportunity to Sell E-mini Dow Jones (5$) Futures with a high probability in the Daily chart.
The target is set at 40000$ first and 39800$ Second within a few days (Swing trade).
Ibrouri

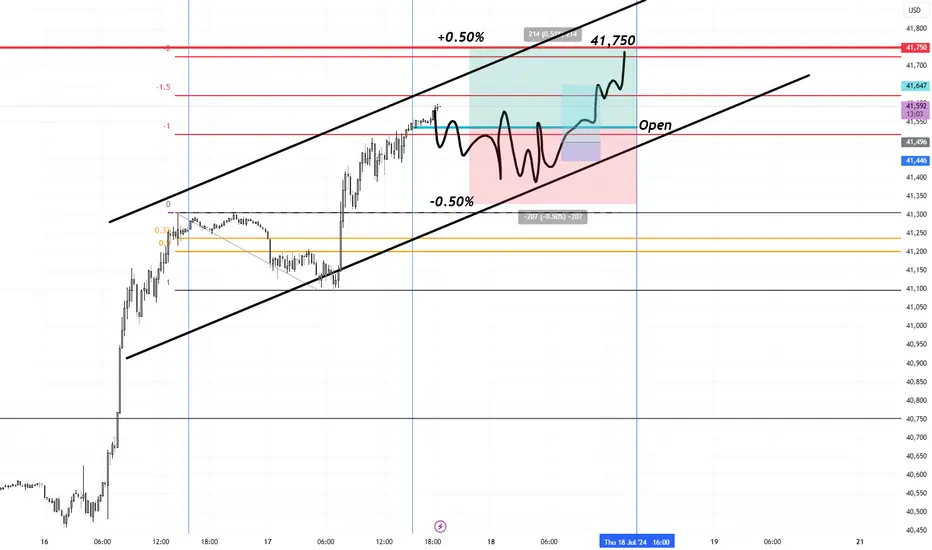
Dow Jones Futures Daytrading Setup Continuation Long 41,750I am looking for a pullback Long for the continuation up to 41,750 which is around the 2X range expansion. A somewhat of a repeat of yesterday. A dip below the open followed by Long at the NY open.
I will have to see how price is behaving towards the NY open.
My stops are always 50 ticks and my t
See all ideas
A representation of what an asset is worth today and what the market thinks it will be worth in the future.
Trade directly on the supercharts through our supported, fully-verified and user-reviewed brokers.


Frequently Asked Questions
The current price of DJIA FUTURES is 40,808 JPY — it has risen 1.26% in the past 24 hours. Watch DJIA FUTURES price in more detail on the chart.
The volume of DJIA FUTURES is 1.60 K. Track more important stats on the DJIA FUTURES chart.
Open interest is the number of contracts held by traders in active positions — they're not closed or expired. For DJIA FUTURES this number is 9.63 K. You can use it to track a prevailing market trend and adjust your own strategy: declining open interest for DJIA FUTURES shows that traders are closing their positions, which means a weakening trend.
Buying or selling futures contracts depends on many factors: season, underlying commodity, your own trading strategy. So mostly it's up to you, but if you look for some certain calculations to take into account, you can study technical analysis for DJIA FUTURES. Today its technical rating is strong buy, but remember that market conditions change all the time, so it's always crucial to do your own research. See more of DJIA FUTURES technicals for a more comprehensive analysis.