“William tell, William tell, Take your arrow, grip it well...And then: ‘A contest! Fun for all! '
Let William shoot his famous bow
At distance great and target small
And by so doing he can show
He need not bow nor ever fall
Upon his face before us all
At last a target did unveil
An apple at one hundred yards
Sir William's face grew ghastly pale
He ne'er suspected such dark cards
The apple sat on Walter Tell
The humble son of William Tell
And fixed the arrow for its flight
'No need to shoot! Just simply bow! '
Said lords who thought they'd won the fight
Against Sir William Tell who now
Should slay his only son; but right
Prevails against the darkest night
The arrow flew, but none could tell
If apple pierced or humble son
Until one or the other fell
Determined contest lost or won
The dart flew like a bat from hell
Toward Walter, son of William Tell
The apple split with such a force
No trace of apple could be found
But all the country changed its course
No longer serfs to lords were bound
And freedom rose upon the shores
Because Sir Tell refused the lords
Appleshort

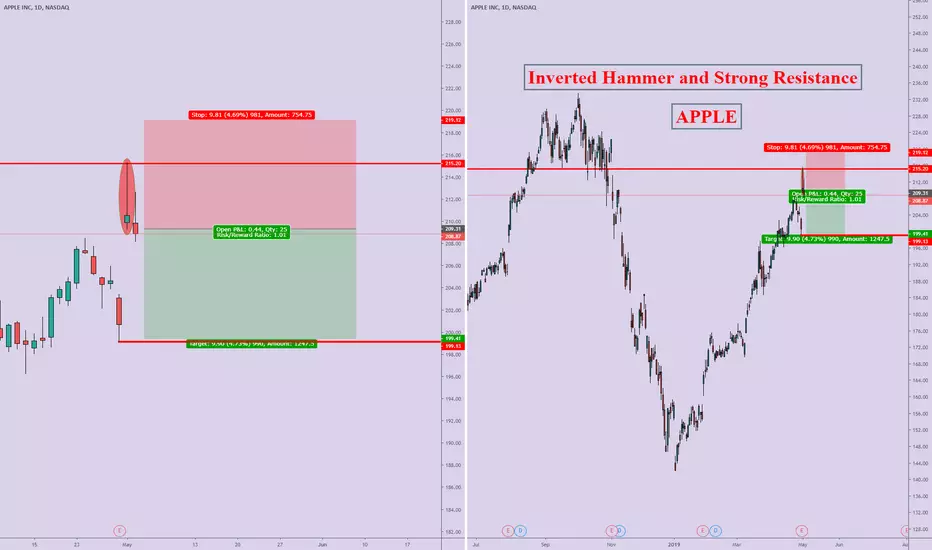
APPLE - SWING TRADEHi, today we are going to talk about APPLE!
In this chart, we observe an excellent opportunity (Time Frame: D1). Details are highlighted above.
Thanks for reading, and have good trades.
Apple Inc (AAPL) Is Already Falling, Crash Ahead! (UK)Apple Inc (AAPL) is already falling and is now trading below EMA10, after breaking it with high volume.
In 2019 AAPL felt below EMA10 twice only to quickly bounce and continue with its uptrend, so what's the difference now?
The first time this happened was back on the 24th January, the second time on the 7th March, each time volume wasn't strong enough. The break we see today below EMA10 is supported by big volume which means that AAPL can continue falling.
On top of the high volume break of EMA10, we also have a very strong and nasty bearish divergence as a well as a rising wedge pattern (purple line).
All of the above signals are telling us that Apple Inc can go lower, in fact, if it breaks below EMA100 (blue line), AAPL is very likely to break below the low that was hit on the 3rd Jan.
Conditions for change: If AAPL breaks above EMA10, some of these signals become invalid. If AAPL breaks above 208.29 with good strength and volume, then the entire analysis above becomes invalidated and a new one is needed. For now, AAPL is bearish and going down.
This is not financial advice. All information here is shared for entertainment and educational purpose only, trade at your own risk.
And remember to hit like of course... If you want to.
Namaste.


ShortA great high probability short term setup on AAPL. The ending diagonal with divergence marks the end of A-B-C correction or alt 5 wave impulse.


RECESSION is coming, run for the APPLE trees.Price is currently at strong resistance, we can only see a bearish move possible to our red resistance zone in the next few weeks.
This is due to the state of the US economy and the weakening strength of the stock market, the stock markets are in a bearish mood this week and this is because people are starting too get scared and realise what a mess Trump is causing.
A recession is just around the corner and when people have no money they cant spend it on fancy gadgets, the only apples they will be buying are the ones that grow on trees ;p

APPLE - THE FALL IS INEVITABLELook at this chart historically. In the falling of 2012-2013, and 2015-2016 you can see regularities. First of all, the price always back at the support line continuing from 2008 (green support line), secondly MA50 always goes down after previous peak at lest 1 year (look at this chart). I expect either long flat to $152 or strong move down to $145. Anyway, we will move down.

APPLE INC. EW Analysis.Catch the dip @ 38.2%/50%/61.8% retracement points.
261.8% target remains a possibility but seems less likely for bullish target, 425% seems more likely.
Goodluck

AAPLAAPL
I normally do not do stock TA but will from request.
I believe we will see $93-$100 AAPL. All of the green lines are the support lines. You can trade these accordingly. I will be coming back to this in the future.

WHY I BOUGHT APPLE STOCKS WITHOUT OWNING ANY APPLE PRODUCTS1. Price action has shown a bounce off good weekly structure support.
2. 0.618 FIBB levels aligns with structure as well.
3. 200 Day moving averages on the weekly aligns as well with structure.
4. Good risk reward
5. RSI Bullish divergence on daily chart and oversold conditions.
* The high confluence of indicators and price actions gives us enough confidence for a swing trade for apple stock. Cheers do let me know what you think!
Check out the youtube: youtu.be


AAPL - Apple stocks fall 125-135$NEWS: Apple the first time it has issued one since 2002
drop of -9.96%


AAPL analysisHanging man spotted,
Expect it to go to 170 level,
If the price level falls below that, expect to go to 164-165 level.
This is not a financial/trading advice
cryptovan168


AAPL beware... could sink.Buy Green
Sell Red
//
it's mainly for swing trading, i use the 3 day / 15 day / monthly charts with it and it works perfectly,
//
it works good for stocks and cryptocurrency.
//
you will use heiken ashi chart style and turn on the EMA DOTS indicator.
once the indicator is on you will hide the heiken ashi so you only see the dots.
//
when a green dot -0.78% -6.68% -7.44% -7.44% appears you buy, if a green dot -0.78% -6.68% -7.44% -7.44% appears after that green dot -0.78% -6.68% -7.44% -7.44% you hold your investment.
if a red dot appears you sell your position. easy as that.
//
the standard dots setting will be set to 10 - use this for any chart above 3 days
change the dots setting to 6 for 3day charts and below
//
shorter time frames will be choppy.
//
larger time frames will be smooth.
//
*Daytrading smaller timeframes is possible but not recommended.

CATCHING ANOTHER BOTTOM THIS TIME APPLE?I believe we hit the bottom at 198 USD
The ABC correction down is finished touching the 1.272 fib at 198 USD.
RSI is already turning up, on the lower timeframes, daily is about to follow.
Also we have a triple bottom on the RSI, on daily.
Target is the previous resistance at 230 USD.

AAPL Apple Breaks Neckline - Sell- Apple breaks neckline
- Potential supports labeled below
- Definitely doesn't look pretty...
Should be interesting to see where it falls too
- Sell Stop - 210.00

Why I'm Selling Apple - Short Signal- Apple breaks neckline support
- Potential supports labeled below
- Definitely does not look pretty...
Will be interesting to see if it continues to fall!
- Be cautious of upcoming US elections
Stop Loss / Sell:
- 210.00


AppleCalled the apple top, to this support, Im expecting this support to break, if you like Divergence, we got a massive divergence formed on the DJI / apple as well. Apple just came out with their new upgrade to a phone buy the rumor sell the news type deal with this one mirroring T.A. Expecting a retest of major support. Use as much Leverage if you like or not much at all. Not trying to top fish at all, just noticing a big rollover happening.
NASDAQ:AAPL : Hope you guys stay safe out there, worst time to be buying stocks atm.
