What Is the ARIMA Prediction Model?What Is the ARIMA Prediction Model?
ARIMA (autoregressive integrated moving average) is a statistical model used to analyse time series data, making it a popular tool in financial markets. Traders apply ARIMA to assess historical price trends and identify structured patterns in market movements. This article explains how ARIMA works, its strengths and limitations, and how it can be integrated into trading strategies for a deeper analysis of price behaviour across different assets.
Understanding ARIMA
ARIMA stands for autoregressive integrated moving average, a widely used model for analysing time series data. It’s particularly useful in financial markets because it helps traders break down price movements into patterns based on historical data. To understand how ARIMA works, it’s important to look at its three components:
- Autoregressive (AR): This part captures the relationship between a current value and its past values. For example, if the price of an asset today is influenced by its price over the last few days, that’s an autoregressive process.
- Integrated (I): Many financial time series exhibit trends, making them non-stationary (meaning their statistical properties change over time). ARIMA “integrates” the data by differencing it—subtracting past values from current ones—to make it more stable for analysis.
- Moving Average (MA): Instead of focusing on past prices, this component looks at past errors—how much previous values deviated from expected trends—to refine the analysis.
Each ARIMA model is defined by three parameters: p (AR order), d (number of differences), and q (MA order). Selecting these values requires statistical tests, autocorrelation analysis, and model evaluation methods like the Akaike Information Criterion (AIC).
In practice, ARIMA modelling is often used in trading to analyse historical price trends and identify repeating patterns.
How ARIMA Works in Market Analysis
Applying ARIMA to financial markets involves a structured process that helps traders analyse price movements based on historical patterns. Since markets generate continuous time series data—such as stock prices, forex rates, and commodity values—ARIMA can be used to extract meaningful trends from past performance. However, applying ARIMA to a time series isn’t done blindly; there are key steps analysts follow to try to improve its effectiveness.
1. Checking for Stationarity
Most raw financial data isn’t stationary—it often trends upwards or downwards over time. ARIMA requires stationarity, meaning that statistical properties like mean and variance remain constant. Traders test for this using the Augmented Dickey-Fuller (ADF) test. If the data is non-stationary, differencing (subtracting previous values from current values) is applied until stationarity is achieved.
2. Identifying AR and MA Components
Once the data is stationary, traders determine how much past price data (AR) and past errors (MA) influence current values. This is done using Autocorrelation Functions (ACF) and Partial Autocorrelation Functions (PACF):
- ACF measures how strongly past values are correlated with present values.
- PACF isolates the direct relationship between a value and its past lags, ignoring indirect effects.
These tools help traders estimate the AR (p) and MA (q) components of the model.
3. Selecting the Right Parameters
Choosing the right values is crucial, and traders often rely on criteria like the Akaike Information Criterion (AIC) or Bayesian Information Criterion (BIC) to compare different model variations and select the best fit.
4. Applying ARIMA to Market Data
Once the parameters are set, the ARIMA model is trained on historical price data. It analyses past relationships between price movements, smoothing out noise and detecting underlying trends. While traders can use ARIMA forecasting to assess potential market direction, it is usually combined with volatility analysis, technical indicators, and macroeconomic factors to provide a more complete picture of market conditions.
Applying ARIMA to Trading Strategies
Traders use ARIMA to analyse historical price data and assess potential trends. Moreover, it’s often combined with technical indicators and other market factors to refine trading strategies. The key is understanding where ARIMA fits in the bigger picture of market analysis.
1. Identifying Trend Continuations and Reversals
ARIMA helps traders assess whether an asset’s price movement follows a structured pattern over time. By analysing past relationships between prices, the model provides insights into whether an upward or downward trend has statistical momentum or if recent price action is deviating from historical patterns.
For example, a trader analysing a currency pair might use ARIMA to assess whether the recent upward trend aligns with historical movements or if past patterns suggest a shift in direction. While ARIMA doesn’t account for sudden market shocks, it can potentially highlight whether recent price action aligns with established statistical trends.
2. Evaluating Market Volatility
Price trends alone don’t tell the full story—volatility plays a major role in how assets move. Traders sometimes apply ARIMA to historical volatility data to assess how price swings have evolved over time. This can be useful when comparing different assets or assessing how external events impact volatility patterns.
For instance, if ARIMA analysis suggests that a stock’s volatility has been steadily increasing over several weeks, traders may adjust their position sizing or incorporate additional risk control.
3. Combining ARIMA with Technical Indicators
Historical price relationships are the primary focus with ARIMA, meaning traders often pair it with moving averages, Relative Strength Index, or Bollinger Bands to refine their analysis. If ARIMA suggests a continuation of a trend and this aligns with a moving average crossover or RSI strength, it can add confidence to a trading decision.
Institutional traders and hedge funds use ARIMA in systematic trading models, often integrating it with machine learning or fundamental data. While traders may not rely on ARIMA as their primary tool, incorporating it into a broader strategy may help assess market structure, historical price relationships, and potential trend shifts, especially when used alongside other forms of analysis.
Strengths and Limitations of ARIMA Models in Trading
Although ARIMA is widely used in financial market analysis, like any analytical tool, it has strengths and limitations that traders should be aware of.
Strengths of ARIMA in Trading
Captures Historical Relationships Well
ARIMA is particularly popular at analysing price trends that follow consistent patterns over time. If an asset’s price movements show a clear relationship with its past values, ARIMA can help quantify these patterns and provide a structured analysis of potential market direction.
Useful for Short- to Medium-Term Analysis
While some statistical models focus on high-frequency data or long-term macro trends, ARIMA sits comfortably in the middle. It works well for daily, weekly, or monthly price analysis, making it useful for traders who look at trends over these timeframes.
Well-Established and Interpretable
Unlike complex machine learning models, an ARIMA forecast is straightforward in its assumptions. Traders can understand why a model is generating certain outputs, as ARIMA is based on clear mathematical relationships rather than black-box algorithms.
Applicable to Different Market Data
ARIMA isn’t restricted to just price movements—it can be used to analyse volatility, trading volume, and macroeconomic indicators, making it a flexible tool for different types of market assessments.
Limitations of ARIMA in Trading
Assumes Linear Relationships
ARIMA is used when price movements follow a linear structure, meaning past values have a direct and proportional effect on future movements. However, markets often experience sharp reversals, liquidity shocks, and external events that don’t fit neatly into this assumption.
Requires Stationarity
Many financial assets exhibit non-stationary behaviour—meaning their statistical properties change over time. ARIMA requires differencing to adjust for trends, but in some cases, even after differencing, the data still doesn’t meet stationarity requirements.
Computationally Intensive for Large Datasets
While ARIMA is widely used in trading, its calculations become more demanding as the dataset grows. For traders dealing with high-frequency or multi-asset strategies, ARIMA may require significant computational resources, making alternative models like machine learning-based approaches more practical.
The Bottom Line
ARIMA is a valuable tool for analysing historical price trends and assessing potential market movements. While it has limitations, traders often use it alongside technical indicators and volatility analysis to refine their strategies.
FAQ
What Is an ARIMA Model?
ARIMA (autoregressive integrated moving average) is a statistical model used to analyse time series data. It identifies patterns in historical values using three components: autoregression (AR), differencing (I) to make data stationary, and moving averages (MA). Traders apply ARIMA to assess market trends based on past price movements.
Is ARIMA Still Used in Market Analysis?
Yes, ARIMA remains widely used in financial and economic analysis. While newer machine learning models have gained popularity, ARIMA is still valuable for structured time series data, particularly in short- to medium-term market analysis.
What Is the Most Popular ARIMA Model?
There is no single most popular ARIMA model—it all depends on the dataset. The model is selected based on statistical criteria like the Akaike Information Criterion (AIC), which helps determine the optimal combination of AR, I, and MA components.
How to Determine P, D, and Q in an ARIMA Model?
The ARIMA p, d, and q values are determined through statistical tests. The Augmented Dickey-Fuller (ADF) test checks for stationarity (d), while autocorrelation and partial autocorrelation functions help identify p (AR terms) and q (MA terms).
This article represents the opinion of the Companies operating under the FXOpen brand only. It is not to be construed as an offer, solicitation, or recommendation with respect to products and services provided by the Companies operating under the FXOpen brand, nor is it to be considered financial advice.
Arima
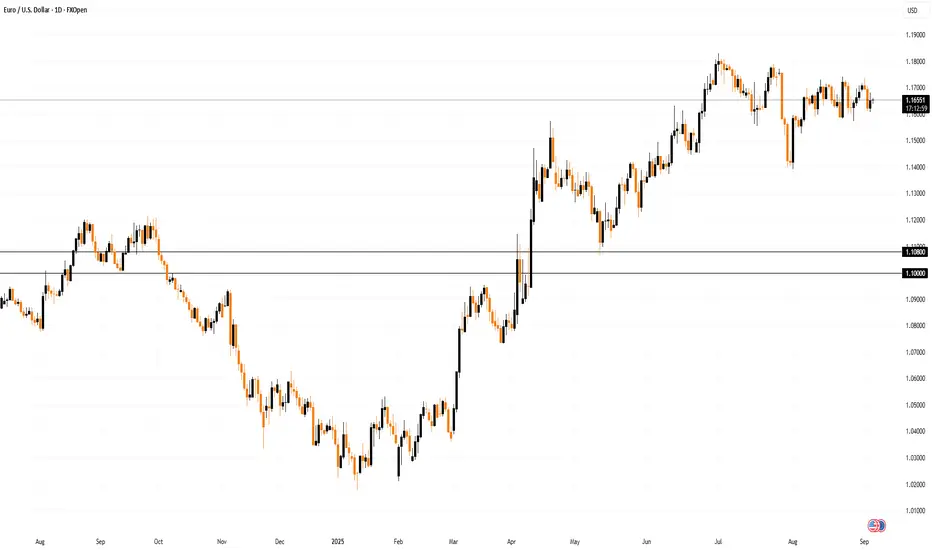
USD/JPY Analysis: Fundamental and Technical Outlook FX:USDJPY The recent price action in USD/JPY, characterized by a significant break through the upper pitchfork boundary with substantial momentum and volume, suggests an important moment for the currency pair. This technical development aligns with several fundamental factors influencing both the U.S. dollar and the Japanese yen.
Technical Analysis:
Breakout Confirmation: The breach of the upper pitchfork boundary indicates strong bullish momentum. However, to validate this move, it's essential to observe whether the price can sustain above this level or if it will retest and potentially fall back into the previous channel.
Key Support and Resistance Levels:
Support: The 150 level serves as a critical support. A decline below this threshold could signal a return to the long-term consolidation range between 80 and 150, which persisted for 27 years prior to 2022.
Resistance: If the price reclaims the upper channel, we may see the continuation of the uptrend with huge momentum.
Fundamental Analysis:
Bank of Japan Hawkish Stance: The BOJ has recently adopted a more hawkish tone, hinting at potential policy tightening. Governor Kazuo Ueda has indicated progress toward sustained wage-driven inflation, suggesting that interest rate hikes could be on the horizon.
Japanese Intervention: Japan’s Finance Minister has expressed concerns over excessive yen depreciation, hinting at possible intervention if the yen weakens too much. This stance aims to prevent the yen from falling to levels that could harm the economy by increasing import costs.
Federal Reserve's (Fed) Dovish Shift: In contrast, the U.S. Federal Reserve appears to be concerned with the current economical development, especially about the unemployment level, with discussions around more potential rate cuts emerging. This dovish outlook is influenced by concerns over rising U.S. debt levels and a slowing economy.
U.S. Debt: The U.S. is grappling with escalating debt, with the debt-to-GDP ratio nearing 100%. This situation is reminiscent of the economic conditions preceding the DotCom Bubble from 2000, raising concerns about potential economic instability. Not mentioning that the US credit card debt is record high.
More to read about this:
nypost.com
www.wsj.com
www.marketwatch.com
www.cnbc.com
Outlook:
The convergence of these technical and fundamental factors suggests that USD/JPY may not revisit recent highs in the near term. Instead, the pair could stabilize within the 140-150 range as the market seeks equilibrium amid contrasting monetary policies and economic conditions in the U.S. and Japan.
Risk Management:
Given the inherent volatility and unpredictability of forex markets, it's crucial to implement robust risk management strategies. Market dynamics can shift rapidly, and while current analyses provide a framework, they are not guarantees of future performance. Always conduct thorough research and remain adaptable to changing market conditions.
Disclaimer: This analysis is for informational purposes only and does not constitute financial advice. Always perform your own analysis before making trading decisions.

All about ARIMA Modeling ARIMA or ARIMA modelling, is a quantitative approach to stock price and volatility projection commonly used to MMs and other big financial institutions.
Its interesting because if you use implied moves from options, 99% of the time the implied move on options correspond to my own ARIMA and linear models, which is just a dead give away of how the MMs are calculating these things.
So what we will cover in this idea is:
a) What is it?
b) What can it do?
c) How its done? and
d) How you can do it.
So let's get into it!
Firstly, What is it?
ARIMA stands for AutoRegressive Integrated Moving Average. It is a model that is based in time series forecasting methods and is commonly used in statistics and econometrics. It combines auto-regression (AR), differencing (I for integrated), and moving averages (MA) to capture and predict trends and patterns in time-series data.
Autoregressive Component: The autoregressive component of ARIMA models the relationship between a data point and its past values. For example, it will take sequential close prices and calculate the difference between each sequential close price.
NOTE: IF you are interested in the concept of autoregression, check out my autoregressive cloud indicator which has a corresponding video that elaborates on the concept of autoregression and its use in stocks and trading, available here .
Differencing: The I component represents differencing to make the series stationary. Essentially, differencing involves taking the difference between consecutive data points in a time series. It aims to make the time series stationary by removing trends and seasonality, which simplifies the modeling process and allows for more accurate forecasts using auto-regression and moving average components.
Moving average: The MA component accounts for the influence of past forecast errors. ARIMA models are widely used for tasks such as financial market analysis, economic forecasting, and various other applications where historical data trends need to be analyzed and future values predicted.
What can it do?
So, the logical question is what can it do?
The most notable and practical application of ARIMA modelling is predicting stock price. As an example, below is an example of my own ARIMA model and its prediction of the likely close prices between October 16, through till October 20th, and the actual close prices which resulted for the ETF AMEX:SPY :
You can see that ARIMA accurately predicted the confines of our trading range for the week and despite the volatility and whipsaw, we took out the first ARIMA predicted low target on the week, but managed to remain confined within the ARIMA model parameters.
So how can you use this?
I am not sure if you were able to put 2 and 2 together from what I just shared, but if not, that is fine, I will be more obvious in my explanation.
A well tuned and created ARIMA model is generally able to accurately predict the trading ranges and max/min values on most indices. Meaning that, indices are likely to quite reliability remain confined within the ARIMA predicted range (note that I emphasize indices here because the same is not true for regular stocks that respond more dramatically to catalysts and events).
This explains why its a popular go to tool for MMs, because you can effectively use ARIMA to set your confine parameters of max and min ranges, then proceed to sell options outside this range, with the anticipation of the likelihood they are going to expire worthless.
In the example above, the bottom of the weekly ARIMA predicted range was 418. So as the stock tanked, it would have been pretty lucrative to sell a put option with a 418, Friday expiry into the tank, knowing that it was statistically unlikely for SPY to close at or below this level.
What about its use for speculative buyers?
So if you are a speculative buyer like me and most retail, the benefits of ARIMA modelling are more indirect. First of all, it empowers us to know what the MMs are likely anticipating.
Second of all, it helps us to ascertain the likely trading range on the week and can help us determine when we are outside of an anticipated range.
While I don't rely personally on ARIMA trading ranges, because as we see, a well tuned ARIMA model is more likely to show us where we aren't going than where we are going (by accurately predicting the absolute top and bottom for a designated period), I do use it to take advantage of its ability to determine these absolute tops and bottoms for a defined period of time.
Let's take a look at the ARIMA results from Oct 18 - the 22nd, during the FOMC announcements:
While it came close, the range did manage to remain confined to the absolute top and absolute bottom predicted in the ARIMA range.
🎯 Application Tip 🎯
Now that we covered what it can do, let's take a quick second to go over the key concepts for application.
ARIMA Can be used for:
Determining the likely absolute top and absolute bottom of a trading range.
Can help traders to know when would be more appropriate to get long (i.e. approaching the absolute bottom of the range) and when to get short (approaching the absolute top of the range).
Gives traders insight to what MMs are likely considering in their positioning into the week.
Helps us determine if we are over-extended, either over or under an anticipated trading range.
How its done?
Alright, time to get into the technical details.
ARIMA is calculated through a series of steps.
Step #1: As explained earlier, differencing is applied to the time series data to make it stationary, removing trends and seasonality.
Step #2: Auto-regression and moving average parameters are determined by analyzing the autocorrelation and partial autocorrelation functions. Once the model order (p, d, q) is established, ARIMA performs a forecast by regressing future values on past observations, incorporating the model's parameters.
Note on Model Order:
Model order simply refers to the selection of appropriate values to determine the p, d, q, order. The p, d, q, refers to:
Certainly! In the context of ARIMA modeling, p, d, and q are key components that define the model's order.
p: Or Auto-Regressive Order. This represents the number of lag terms (past observations) used in the auto-regression component. It reflects the degree of influence of past values on the current one. A higher p means the model considers more past data.
d: Or Integrated Order. This is the differencing component, representing the number of times differencing is applied to make the time series stationary. Differencing removes trends and seasonality from the data.
q: Or Moving Average Order.. This indicates the number of lag terms used in the moving average component, which captures the relationship between past forecast errors and the current observation. A higher q implies that more past errors are considered in the model.
Alright, now that, that's out of the way, the final steps involve:
Choosing appropriate values for p, d, and q involves analyzing the autocorrelation and partial autocorrelation functions of the time series data. These components play a crucial role in shaping the behavior of the ARIMA model and determining its forecasting accuracy.
The values we look at to determine their appropriateness includes the statistical significance (R) value, the R2 value and, sometimes, the effect size value.
After all of that, we then evaluate model's through back-testing and the process may involve iterating and fine-tuning to optimize forecasts for time series data.
Its important to know, advanced Software like R and SPSS (And to a lesser extend, Excel) are capable of sorting the data automatically and will do these steps for you. However, its important that you don't accept the auto parameters without first back-testing and making adjustments accordingly.
Now that we have looked at how it is done, let's look at the key concepts to takeaway below.
🎯Application Tips 🎯
ARIMA is calculated by organizing p, d, q.
Determining the variables and arrangement of p, d, q is accomplished through the use of the R and R2 value as well as the statistical significance between variables.
Most advanced packages, including Excel and SPSS, will auto-fit ARIMA model which is not always sufficient, sometimes some manual tweaking is important. Thus:
Once a model is built, it should be back-tested to ensure efficacy and accuracy.
How can it be done?
Basic ARIMA modelling is not as difficult as you expect. It can be done through most statistical software, including:
Excel (Paid)
SPSS (Paid)
SAS (Paid)
R (Free)
Pinescript (Free)
Additionally, in my own push to create statistics based indicators and bring advanced functions to Pinescript, you can use my own, publically accessible and free indicator in Pinescript, hence why I have added it.
I have used SPSS, R and Excel to do ARIMA, but for brevity I am not going to go over how to do it step by step in this post. You can look at some of my other content or Google these functions based on which software you have access to. But assuming you have access to Pinescript and Tradingview, as you are reading this post, we will quickly go over the Pinescript version I have created.
If we launch that indicator called SPTS (statistical package for the trading sciences, available here ) and plot an ARIMA model from our October low till now on SPX, this is what we get:
Now, you will see that the range is a bit different from what perhaps we would expect from Excel or SPSS. The reason being is the way this indicator approaches differencing. If you remember, a way to difference is by using moving averages. Moving averages difference the data by removing elements of seasonality, but it doesn't quite remove the trend completely.
As such, we can expect to "pop out" of the range a bit more frequently then using an ARIMA model on, say, Excel. However, this is helpful to offer us insight into when a may be operating in an "over-extended" state, either to the upside or to the downside.
If you are using SPTS to determine the trading range, here are the preferred settings for ARIMA modelling:
Set the desired variable to close, switch from EMA to SMA and set the forecast to between 50, 100, 150 or 200 bars into the future.
This is a helpful, quick way to plot ARIMA like parameters, though I have to honestly say, nothing beats creating your own, customized ARIMA model in R, Excel or SPSS, or your own Pinescript coded indicator specifically set to your specific ARIMA parameters.
If you are interested in a more in-depth tutorial on how to either use Pinescript to build an ARIMA model or use one of the softwares mentioned above to build an ARIMA model, leave a comment and it can likely be a future idea on here.
Now that we covered how to do it, let's recap the key points from this section.
🎯Application tips: 🎯
ARIMA can be accomplished through using Excel, SPSS, R, SAS or Pinescript.
If using Pinescript, currently the only indicator I have been able to locate to perform basic ARIMA functionality is my own, that indicator is called SPTS and is listed on the indicator menu but linked above for ease of access.
And that concludes today's lesson on ARIMA modelling!
Hope you enjoyed and leave your questions and comments below!
Take care and safe trades everyone!

Accumulate BTC on the spot, but not futures (AI)Hi crypto's! ,
Are you all subscribed to hundreds of cryptocurrency channels and still don’t understand how to make money?
We are very sorry :)
Just check my video, make note (important!) and overthink an information.
We are not sure about the long in current conditions, but still accumulate on the spot.
Enjoy! Here we post interesting videos that will entertain you while you eat something delicious.
EasyHex team🤘

USD/JPY down to 108.4 and past according to my ARIMA ML modelpasteboard.co I have used the presented leading drivers from the book "The art of currency trading" by Brent Donnelly to build an ARIMA machine learning model, using the us 2y 5y and 10y bond interest rates as well as gold, spx and nikkei225 to build the model, i had entered at 108.848 and set my take profit for 108.4, went to sleep had i been awake i would have taken profit when the market nearly touched this mark, the median line for the regression model is at 108.25 area, according to price action i believe this looks like a retest before going back down.
#superquanttrader
picture of my model in the link above! as you can see the market as respected this regression predictor fairly well in the past, I am also confident due to the mac d indicator indicating a sell on the 4 hour time frame.
I actually didn't set a stop loss for this trade as I believe it will go to 108.4 much before it hits 111
Fundamental news has bears looking at the 107 area from the article i read on fx street from the us bond market being weaker, which is what this model is partly based on.

BTC bullish until Oct 2021 and bearish until Oct 2022?In my biased view BTC might be somewhat bullish until the autumn of 2021 and than maybe somewhat bearish until the autumn of 2022. That will be the moment when I might consider to entry the game.
My lazy prediction is based on Volume Weighed Moving ALMA with some smooting (white line) and some past data (using bayesian ARIMA approach, but with quite low credible interval), also I calculate ALMA to current price ratio in ln, which might be fully misleading due to few data points, yet it looks like a good analysis, but it is not. So, I might be totally wrong here, but at least I do not have to worry until 2022 autumn.
Share your thoughts!
__
This is NOT a trading advise! (Calculate risk, use stops, avoid FOMO, don't risk more than you can afford to lose, take responsibility.)
