XAU/USD | Gold Holding Strong – More Upside If Support Holds!By analyzing the #Gold chart on the 4H timeframe, we can see that after a pullback, the price climbed again to $4112 before making a small correction. It’s now trading around $4078.
If gold can hold above $4048, we can expect another move to the upside.
The next potential targets are $4106, $4112, $4133, and $4159.
Please support me with your likes and comments to motivate me to share more analysis with you and share your opinion about the possible trend of this chart with me !
Best Regards , Arman Shaban
Arman_shaban

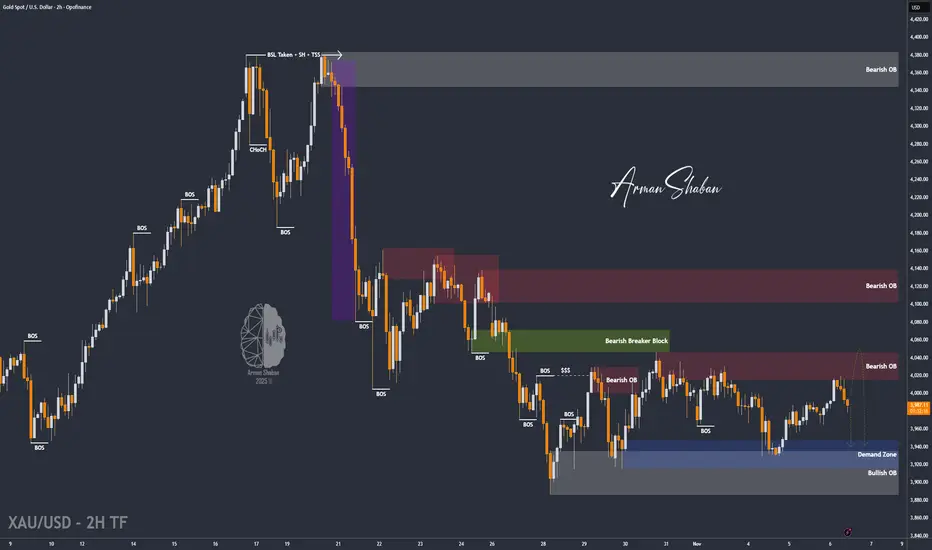
XAU/USD | Watch Gold at $4100 – Pullback or Continuation Ahead?By analyzing the Gold chart on the 2-hour timeframe, we can see that after the last analysis, the price dropped from $3997 to $3984, then quickly found strong demand and started a powerful rally, breaking the $4040 resistance.
At the moment, Gold has reached the $4100 zone. A short-term pullback from this level is likely, but after a brief correction, I expect the uptrend to continue. The next bullish targets are $4140, $4156, and $4162.
Please support me with your likes and comments to motivate me to share more analysis with you and share your opinion about the possible trend of this chart with me !
Best Regards , Arman Shaban

GBP/JPY | GBPJPY Rejects from Supply Zone, Bearish Setup in PlayBy analyzing the GBP/JPY chart on the 4-hour timeframe, we can see that after an initial correction down to 200.315, the price found strong demand and invalidated the initial bearish scenario, climbing back up to the second key supply zone.
Currently, the pair is trading around 202.95, and if it manages to stay below 203, we could see another price correction soon. This analysis will be updated soon.
Please support me with your likes and comments to motivate me to share more analysis with you and share your opinion about the possible trend of this chart with me !
Best Regards , Arman Shaban

GBP/USD | Pound Eyes 1.32 After Breaking Key Level!By analyzing the GBP/USD chart on the 1-hour timeframe, we can see that after climbing to 1.31900, the pair has entered a new bullish scenario and is now trading around 1.31700.
I expect to see a minor pullback first, after which we’ll need to see if the price can hold above 1.31500 — if it does, we can anticipate further upside movement.
The first target for this potential rise is 1.31980.
Please support me with your likes and comments to motivate me to share more analysis with you and share your opinion about the possible trend of this chart with me !
Best Regards , Arman Shaban

XAU/USD | Gold Rejected Again! Mid-Term Target Could Reach $3550By analyzing the Gold chart on the 2-hour timeframe, we can see that after the previous analysis, price started to rise but faced strong selling pressure when it entered the supply zone between $4016 and $4020.
Recently, Gold dropped to around $3978 and is now trading near $3990. The previous analysis remains valid — as long as Gold doesn’t break above $4040, the main scenario is still bearish, and we could even see a deeper correction toward $3550 in the mid-term.
This analysis will be updated soon — stay tuned for some powerful trade setups!
Please support me with your likes and comments to motivate me to share more analysis with you and share your opinion about the possible trend of this chart with me !
Best Regards , Arman Shaban
GBP/USD | Pound Under Pressure – Bearish Reaction Expected!By analyzing the GBP/USD chart on the 1-hour timeframe, we can see that the price is currently trading around 1.3120. The supply zones ahead are 1.3130–1.3143 and 1.3148–1.3163 , where we may expect a bearish reaction once price reaches these levels.
For this scenario to be confirmed, we need a 1-hour candle close below 1.3130. The downside targets are 1.3107, 1.3095, and 1.3084.
Please support me with your likes and comments to motivate me to share more analysis with you and share your opinion about the possible trend of this chart with me !
Best Regards , Arman Shaban

BTC/USDT | BTC Update – Testing the $112K Barrier!By analyzing the #Bitcoin chart on the 12-hour timeframe, we can see that after finding strong support near $103,500 , BTC has continued its recovery and recently reached $111,700 . The key question now is whether the price can break decisively above the $112K resistance zone.
The $103K–$105K range still acts as a major demand area , while the $109K–$112K zone remains short-term resistance . A confirmed breakout above $112K could open the door toward $113,800, $116,000, and $119,600 , while rejection from this zone might trigger another pullback before continuation.
Overall, the structure remains neutral-to-bullish , and volatility is still high — you guys should stay alert for a confirmed breakout before the next big move develops.
Please support me with your likes and comments to motivate me to share more analysis with you and share your opinion about the possible trend of this chart with me !
Best Regards , Arman Shaban

BNB/USDT | BNB Update – Correction After New ATH!By analyzing the #BNB chart on the weekly timeframe, we can see that after reaching a new all-time high at $1,376, BNB entered a healthy correction phase and is now trading around $1,100. Despite this pullback, the structure remains bullish as long as the price holds above $1,050, which currently acts as the key support zone.
If BNB manages to stay above this level, the uptrend could resume, with potential upside targets at $1,300, $1,400, and $1,550 — consistent with previous projections. However, a confirmed break below $1,050 could open the door for a deeper drop toward the $850 region.
For now, bulls still have control, but the next few days will be crucial to confirm whether this correction is just a pause or the start of a deeper retracement.
Please support me with your likes and comments to motivate me to share more analysis with you and share your opinion about the possible trend of this chart with me !
Best Regards , Arman Shaban

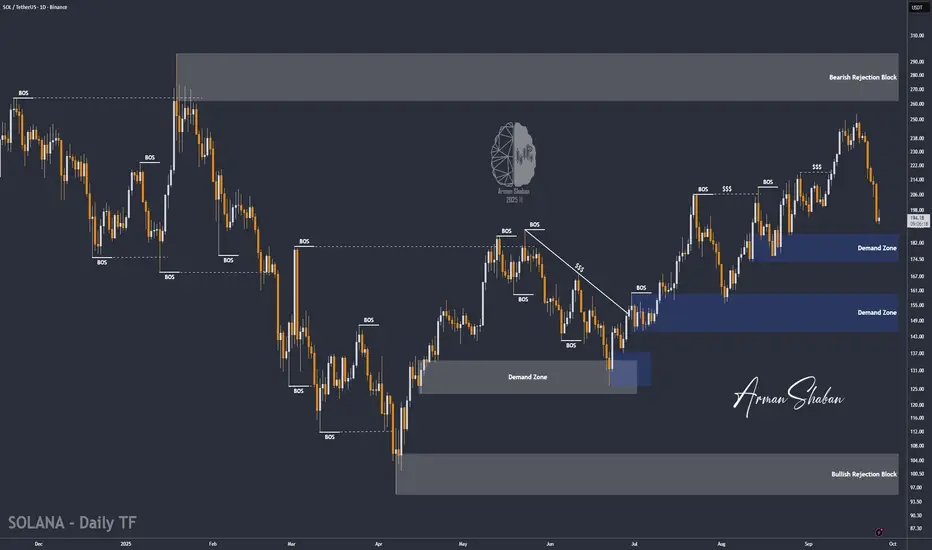
SOL/USDT | Solana Correction Could Spark Rally to $262 (READ)By analyzing the Solana chart on the daily timeframe, we can see that the price has continued its correction and is now trading around $194. As you can see, it’s getting close to the $173–$186 demand zone, and we need to watch whether this zone can trigger new buying pressure.
Personally, I expect a strong reaction from this area. If the price stabilizes here and shows the first signs of growth, the possible upside targets will be $205, $230, $242, $254, and $262.
Please support me with your likes and comments to motivate me to share more analysis with you and share your opinion about the possible trend of this chart with me !
Best Regards , Arman Shaban
XAU/USD | Gold Prints New ATH at $3,685 – Rate Cut Rally Ahead?By analyzing the gold chart on the 1-hour timeframe, we can see that the price broke the key $3,657 level, just as expected, and today it even printed a new ATH at an impressive $3,685! As you know, this week is the interest rate decision week, and markets are preparing for a rate cut — either 0.25% or 0.5%. Each scenario can have a different level of impact: a 0.5% cut could easily push gold above $3,700–$3,740.
Right now, gold is trading around $3,679. As long as it does not break and close below $3,674, we can expect some sideways movement followed by more upside, with the first target at $3,700. However, there’s also an important FVG (Fair Value Gap) between $3,664 and $3,674. If the first scenario fails, gold could sharply drop to fill this gap.
I hope this analysis was helpful for you — stay tuned for more setups based on this outlook!

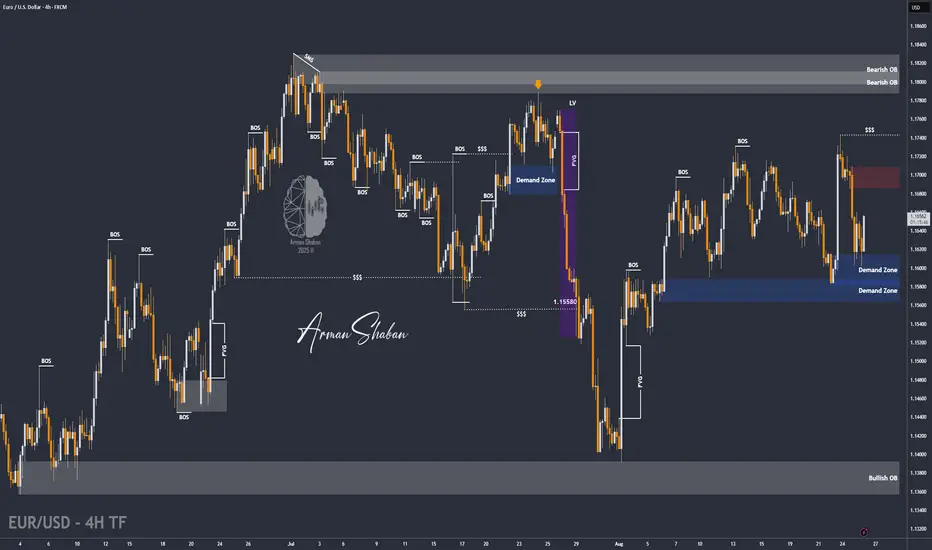
EUR/USD | EUR/USD Holding 1.16 – Eyes on 1.17 Next! (READ)By analyzing the EUR/USD chart on the 4-hour timeframe, we can see that the price is currently trading around 1.165 and has so far managed to hold above the 1.16 support zone. Based on the current trend and momentum, I expect a potential bullish move toward higher levels, with targets above 1.17.
All the key supply and demand zones are marked on the chart, so keep a close eye on the price reaction around these critical levels!
Please support me with your likes and comments to motivate me to share more analysis with you and share your opinion about the possible trend of this chart with me !
Best Regards , Arman Shaban
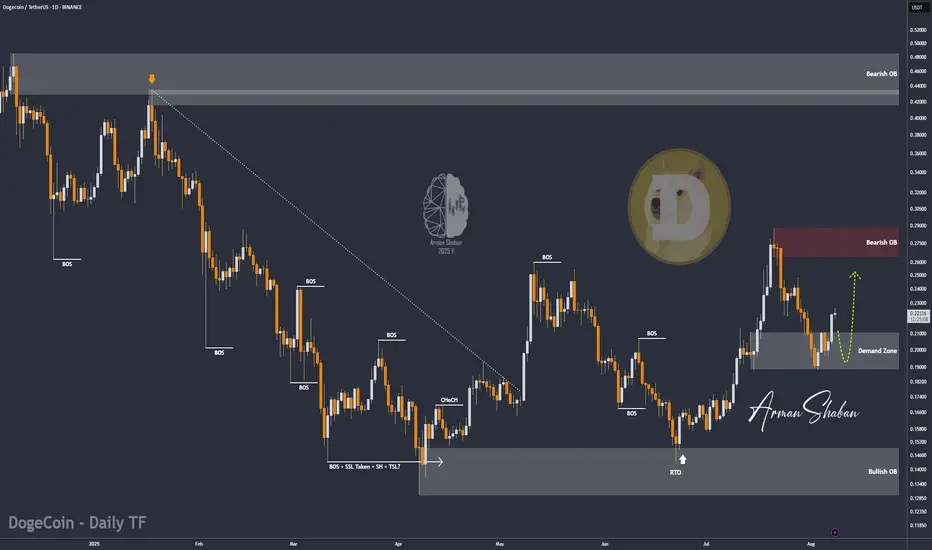
DOGE/USDT | DOGE Up 20% – Next Targets: $0.24, $0.287 & Beyond!By analyzing the Dogecoin chart on the daily timeframe, we can see that, as expected, the bullish reaction has continued, and DOGE is now trading around $0.226. This analysis has delivered over 20% returns so far. The next targets are $0.24, $0.287, $0.32, $0.41, and $0.70. Hope you’ve made the most of this move, and stay tuned for the upcoming updates!
Please support me with your likes and comments to motivate me to share more analysis with you and share your opinion about the possible trend of this chart with me !
Best Regards , Arman Shaban
XAU/USD | Bounce in Play – Watching $3350 Support for Next Move!By analyzing the gold chart on the 4-hour timeframe, we can see that after hitting the first target at $3361, gold continued its rally and reached our second supply level at $3385. Upon reaching this key level, the price faced strong selling pressure, dropping over 350 pips down to $3349. Gold is now trading around $3363, and if it can hold above the $3350 support level, we could expect another bullish push. The next upside targets are $3367, $3375, and $3385. This analysis will be updated in the coming hours with your continued support!
Please support me with your likes and comments to motivate me to share more analysis with you and share your opinion about the possible trend of this chart with me !
Best Regards , Arman Shaban

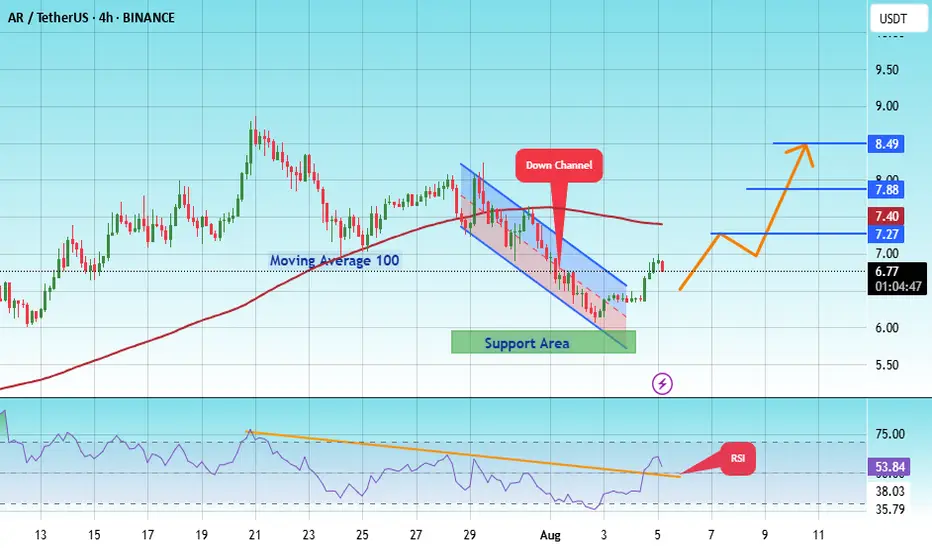
#AR/USDT Gearing Up for a Powerful Wave 3 Launh#AR
The price is moving within an ascending channel on the 1-hour frame, adhering well to it, and is on its way to breaking strongly upwards and retesting it.
We have support from the lower boundary of the ascending channel, at 5.50.
We have a downtrend on the RSI that is about to break and retest, supporting the upside.
There is a major support area in green at 5.90, which represents a strong basis for the upside.
Don't forget a simple thing: ease and capital.
When you reach the first target, save some money and then change your stop-loss order to an entry order.
For inquiries, please leave a comment.
We have a trend to hold above the 100 Moving Average.
Entry price: 6.80.
First target: 7.27.
Second target: 7.88.
Third target: 8.50.
Don't forget a simple thing: ease and capital.
When you reach your first target, save some money and then change your stop-loss order to an entry order.
For inquiries, please leave a comment.
Thank you.
XAU/USD | Watching for Potential Drop Toward $3391! (READ)By analyzing the gold chart on the 4-hour timeframe, we can see that gold continued its bullish move after holding above $3409, successfully hitting the $3440 target and delivering over 200 pips in returns! After reaching this key supply zone, gold corrected down to $3415 and is now trading around $3421. If the price stabilizes below $3431, we can expect further downside movement, with the next bearish targets at $3415, $3404, and $3391. If this scenario fails, an alternative setup will be shared.
Please support me with your likes and comments to motivate me to share more analysis with you and share your opinion about the possible trend of this chart with me !
Best Regards , Arman Shaban

XAU/USD | Get Ready for Another Bullrun, $3500 is Coming!By analyzing the gold chart on the 4-hour timeframe, we can see that on Friday, the price finally closed at $3350. After the market opened today, we saw an initial correction down to $3339 (exactly as expected), followed by another strong bullish wave, pushing gold above $3400 just moments ago. If the price stabilizes below $3398 within the next 4 hours, I expect a potential rejection toward $3388 and $3377. However, if gold holds above $3400, the next target will be $3409. Key demand zones are $3365–$3375, and levels $3355, $3344, and $3336.
Please support me with your likes and comments to motivate me to share more analysis with you and share your opinion about the possible trend of this chart with me !
Best Regards , Arman Shaban

GOLD Set for Big Move? | Key Zones + CPI Impact Explained !Gold Analysis – Key Levels + CPI Outlook!
In this video, I broke down the recent rejection from the $3366–$3369 resistance zone, the drop to $3346, and current price action around $3357.
We’ll also look ahead at what to expect with the upcoming CPI report — and how it could shape gold’s next big move.
📌 I’ve covered both bullish and bearish scenarios, shared key demand/supply zones, and outlined possible targets.
👉 For full context and trading strategy, make sure to watch the video till the end — and don’t forget to drop your opinion in the comments:
Do you think gold will break $3380 next, or are we headed for another pullback?
THE MAIN ANALYSIS :

BTC/USD: More Bullish MOVE Ahead? (READ THE CAPTION)By analyzing the #Bitcoin chart on the weekly timeframe, we can see that the price has finally reached our expected level of $111,880, setting a new all-time high.
Currently, Bitcoin is trading around $110,800, and if it manages to hold above this key level, we could expect further bullish movement.
The next potential targets are $130,000 and $163,000, respectively.
Please support me with your likes and comments to motivate me to share more analysis with you and share your opinion about the possible trend of this chart with me !
Best Regards , Arman Shaban

GBP/USD : Ready for Fall (READ THE CAPTION)By examining the GBP/USD chart on the 4-hour timeframe, we can see that the price is currently trading within the 1.35 supply zone. If a strong rejection occurs from this level, we can expect further downside movement. The potential bearish targets are 1.34915 and 1.34500. Other key supply zones are located at 1.35520, 1.35730, and 1.35930.
Please support me with your likes and comments to motivate me to share more analysis with you and share your opinion about the possible trend of this chart with me !
Best Regards , Arman Shaban

Gold at Key Rejection Zone: Will the Drop Resume from $3310?By examining the gold chart on the 4-hour timeframe, we can see that after some consolidation between $3294 and $3302, the price finally began a sharp drop, correcting down to $3245. This area was a key demand zone on lower timeframes, which triggered a rebound, and gold is now trading around $3310. If the price gets rejected from the $3310–$3313 zone, we can expect another potential decline.
Please support me with your likes and comments to motivate me to share more analysis with you and share your opinion about the possible trend of this chart with me !
Best Regards , Arman Shaban

XAU/USD: Gold Eyes $3400+ After Explosive Surge! (READ CAPTION)By analyzing the gold chart on the 1-hour timeframe, we can see that price once again hit our targets! As expected, gold had a strong bullish rally yesterday and today, reaching both $3328 and $3345, and even extending to $3387.
This surge was fueled by escalating tensions in the Middle East, particularly between Israel and Yemen. Since the conflict shows no signs of easing and further threats remain on the table, I believe gold is not done yet — we may soon see it push above $3400.
These are sensitive days, so please be extra cautious with your trades. Don’t let fear or greed take over — consistency and emotional stability are key to long-term success in this market.
I’ll continue posting more frequent updates to help you stay informed — but that depends on your strong support! Let’s keep growing together!
Please support me with your likes and comments to motivate me to share more analysis with you and share your opinion about the possible trend of this chart with me !
Best Regards , Arman Shaban

USD/JPY : Bull or Bear? Let's See! (READ THE CAPTION)Upon reviewing the USD/JPY chart on the daily timeframe, we observe that due to the sharp drop in the Dollar Index, the price has reached the 140.850 level. This decline was very strong and impulsive; however, as seen on the chart, the price has now approached a significant demand zone between 139.6 and 141. If the price manages to close and stabilize above this area, we can expect a further bullish move from this pair.
Please support me with your likes and comments to motivate me to share more analysis with you and share your opinion about the possible trend of this chart with me !
Best Regards , Arman Shaban

XAU/USD: Ready for another Fall? (READ THE CAPTION)By examining the gold chart on the 30-minute timeframe, we can see that yesterday the price once again moved exactly as expected, hitting all four targets: $3022, $3016, $3010, and $3000, and even dropped further to $2956, resulting in a total return of over 700 pips!
Currently, gold is trading around $3003, and if the price stabilizes below $3014, we can expect further downside.
All key demand and supply zones are marked on the chart and are fully tradable.
If the drop continues, the next bearish targets will be $2997, $2991, $2984, and $2976, respectively.
Please support me with your likes and comments to motivate me to share more analysis with you and share your opinion about the possible trend of this chart with me !
Best Regards , Arman Shaban
