Advanced Micro Devices (AMD) Stock AnalysisAdvanced Micro Devices (AMD) Stock Analysis
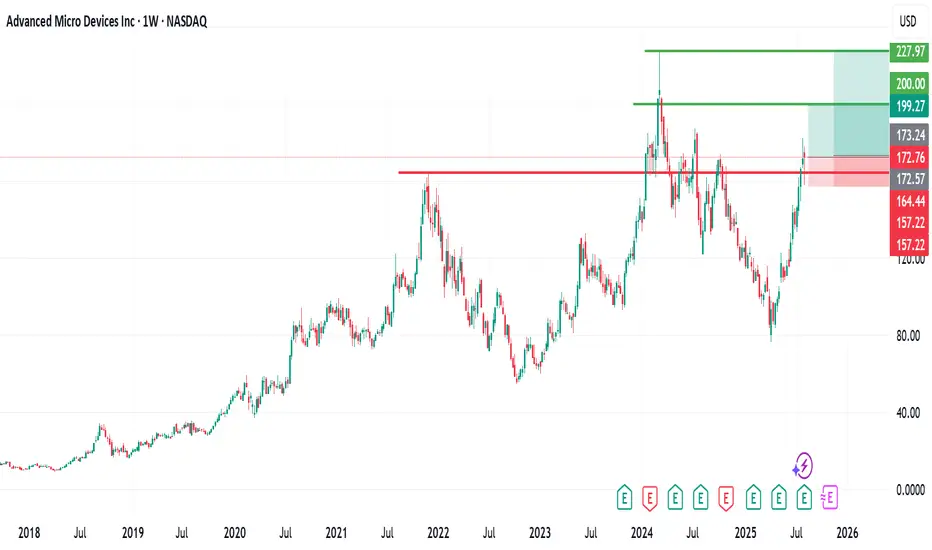
AMD, listed on NASDAQ, has generally been on an upward trend. However, last week, the stock experienced a brief flash downturn, dropping to around the $157 level.
Since then, it has recovered and is currently trading at approximately $172 per share.
Outlook:
I remain bullish on AMD and anticipate a potential move toward the $200 level, with a longer-term target around its all-time high near $226.
For my entry strategy, I have added positions at different levels, with an initial entry around $160 and another at the current level.
This gives me a total of three buy entries, positioning for a mid- to long-term hold.
Let’s see how it unfolds! If you have any insights or thoughts, please share them in the comments. I’d love to connect with you. Don’t forget to follow, share, and subscribe. Thank you.
Artificial_intelligence
PALANTIR vs S&P500 INDEX. WILL AI UPBEAT TYCOON BUFFETT ITSELFFar far ago, somewhere in another Galaxy, in late December, 2024 (yet before The Second Coming of Trump), @TradingView asked at it awesome Giveaway: Happy Holidays & Merry Christmas.
1️⃣ What was your best trade this year?
2️⃣ What is your trading goal for 2025?
Here's what we answered:
1️⃣ What was your best trade this year?
- Surely Palantir NASDAQ:PLTR 💖
I followed Palantir all the year since January, 2024, from $16 per share, watch here .
Current result is 5X, to $80 per share.
Also I added more Palantir after SP500 Index inclusion in September 2024 watch here .
Current result is 2.6X, from $30 to $80 per share.
2️⃣ What is your trading goal for 2025?
- Once again, surely Palantir NASDAQ:PLTR 💖
It's gone 6 months or so... (Duh..? Ahaha.. 6 months already, really? 😸😸😸)
Let see what's happened next at the main graph PLTR/SPX
First of all, let me explain in a few words what does this graph mean.
Rising (Blue) candle means Palantir PLTR monthly return is better vs SPX
Falling (Red) candle means Palantir PLTR monthly return is worse vs SPX
Conclusion
Palantir. The stock that outperformed S&P 500 Index, 12 consecutive months in a row.
Palantir. The stock that printed 12x since inception. 5.5x over the past twelve month and 1.8x in the year 2025 (one the best results so far over the all S&P 500 Index components).
Palantir. The stock that goes to UPBEAT Tycoon Buffett record, that has been achieved in early 1990s (in 1992-93 Berkshire Hathway outperformed S&P 500 Index for straight TWELVE MONTHS).
Palantir. The stock that goes to repeat Microsoft NASDAQ:MSFT record, that has been achieved in 1990s (in 1996-97 Microsoft outperformed S&P 500 Index for straight THIRTEEN MONTHS).
Palantir. Were we right with this stock on contest and won it? Exactly! Even though our prize has been toadly strangled. 🤭
//P.S. We did not find any biggest series then 13-month straight gain. Microsoft 13 straght months superiority over S&P500 index is the biggest ever series in history we found.
//P.P.S. Just one day left (June 30, 2025) to a very potential and a very historical event.
--
Best wishes,
Your Beloved @PandorraResearch Team 😎

$TSLA | Robotaxi Launch Incoming? - Plan Rock Solid w/ 3 TradesNASDAQ:TSLA
Launch could be as soon as Sunday, June 22. However, Musk has emphasized safety as priority. There is the potential to undercut traditional taxi services at less than $0.20 per mile. Tesla’s government and military contracts are key growth drivers but further clash between Musk and President Trump could cause further volatility in price action. Long-term $271 is a critical price point. There are several ways to play Tesla:
* Range between $270 and $350
* $330 to $400 into price discovery
* Breakdown under $270 targeting $212 and $204

How many times we need to get 1000%+ on this? Here's 3 more...NASDAQ:NVDA
We are currently trading above a significant Fibonacci retracement level of $143. We want to see price consolidate above $145, where we will target $194-$200 next. There are several ways to trade this from here.
* Short-term range from $145 to $150
* Breakout momentum trade over $153 targeting $193
* Long-term range between $103 to $140

NVIDIA Can Go PARABOLICMartyBoots here , I have been trading for 18 years and sharing my thoughts on NVIDIA here.
People are scared with war and high stock market but NVDA could go parabolic
Watch Video for more info

$VVV - going parabolicAfter seeing a double bottom, Venice token has moved upward into a parabolic channel. Could see blow off top with potential for extended push to new highs.

Trade the range until it breaks Nvidia updateThis video is a quick recap on the previous video after the levels I gave produced 30% move to the upside after patiently waiting for the move down to 90$.
So what now is the big question after the unprecedented move we had yesterday .
I outline the next best Short/Long setup and define why I think we stay inside of the range until Earnings Data .

Finally happened. Semi’s getting creamed. Semiconductors and all the trappings are finally falling. The bubble has popped for the near term at least.
LONG 3 days ago
AMEX:SOXS is saving my portfolio🙏🏼👍
I’m using a 30 min chart with 10,50,200 sma’s. When the S&P drops below the 50 sma its time to short.
NASDAQ:NVDA was range bound and had dropped below 50sma. Time to short. But NASDAQ:NVDA was leading the way to a reset for all the other Semi underlings.
AMEX:SOXS the answer!!!!

Already kicking the dead for a whileChart
From October 22 to march 24 we had a strong upside move.
Now we are in a deep retrace, the chart is reacting on further down moves with little emotion, I think we are kicking the dead for a while already.
In my opinion we can do even 150$ in 2 months. Than we will see.
Strategically
Trump most likely works for russian secret service. US is on the way to a regular dictatorship unfortunately, I have seen it many times before, all the same approach. He can destroy many important things and harm the usual economy in general, but the AI is so important that it could be the one of islands that will outperform despite the craziness.

Sabah Research Goes Long on Google: EW 2.0 Signals 45% Upside !Sabah Equity Research is taking a bullish stance on Alphabet (GOOGL) as Elliott Wave 2.0 suggests a 45% upside from current levels. With the stock trading at an attractive valuation, this presents a strong opportunity for long-term investors.
Elliott Wave 2.0 Predicts the Next Leg Up
After completing a healthy ABC correction, Alphabet is now primed for a Wave 3 expansion, historically the most powerful phase in the Elliott cycle. The technicals suggest that GOOGL’s recent consolidation is a launchpad for the next move higher.
Catalysts for Growth
Massive Cybersecurity Acquisition
Google’s parent company, Alphabet, is set to acquire Wiz, a leading cloud security firm, for over $30 billion—its largest deal ever. This strengthens Google’s cloud security dominance and accelerates revenue growth.
Undervalued Growth Potential
Despite its leading position in AI, cloud computing, and search, Alphabet trades at a discount compared to peers. This disconnect presents a compelling buying opportunity before sentiment catches up.
AI and Cloud Expansion
Google’s aggressive push into AI and cloud services positions it for massive future gains. With rising demand for AI-driven search, advertising, and enterprise solutions, Alphabet’s growth runway remains robust.
The Trade Setup: Positioning for the Upside
With Elliott Wave 2.0 pointing to a 45% rally, Sabah Equity Research sees Alphabet as a strong long-term play. The combination of cheap valuation, a game-changing acquisition, and a favorable technical setup makes this an ideal entry point.
Smart money is accumulating—will you? 🚀

Going Long on NVDA !NVIDIA (NVDA) has been a powerhouse stock, riding the wave of AI, gaming, and data center demand. Recently, the stock experienced a correction, which might have caused some investors to hesitate. However, from an Elliott Wave 2.0 perspective, this pullback was nothing more than a natural ABC correction following a classic 1-2-3-4-5 impulse wave—a textbook setup for long-term bulls.
Understanding the ABC Correction in NVDA
In Elliott Wave theory, after a strong five-wave rally, the market typically experiences a three-wave pullback (ABC correction) before continuing its long-term uptrend. This correction serves to shake out weak hands, reset overbought conditions, and set the stage for the next bullish impulse.
The A-wave is the initial drop as profit-taking kicks in.
The B-wave is the temporary bounce, often mistaken for a continuation.
The C-wave completes the correction, offering smart investors an ideal entry point.
NVDA’s recent pullback aligns perfectly with this structure, meaning the next leg up could be just around the corner.
Why NVDA Remains a Strong Long-Term Bet
AI Dominance – NVIDIA is at the center of the AI revolution, with its GPUs leading the industry.
Data Center Growth – Demand for high-performance computing continues to surge.
Technical Reset – The stock has worked off overbought conditions and is finding new support levels.
The Opportunity: A Strategic Long Entry
Now that the ABC correction has played out, NVDA presents an excellent long entry for those looking to ride the next bullish wave. With strong fundamentals and a technical reset, the stock is primed for another 1-2-3-4-5 impulse move, potentially leading to new all-time highs.
For traders who understand market structure, this is a golden opportunity to go long before the next explosive rally begins. 🚀

$VVV - AI Moonshot ticketThe big drawdown prior was due to 50% of the supply being airdrop on TGE -- no VC's, no Presale. The airdrop claim window was open for 45 days and has now closed.
33m tokens were remaining, over $130m in value and the team burnt the lot of it.
basescan.org
Updated tokenomics can be found on CoinGecko, and currently 51% of circulating supply is timelocked and staked with massive 80% APR.
Can see a breakout of prior downtrend, triangle correction (abcde on 1hr chart). Price retested and moving up for the Wave 3 rally.
USA Based project providing inference service for AI -- product ready, similar to OpenAI but crypto native. Founder: Erik Voorhees, multi-millionaire Bitcoin OG from 2011 and founder of ShapeShift.
You do not want to miss this one, already listed on Coinbase, Kraken, and Binance Futures. Can pick up on Aero aswel. Still only 100m mcap with $255m FDV.

Nauticus Robotics - The Roaring $KITTNauticus Robotics ( NASDAQ:KITT ) is a picture-perfect pick-up for the coming market conditions. With capital about to be re-allocated into markets, following the month long sell-off of late and rotation into precious metals/bonds.
Technicals
Already broken-out of its downwards wedge pattern on high volume, NASDAQ:KITT recently just put in a double bottom.
If the initial move from December 19th to 6th January, was an Elliott Wave 1, I would wait & prepare for volatility to come, and if to the upside it will put some of the most volatile cryptocurrency tokens to shame.
Wave 2 should now be complete, having bottomed on March 4th. Friday March 14th should have been the completion of its 1st higher low.
As early as next week, I am expecting NASDAQ:KITT to reach $2.80. This coincides with the 0.618 fibonacci level, resulting from its recent decline. From there, a shallow retrace into the end of the month before catapulting itself to levels not seen since September 2023 at around $80.
That would conclude Wave 3, the most volatile of moves in Elliott Wave theory, between May and June. Reaching the 2.272 fib level at $80.
The entire move can reach a final impulse conclusion of around $155 of the 2.618 fib level 👀. A potential 150x in just a few short months.
-----
Fundamentals
Nauticus Robotics is creating an entirely new industry right before our eyes. They are pioneers and future monopolists for the underwater economy, just like Tesla are becoming to battery, automation & automotive technology.
Think deep-sea oil refining, precious metal mining, environmental studies and even underwater city construction. Combined with a domestic administration that for the first time in decades is supportive of such novel energy & infrastructural investments.
For those expecting an AI bubble to soon take hold of markets, this stock is arguably one of the few companies that could simply not exist without artificial intelligence. Thanks to this new technology, it opens up commercially and fundamental new opportunities to deploy unmanned robotics deep into our oceans, for days at a time without costly supervision.
Currently (at $1.06) with a market cap of $6.79 million , there is far too much upside to this stock. One that employs dozens of ex-NASA engineers.
This stock is one of the 100 most highly shorted stocks on markets. With RICO and an administration hostile towards & actively investing such practices, this stock is likely to undergo a swift revaluation.
All of this combined, suggests to me the ocean tide is on your side with $KITT.

CHINA FIN MARKETS | Investing in China & AIChina's market resurgence might pose some great opportunities for investors, especially after a long bearish cycle for the global Chinese financial markets.
February 2025 saw a significant shake-up in global markets, with China emerging as a key player driving investor sentiment. The MSCI China Index surged by 11.2% for the month, vastly outperforming the MSCI US Index:
One of the biggest catalysts behind China’s recent rally has been its advancements in Artificial Intelligence (DeepSeekAI being one of the key drivers).
By operating at a fraction of the cost of their US counterparts, such as OpenAI and Meta, DeepSeek's competitive advantage has given China an edge in the AI space, which can be seen in the market confidence.
XIAOMI has been one of the top gainers, largely as they are expanding their market penetration:
Chinese markets in February saw a boost when President Xi Jinping was warmly received by tech industry leaders. A handshake between Xi and Alibaba’s Jack Ma who previously stepped back from the public eye following regulatory crackdowns, was seen as a major gesture of reconciliation between the government and the private sector. This renewed support for private enterprises.
China’s long-term strategy has been paying dividends in high-tech industries. China has increased its global market share in nearly all industries and is outperforming competitors in cost-efficiency, particularly in sectors like copper smelting.
Despite recent gains, China’s stock market has yet to fully recover from its underperformance over the past decade. While the MSCI China Index has risen 34.6% over the past year, long-term returns still lag behind global markets. A US$100 investment in an MSCI World Index tracker in 2010 would have grown to US$480 by early 2024, whereas the same amount invested in an MSCI China Index fund would have only reached US$175.
China’s resurgence has brought a renewed sense of optimism, but investors remain cautious. While AI advancements and low cost of labor have positioned China as a competitive force, historical challenges like regulatory intervention, tariffs and economic instability still loom.
_________________________

Ai16z levels$0.40 cents is now broken this is a major level that we have been seeing liquidity at. I have marked a few more levels on chart .45 and .54 this goes back to launch in Nov 2024 i have drawn a yellow line with my ides of a rejection at .45 then a bounce of .40 and if we break through a target or TP1 at .54 cent

APLD explosive move to 13.4-13.6 is imminent!!looking for next buy wave to take price to 13.4-13.6 levels.
strong buy rates, increasing buying pressure among tech stocks & indices amidst volatility.
buyers returning & ready to take us higher once more.
holding long equity & call option positions.

$NVDA Earnings SetupNASDAQ:NVDA
Nvidia needs to absolutely dominate the market with both earnings and guidance. Last time they beat by 10% and sold off. Right now is a very difficult time in the market. Many tech companies are beating earnings, then selling off. Shay expects Nvidia to report strong earnings, however, he sees Nvidia having a pullback quarter but the timing is uncertain. As long as it holds the 200 MA, he remains in position. Nvidia has cemented its position in the AI and quantum computing thematics, with its CUDA platform and NVDL Link being essential for future workloads. Doubt remains though about lowered AI cloud workloads due to compute restraints. Demand is still way higher than supply, but questions remain surrounding easing of supply constraints and whether Nvidia has another leg left for exponential growth.
Here are our key levels to watch through earnings:
Under bullish trendline and $130.56, aim for $114.
Over bullish trendline and $130.56, aim for $140.

$AIXBT – AI-Powered Crypto Analysis Tool with Real Market Utilit💡 What is $AIXBT?
$AIXBT is an AI-driven analytics platform under Virtuals Protocol, integrating blockchain, AI, and big data for advanced market insights.
📊 Key Features:
AI-driven market analytics – Monitors Crypto Twitter & CoinGecko.
Trending narrative detection – Finds key narratives influencing market moves.
Alpha-generating insights – Uses AI to provide data-driven trade signals.
On-chain & sentiment analysis – Tracks 400+ Key Opinion Leaders (KOLs).
🔹 Built on: Base L2 (Ethereum) – Low fees, fast transactions.
🔹 Listed on: Gate.io, gaining liquidity & visibility.
🔹 Growing user base: 100K Twitter followers in 2 months.
🛠 Key levels to watch:
Sweep of $0.167 expected soon – setting up a potential long trade.
Downside risk: $0.08
Upside targets:
$0.3 - $0.43 = conservative/local peaks.
$0.75 - $1.00+ = possible in 2025 if market euphoria kicks in.
🤔 Is $AIXBT Worth Watching?
AI + crypto is a major 2025 trend.
Not a meme coin – real utility for traders.
Unique AI-powered sentiment & narrative tracking.
High volatility.
🚀 Bottom Line:
$AIXBT has a strong AI-driven concept but needs to prove itself in the competitive AI crypto sector. If market enthusiasm for AI tokens continues, this could be a major breakout play.
📌 Key trade idea:
Watch for liquidity sweep at $0.167 → long if price bounces back up immediately.

$VIRTUAL – AI x Metaverse x Blockchain
AI-driven gaming agents tokenized for shared ownership & transactions.
Agent-to-Agent Commerce Protocol (ACP) enables autonomous AI trading.
Runs on Ethereum & Solana, expanding interoperability.
Super APP launching soon—simplifying user interaction.
Market Outlook:
Reclaiming $1.06 = buy signal
Current structure looks weak—avoid knife catching.
Entered long at range low, targeting $1.71 & $2.66.
Will AI-powered virtual economies be the next breakout trend?

NVIDIA & xAI’s Grok 3: A Game-Changer or Overhyped AI Play?NVIDIA’s stock ( NASDAQ:NVDA ) has been on an unstoppable rally, driven by the AI boom. Now, with Elon Musk’s xAI set to launch Grok 3 —trained on an impressive 100,000 NVIDIA H100 GPUs —the market is buzzing with speculation. Could this be the catalyst that propels NVDA to the next level, or are we approaching an AI-driven valuation bubble?
Key Developments :
Massive GPU Demand : xAI’s Grok 3 will utilize a staggering 100,000 H100 GPUs, reinforcing NVIDIA’s dominance in AI hardware and boosting its market position.
Supercomputer Expansion : Musk’s team is building one of the most powerful AI training clusters in Memphis, Tennessee. This development could significantly increase NVIDIA’s long-term revenue streams, given its key role in powering these systems.
Release Date : Grok 3 is set to launch today, February 17, 2025(4 AM GMT) , with a live demonstration, which may influence sentiment around AI-related stocks, especially NVIDIA.
Market Sentiment & Risks : While these developments seem bullish for NVIDIA, some analysts, including hedge funds like Elliott Investment Management, have raised concerns over the potential for overvaluation as the AI euphoria spreads.
Conclusion: Grok 3’s launch will be a pivotal moment, with NVIDIA at the heart of the AI revolution. Whether this sparks a fresh rally or raises concerns about an AI bubble remains to be seen.
------------------------------------------------------------------------------
Now, let's use Technical Analysis to analyze NVIDIA stock(NVDA) .
In terms of technical analysis, the loss of an Ascending Channel is not good news for any asset and is a sign of weakness in the upward trend . This has happened to the NVIDIA stock(NVDA) .
From the point of view of Classical Technical Analysis , it seems that NVIDIA stock is completing the Rising Wedge Pattern .
Educational tip : The Rising Wedge Pattern is a bearish reversal or continuation pattern characterized by converging upward-sloping trendlines. It signals weakening bullish momentum, often leading to a breakdown below support. A confirmed breakout to the downside indicates a potential price decline.
I expect the launch of Grok 3 Artificial Intelligence(AI) can increase at least +10%+15% of NVIDIA stock(NVDA) . If the upper line of the Rising Wedge Pattern breaks , we can expect a further increase [ the next target can be Yearly Resistance(1=$175.68)(in case of breaking) ].
What’s your take? Drop your thoughts about NVIDIA in the comments! 👇
Be sure to follow the updated ideas.
NVIDIA Analyze (NVDAUSD), Daily time frame.
Do not forget to put Stop loss for your positions (For every position you want to open).
Please follow your strategy; this is just my idea, and I will gladly see your ideas in this post.
Please do not forget the ✅' like '✅ button 🙏😊 & Share it with your friends; thanks, and Trade safe.

My BY Entries for NVIDIAHere are my 2 buy entries for NVIDIA.
Please study my chart and see my reasons.
Entry 1: buy at the current price of $123.5.
Entry 2: wait to retrace back to $120
SL for the two entries: $114.8
TP1 and TP2 : $150
Trade with care

Snowflake ($SNOW) | Rerating Incoming with 2-3x PotentialOur top analyst Shay Boloor (@StockSavvyShay) is adamant that Snowflake will be rerated in 2025 with a price target of $300 (called out live on Fox Business). Their NRR is at 127%, meaning existing customers will spend 27% more YoY. For Snowflake to grow 27% within the next year, all they need to do is nothing. They can afford to sit.
Data consumption models make money out of thin air. 40% of the Fortune 2000 data is stored in Snowflake’s ecosystem ALREADY. They are trading at 25% of Palantir’s valuation and 20% of Cloudflare’s. This could be a 3-4x trade. There is still no floor on AI and its applications.
On the technical side, over $205 and we have a liquidity zone up to $300. Our entries are at $109 and $125, but this would be a secondary entry for a position trade to capitalize on one of the top names in stage two AI (software/applications).
Entry: Over $205
Targets: $230, $300, $400
NYSE:SNOW

NVIDIA (NVDA) Bounces Off Weekly EMA – Is a Rally Coming?📈 NVIDIA (NVDA) closed the week with a strong bullish candle, rebounding off the 50-week EMA. Historically, this has been a key level for the stock, often signaling strong continuation moves to the upside.
Key Observations:
- 1W 50 EMA Support: In previous cycles, NVDA has repeatedly touched this moving average and rebounded, leading to sustained uptrends. The highlighted regions on the chart reinforce this pattern.
- Strong Buying Volume: The volume bars suggest renewed interest from buyers at this level.
- Macro Uptrend Intact: Despite recent corrections, NVDA remains in a long-term bullish trend.
Fundamentals:
- NVIDIA is expected to release their next earnings report on February 26th, which is in 19 days from now.
- NVIDIA is set to release their $3000 NVIDIA GB10 compact AI super computer in May.
- As cheaper-to-run AI models like DeepSeek are released and get into the hands of businesses, this will lead to increased demand for AI chips (read about Jevons' Paradox on Wikipedia ).
Potential Price Path:
🚀 If history repeats, this bounce could lead NVDA to reclaim previous highs and even explore new all-time highs in the coming months.
⚠️ Risk Factor: If NVDA fails to hold above the 50-week EMA, downside risk increases, with a potential retest of lower support levels.
📊 Conclusion: This historical pattern suggests a high-probability trade setup. Traders and investors should keep an eye on volume confirmation and macroeconomic conditions before making their next move.
💬 What’s your take on NVDA’s next move? Share your thoughts below! 👇
Let me know if you want any refinements or additional insights. 🚀
Don't forget,
Patience is Paramount.
