AIUSDT (2D) — Entering a Major Accumulation Phase?Overview:
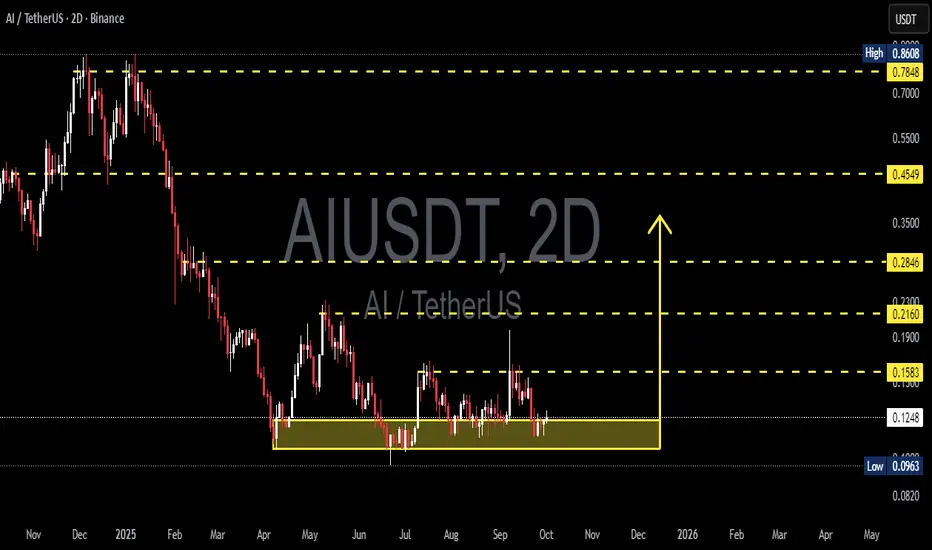
AIUSDT is currently in a deep accumulation phase after a long decline from the peak at 0.8608. Price is consolidating within the critical support zone of 0.0963 – 0.1257 (highlighted in yellow). This level has been tested multiple times, showing strong interest from both buyers and sellers.
On the 2D timeframe, the structure suggests that the market is waiting for a decisive move: will this support hold as the base for a reversal, or will it break down to extend the bearish trend?
---
🔑 Key Technical Levels
Main Support: 0.0963 – 0.1257
Secondary Support: 0.0820 (historical level)
Key Resistances:
0.1583 → first breakout confirmation
0.2160 → strong psychological resistance
0.2846 → major swing target
0.4549 → higher timeframe resistance
0.7848 → major supply zone from previous distribution
---
📈 Bullish Scenario
Trigger: A confirmed 2D close above 0.1583 with solid volume.
Momentum confirmation: Formation of higher lows and strong bullish candles.
Upside targets:
1. 0.1583 (initial resistance)
2. 0.2160 (trend validation)
3. 0.2846 (swing extension)
Bullish signals: RSI bullish divergence or a bullish engulfing candle forming at support.
---
📉 Bearish Scenario
Trigger: A confirmed 2D close below 0.0963 with increasing sell volume.
Retest confirmation: If price retests the 0.0963 – 0.1257 zone and fails to reclaim it, the area turns into resistance.
Downside targets: Next support at 0.0820, with risk of further price discovery to the downside.
Bearish signals: Long upper wicks near resistance combined with strong selling volume.
---
📊 Structure & Pattern
Current structure resembles an accumulation range following a prolonged downtrend.
The longer price stays within this range, the stronger the eventual breakout or breakdown move is likely to be.
This pattern could evolve into re-accumulation or redistribution, depending on the direction of confirmation.
---
🎯 Trading Strategy
For bulls: Consider entries near support with bullish confirmation, SL below 0.09, targets scaled across resistance levels.
For bears: Wait for a confirmed breakdown below 0.0963, enter on failed retests, SL above 0.1257, target down to 0.0820.
Note: Always apply risk management (max 1–2% risk per trade).
---
📌 Conclusion
AIUSDT is at a critical decision zone. This range will decide whether the market starts a new bullish trend or continues its bearish extension.
Holding support → potential for a strong rally.
Breaking support → continuation of the downtrend.
Traders should wait for volume confirmation and 2D candle closes before committing to a major position.
---
#AIUSDT #CryptoAnalysis#SupportResistance #Altcoin #Breakout #Accumulation #TechnicalAnalysis #SwingTrade #PriceAction
Aster
$ASTER - Perfect setup $ASTER - Perfect setup
1.720$ double bottom & retest
TP3 hit for my team
2.00$ next?
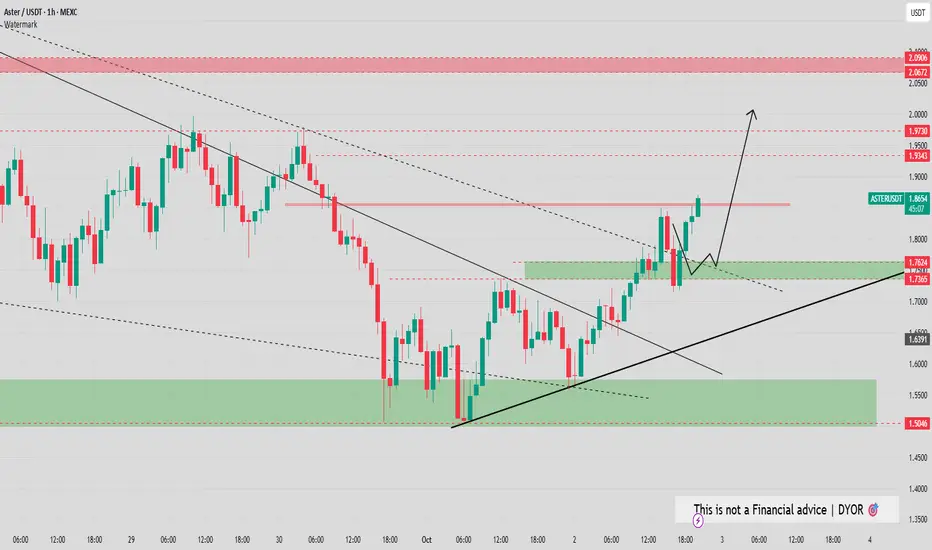
Is Aster Ready for an Upside Surge?$ASTER bounced before reaching the key zone, but now it's facing a slight rejection at the trendline. If it manages to close successfully above the resistance line, we could see a solid upside move.
Keep a close eye on this setup, it might just break out soon.
DYOR, NFA
Stay tuned for more update and follow us on tradingview!

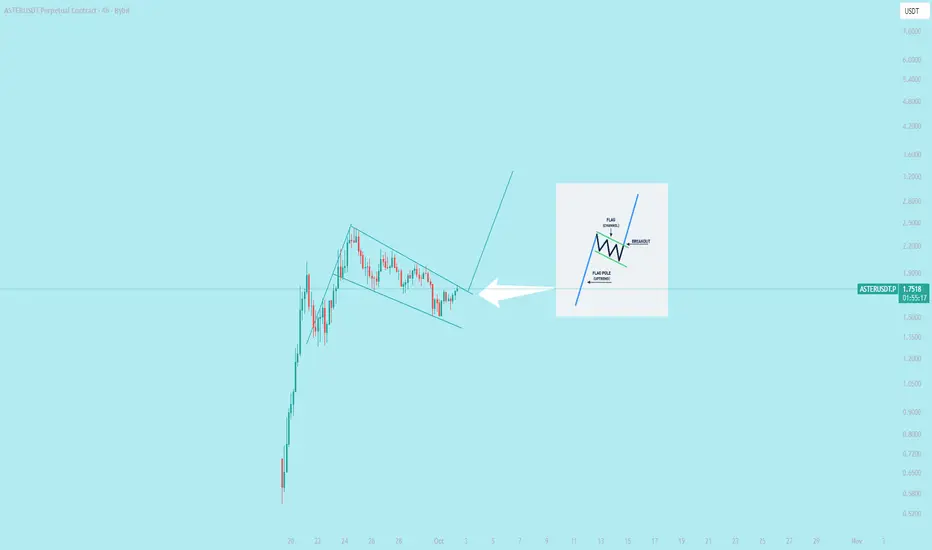
$ASTER Perform of a bullish flag in 4hr
A bullish flag is a chart pattern used in technical analysis that signals a continuation of an uptrend. It is named for its resemblance to a flag on a pole. The pattern consists of two parts: the "flagpole" and the "flag".
**How to trade a bullish flag**
Traders can use the bullish flag pattern to identify potential entry, exit, and stop-loss points.
**Entry**: Enter a long (buy) position after the price breaks above the upper trendline of the flag, indicating the continuation of the uptrend. More conservative traders may wait for the breakout candle to close for confirmation.
**Stop-loss:** Place a stop-loss order just below the lower trendline of the flag. This helps protect against a false breakout or a market reversal.
**Profit target:** A common method for setting a profit target is to measure the height of the flagpole and then project that distance upward from the point of the breakout.
@everyone
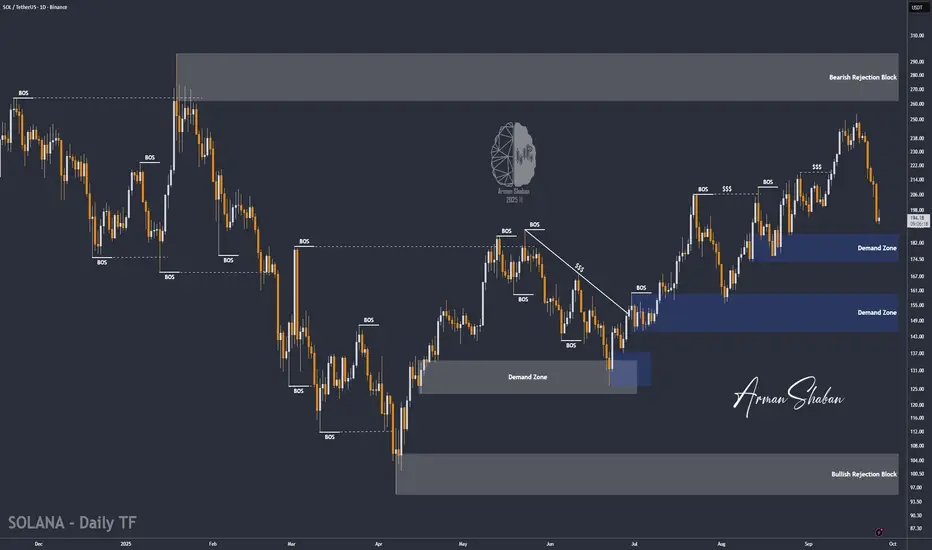
SOL/USDT | Solana Correction Could Spark Rally to $262 (READ)By analyzing the Solana chart on the daily timeframe, we can see that the price has continued its correction and is now trading around $194. As you can see, it’s getting close to the $173–$186 demand zone, and we need to watch whether this zone can trigger new buying pressure.
Personally, I expect a strong reaction from this area. If the price stabilizes here and shows the first signs of growth, the possible upside targets will be $205, $230, $242, $254, and $262.
Please support me with your likes and comments to motivate me to share more analysis with you and share your opinion about the possible trend of this chart with me !
Best Regards , Arman Shaban
aster 70% move upside for this week?we were monitoring this coin for while i mention this coin entry at 0.786 fib level
right now BTC looking strong if its hold ... has some insane upside room to go ! what do you think about CZ coin ?
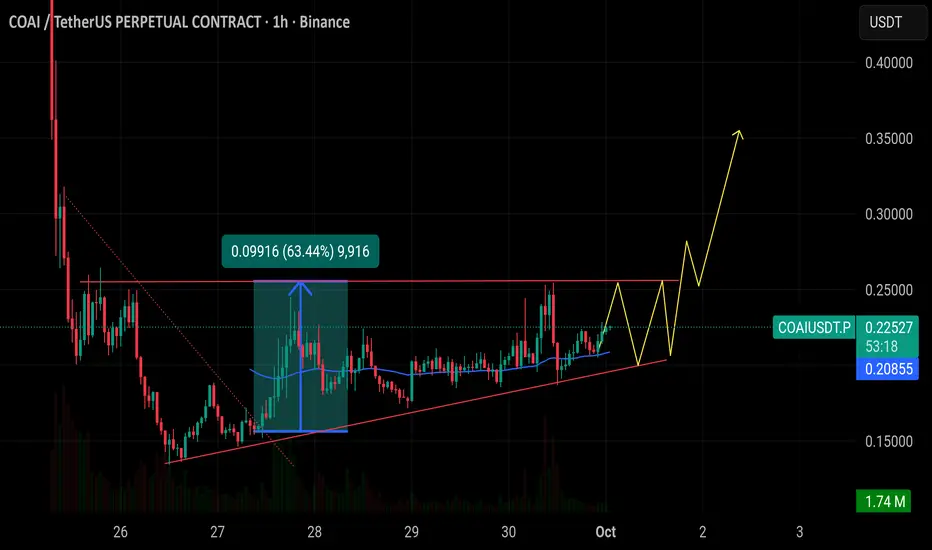
$COAI after a 63% pump is now trading in an Ascending Triangle $COAI after a 63% pump is now trading in an Ascending Triangle with resistance around 0.25 and rising support near 0.20. A breakout above 0.25 could push the price toward 0.35–0.40, while losing the rising support would risk a sharp drop back under 0.19.
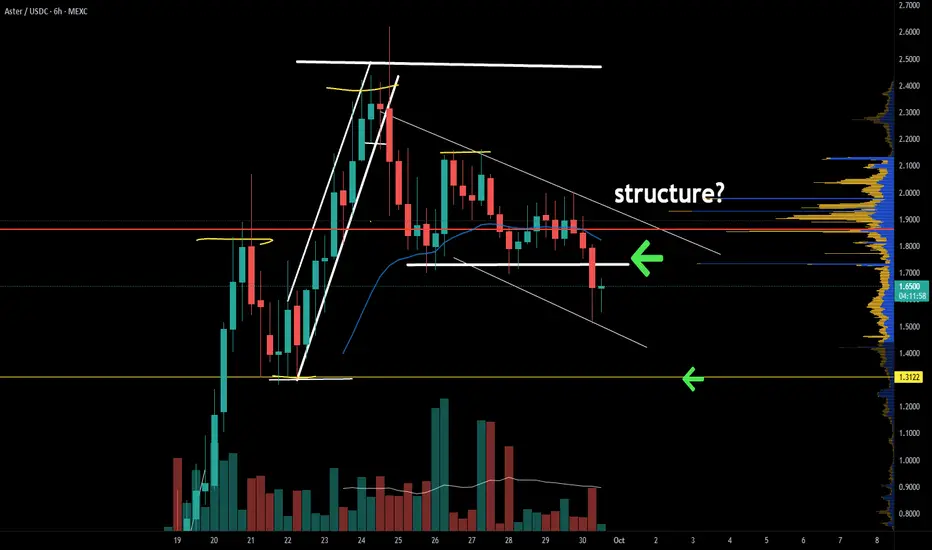
ASTER is retracing hard as the bearish sentiment continuesAs momentum, sentiment, and price structure continue to fall, the opportunity to buy from a position of strength increases. The dilemma is finding enough evidence to form a bullish thesis. Currently, there are clear bearish price targets, and until proven otherwise, expecting more downside is a reasonable expectation.
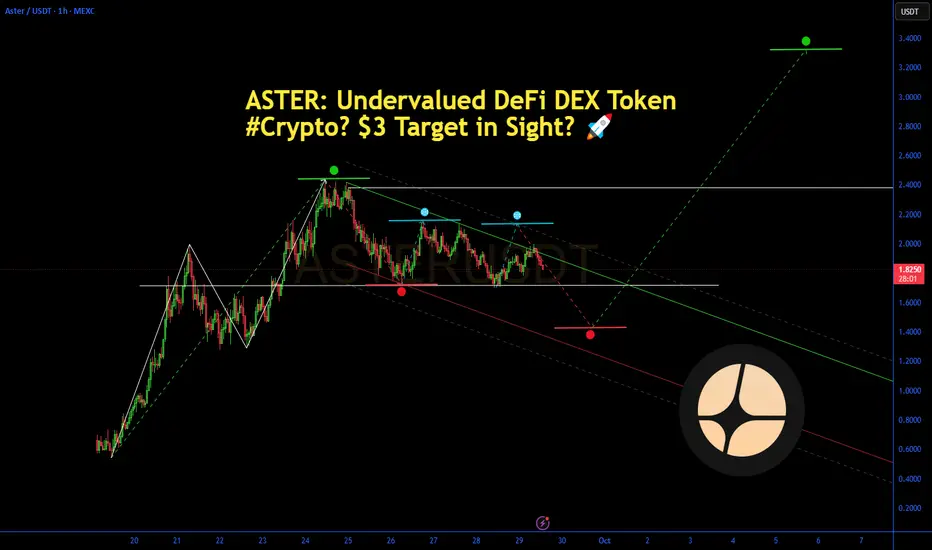
ASTER: Undervalued DeFi DEX Token $3 Target in Sight?ASTER: Undervalued DeFi DEX Token Amid #Crypto? $3 Target in Sight? 🚀
ASTER at $1.84 (+10.49%), undervalued with multi-chain DEX features and $400M+ TVL amid Mr. Beast whale moves and X buzz—analysts project $3 average target for 2025, 51% upside, pondering if MEV-free trading fuels rally. 📈
**Fundamental Analysis**
Market cap $3.3B with 24h volume $1.2B; undervalued vs. peers on capital efficiency (yield-generating collateral), high ROI from RWA integrations and community governance, fundamentals boosted by DWF backing and multi-chain expansions.
- **Positive:** MEV-free execution; cross-chain perpetuals and spot trading.
- **Negative:** High volatility as new entrant; limited analyst coverage.
**SWOT Analysis**
**Strengths:** Innovative Simple/Pro modes; privacy-focused L1 chain.
**Weaknesses:** Recent launch risks; scalability challenges.
**Opportunities:** DeFi boom; stock perpetuals adoption.
**Threats:** Regulatory hurdles; competitor dominance.
**Technical Analysis**
Chart in volatile uptrend post-launch. Price: $1.99, VWAP $1.95.
Key indicators:
- RSI: 61 (bullish momentum, not overbought).
- MACD: Positive (upward signal).
- Moving Averages: Above short-term averages (mixed long-term due to newness).
Support/Resistance: $1.71/$2.41. Patterns/Momentum: Rebound from lows targeting $2.50. 📈 Bullish | ⚠️ Bearish.
**Scenarios and Risk Management**
- **Bullish:** Whale activity pushes to $2.50; DCA on support tests for averaged entry.
- **Bearish:** Profit-taking drops to $1.50.
- **Neutral:** Consolidates at $2.00 on volume buildup.
Risk Tips: 1% risk per trade, stops at $1.80, diversify DeFi holdings, DCA to counter swings. ⚠️
**Conclusion/Outlook**
Bullish if TVL growth persists. Watch multi-chain updates. Fits #Crypto theme with DEX upside. Take? Comment!
$ASTER is a clear case of market manipulation$ASTER is a clear case of market manipulation:
6 wallets (likely one group) control 96% of the supply.
No functional product, only $500k daily volume on CRYPTOCAP:BTC pair, and shady practices.
Still, it’s valued at $10B.
Everyone sees it’s junk, but you can’t short it.
That’s why $ASTER is bullish—they control the price by owning nearly all the supply.
You can argue supply control is bad, but it works here.
Tight control by shady players = bearish. Tight control by “trusted” players = bullish.
You can call it a scam and say it shouldn’t be worth $10B when it’s barely worth $200M.
You’re right, but you won’t profit.
Accept the game: most altcoins are worthless tokens with no real use. Price isn’t driven by utility—it’s about who’s behind it and their money.
Understand that, and you can start making money.
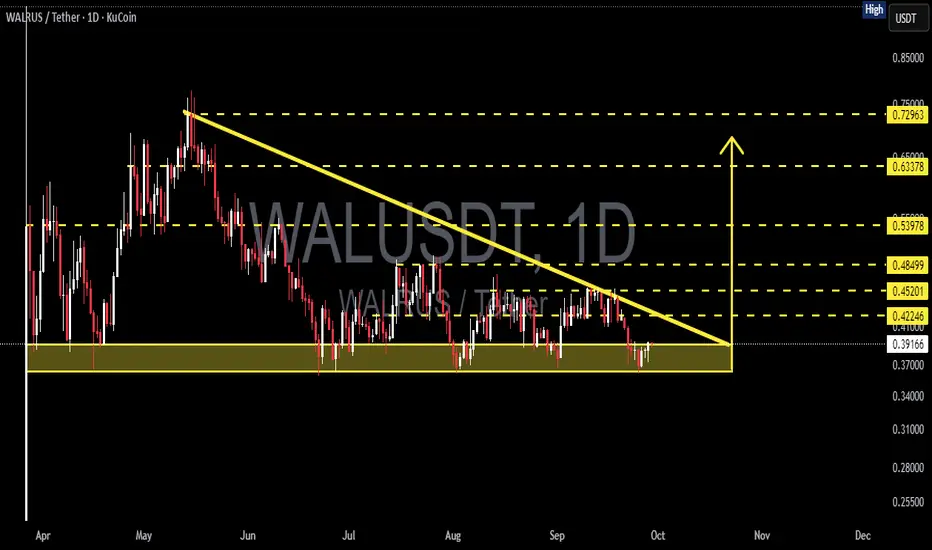
WALRUS/USDT – Descending Triangle at Critical Support!WALRUS/USDT is currently trading within a descending triangle pattern on the daily timeframe. This structure is formed by a series of lower highs pressing from above (descending trendline), while the 0.36–0.40 support zone (yellow box) acts as a major floor below.
This highlights strong selling pressure from the top, but at the same time buyers are still holding the support area. The price is now consolidating within a narrowing range, waiting for a decisive breakout that will dictate the next big move.
---
Bullish Scenario (Upside Breakout)
If WALRUS can break above the descending trendline with a daily close above 0.422–0.452, this descending triangle may flip into a bullish reversal. That would signal buyers regaining control.
Bullish Targets:
Target 1: 0.485
Target 2: 0.539
Target 3: 0.633 – 0.729 (if momentum continues strongly)
Validation: breakout with high volume + successful retest of breakout level as support.
---
Bearish Scenario (Downside Breakdown)
If WALRUS closes daily below 0.36, the descending triangle will confirm as a bearish continuation. This shows sellers overwhelming buyers at support.
Bearish Targets:
Target 1: 0.31 – 0.30
Target 2: 0.255 (long-term demand zone)
Validation: strong bearish daily close with volume, without quick recovery above 0.36.
---
Pattern & Interpretation
The descending triangle often acts as a bearish continuation pattern.
But in strong support zones, it can turn into a reversal pattern if an upside breakout occurs.
WALRUS is at a decision point: the tighter the consolidation, the bigger the potential explosive move once a breakout happens.
---
Conclusion
Bias: Neutral → Bearish as long as WALRUS remains below the descending trendline.
Bullish confirmation: daily close above 0.422–0.452 → potential rally to 0.485 – 0.539.
Bearish confirmation: daily close below 0.36 → possible drop to 0.31 and 0.255.
Traders should wait for volume-backed breakout confirmation before positioning. WALRUS is now at a make-or-break level: will it bounce or break?
---
#WALRUS #WALRUSUSDT #CryptoAnalysis #TechnicalAnalysis #DescendingTriangle #Breakout #SupportResistance #PriceAction
ASTER Market Update📊 ASTER Market Update
ASTER has formed a bearish Double Top pattern ⚠️ and broke the blue support zone 🔵
What’s next? If price keeps retracing down, we have two green zone levels 🟢 where buyers previously accumulated.
These zones could give potential long entries or spots to accumulate more — but always wait for confirmation before entering ✅
⚡ Trade smart, not blind.

MUBARAK/USDT — Confluence Accumulation Zone?🔎 Overview
MUBARAK/USDT is currently testing the critical support zone (0.022 – 0.028 USDT), which aligns with a medium-term ascending trendline. This confluence makes the area a decisive “do or die” zone: either a strong rebound that may trigger a reversal, or a confirmed breakdown that could push prices much lower.
---
📍 Key Technical Levels
Current Price: ≈ 0.0298
Main Support Zone (yellow box): 0.022 – 0.028
Critical invalidation support: 0.0208
Resistances:
R1 = 0.03862
R2 = 0.04299
R3 = 0.04999
R4 = 0.06630
---
🧩 Structure & Patterns
1. Accumulation zone: price repeatedly bounced within 0.022–0.028, suggesting active buyers.
2. Ascending trendline: supports higher lows on the mid-term structure.
3. Lower highs still dominate → bulls need a breakout above 0.0386 to flip the structure.
4. Potential double bottom: a strong rejection here could mark a classic bullish reversal.
5. Breakdown scenario: a daily close below 0.022 with volume = bearish continuation toward 0.0208 → 0.0164.
---
🚀 Bullish Scenario
Confirmation signals:
Strong rejection candle (long lower wick + close above zone).
Volume expansion.
Daily close above 0.0386.
Upside targets:
TP1 = 0.03862
TP2 = 0.04299
TP3 = 0.04999
TP4 = 0.06630
Strategy:
Conservative entry on retest after rejection.
SL below 0.0208.
Scale out profits gradually.
---
⚠️ Bearish Scenario
Confirmation signals:
Daily close below 0.022 with strong volume.
Failed retest (support turns resistance).
Downside targets:
S1 = 0.02080
S2 = 0.01640
Strategy:
Cut longs if breakdown is confirmed.
Aggressive traders may short toward 0.0208 → 0.0164.
---
📑 Entry Checklist
1. Wait for daily close confirmation (not intraday wick).
2. Volume above average.
3. Successful retest (support ↔ resistance flip).
4. RSI divergence or recovery.
5. MACD bullish cross / rising histogram.
6. BTC & overall altcoin sentiment aligned.
---
🛡️ Risk Management
Risk per trade: 1–2% of total capital.
Use SL strictly below 0.0208 for longs.
Move SL to breakeven after TP1.
Accumulation zones often produce false breaks → do not enter without confirmation.
---
🌍 Market Context
Altcoins remain correlated with BTC: a BTC rebound could boost upside potential.
On-chain events (token unlocks, listings, or major news) may drive volatility.
Liquidity is thin → expect high volatility and manage position sizes accordingly.
---
📌 Conclusion
MUBARAK is at a golden zone of decision: a confirmed rejection could spark a +100% rally toward 0.066, while a breakdown would likely drag it back to 0.0208 or even 0.0164.
This is where market makers and big players decide the next major move — patience and risk control are key.
---
#MUBARAK #MUBARAKUSDT #CryptoAnalysis #Altcoins #SupportResistance #BreakoutWatch #RiskManagement

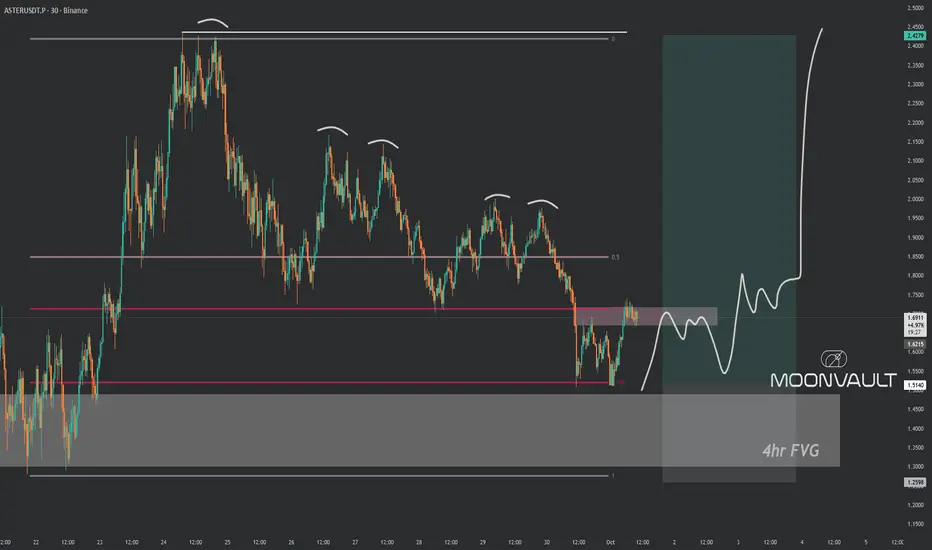
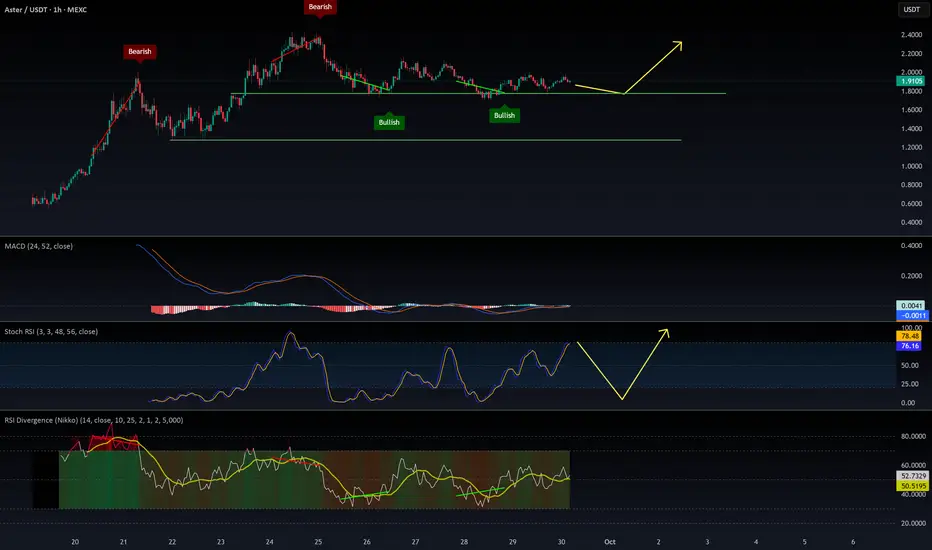
ASTERUSDT — Will Buy Zone Hold or Break?Overview
ASTER price is currently consolidating after a strong rally toward 2.42. On the 2-hour chart, we can clearly see two major highlighted areas: Buy Zone 1 (primary support) and Buy Zone 2 (deeper secondary support).
The structure still maintains a potential bullish continuation, but repeated weakness around support indicates risk of a breakdown if buyers fail to defend the current zone.
---
🔑 Key Levels
Nearest Support (Buy Zone 1): 1.75 – 1.95
Secondary Support (Buy Zone 2): 1.25 – 1.45
Minor Resistance: 2.12
Major Resistance: 2.33 – 2.42 (previous supply zone / local high)
Current Price: 1.91
---
📐 Technical Pattern
1. Bullish Flag / Rectangle
A sideways consolidation after a strong uptrend move, often a continuation pattern. A confirmed breakout to the upside could lead to a retest of 2.42.
2. Multiple Support Tests at Buy Zone 1
Several rejections at 1.8 – 1.9 confirm this zone as a critical short-term demand area. However, the more often a support is tested, the weaker it becomes.
3. Lower Highs Formation
Minor lower highs suggest mild selling pressure. This structure often precedes either a breakout or a breakdown, depending on which side gets taken out.
---
🚀 Bullish Scenario
Confirmation: A 2H close above 2.12 with rising volume.
Targets:
TP1 = 2.12 (breakout retest)
TP2 = 2.33
TP3 = 2.42 (previous high)
Extended Target: If 2.42 breaks, next psychological resistance sits around 2.80 – 3.00.
📌 Bullish entry ideas:
Aggressive: Buy within Buy Zone 1 with stop loss below 1.75.
Conservative: Wait for breakout above 2.12 + confirmed retest.
---
🐻 Bearish Scenario
Confirmation: A 2H close below 1.75 (breakdown from Buy Zone 1).
Targets:
TP1 = 1.50
TP2 = Buy Zone 2 (1.25 – 1.45)
Extended Target: If Buy Zone 2 fails, the structure shifts into a downtrend, potentially moving closer to 1.00.
📌 Bearish entry idea:
Enter short after breakdown (close <1.75), with stop above 1.95 (former support turned resistance).
---
📊 Risk Management
Always set stop losses below support (for longs) or above breakdown (for shorts).
Scale out profits at key resistance levels.
Keep risk per trade ≤2% of total capital.
---
⚠️ Things to Watch
False breakouts: Require volume confirmation.
Correlation with BTC/ETH: Broader market moves can strongly influence ASTER’s direction.
High volatility: Fakeouts may occur before the real move.
---
📌 Conclusion
As long as price holds above Buy Zone 1, the bullish continuation toward 2.12 – 2.42 remains valid.
A breakdown below 1.75 would invalidate the short-term bullish case and open the door toward Buy Zone 2.
Key decision point is very close — watch carefully for breakout or breakdown confirmation.
---
#ASTER #ASTRUSDT #CryptoAnalysis #BuyZone #SwingTrade #PriceAction #SupportResistance #BullishScenario #BearishScenario

Aster vs Hyperliquid – Value BreakdownWas just taking a closer look at GETTEX:HYPE vs $ASTER. Both projects are moving fast, but the fundamentals tell two very different stories.
Hyperliquid ( GETTEX:HYPE ):
Fully Diluted Valuation (FDV): $46.7B
Annualized Fees: $1.1B
30D Perp Volume: $300B
Volume = ~2% of the entire stablecoin market
Valuation multiple: 42.5x fees
Aster ($ASTER):
Fully Diluted Valuation (FDV): $16.5B
Annualized Fees: $110M
30D Perp Volume: $27.7B
Valuation multiple: 150x fees
Takeaway:
While $ASTER has seen explosive early performance, the fee-to-FDV ratio is stretched. Meanwhile, GETTEX:HYPE is already generating serious fee revenue and market share, making it fundamentally a stronger value proposition even at current levels.

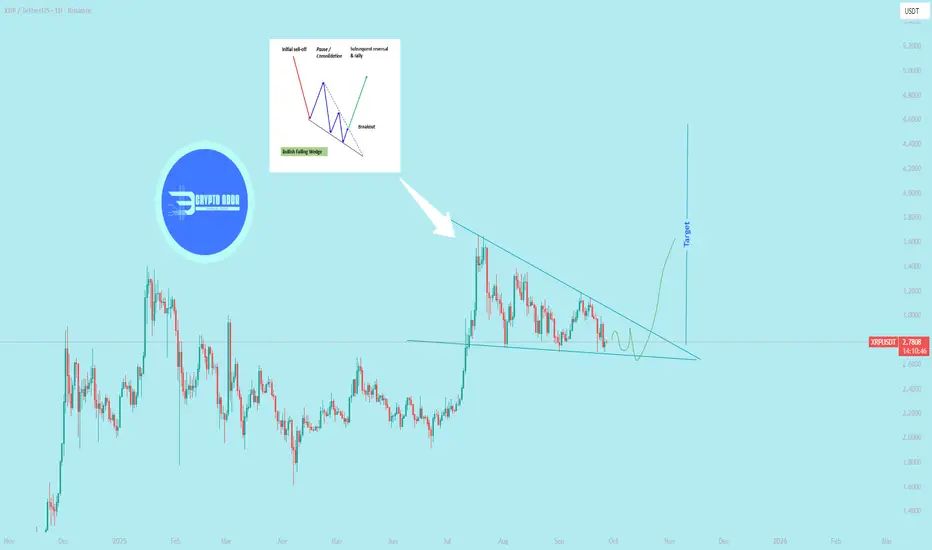
$XRP Performing falling wedge pattern in 1D
> Falling wedge as a reversal vs. continuation pattern
`As a reversal pattern`
`Location:` Occurs at the end of a prolonged downtrend.
Signal: The narrowing price action and declining volume suggest that sellers are exhausting their momentum. The pattern is completed when the price breaks above the upper resistance line, signaling a potential bullish reversal.
`As a continuation pattern`
`Location: `Appears after a strong uptrend.
Signal: The falling wedge acts as a temporary consolidation or pause in the current trend. The price then breaks out to the upside, continuing the original uptrend. @everyone
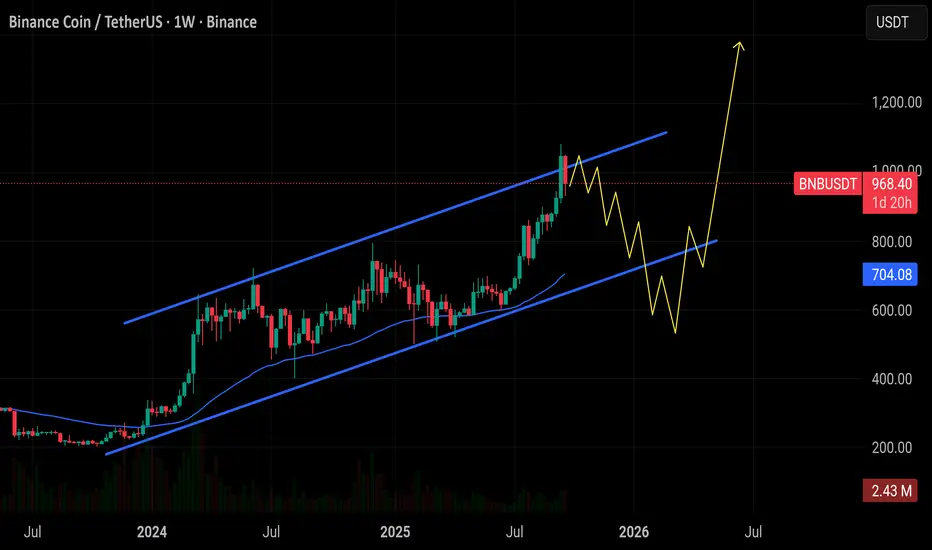
$BNB is holding near $968 with solid momentum, but ? CRYPTOCAP:BNB is holding near $968 with solid momentum, but I expect a healthy dip toward the $710–550 support zone before the next big move. That’s the area I’ll be looking to load, with eyes on a breakout toward $1,200+.
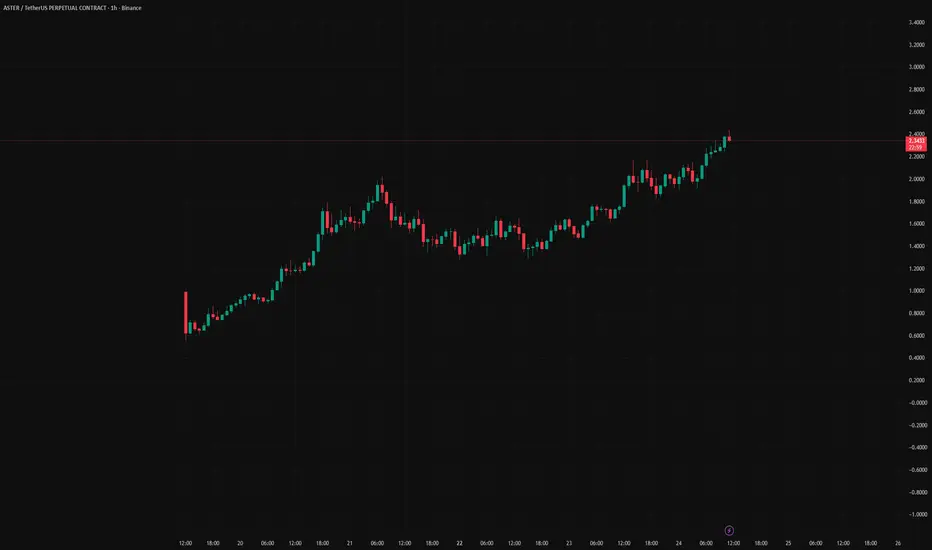
ASTER Market Update📊 ASTER Market Update
ASTER is testing the red resistance zone 🔴
If it breaks out with confirmation, the first target will be the blue line level 🎯

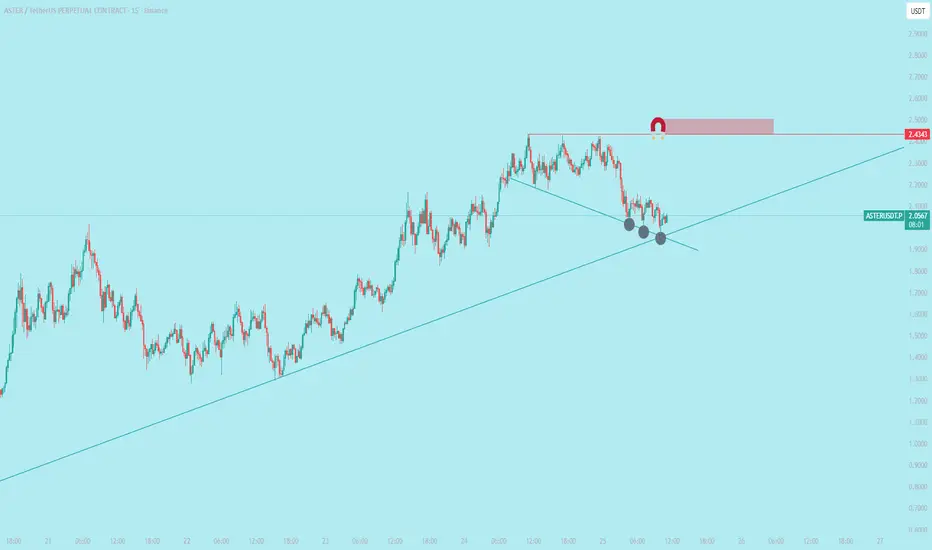
$ASTER is ready for ATH vibes again$ASTER is ready for ATH vibes again
Price Movement: The chart shows a significant uptrend from around $1,000 to a peak near $2,443, followed by a pullback to the current price of $2,049 (as of 10:44 UTC on September 25, 2025). This indicates a recent correction after hitting resistance.
Resistance Level: The horizontal red line at $2,443 acts as a key resistance level where the price struggled to break through, suggesting strong selling pressure at this point.
Support Zone: The intersection of the two trend lines (light blue upward trend and darker blue downward trend) around $2,000-$2,100 marks a potential support zone. The gray circles highlight this area where the price might find buying interest.
Trend Lines: The upward-sloping light blue line reflects the overall uptrend, while the downward-sloping darker blue line indicates a short-term correction or consolidation phase.
Volume and Momentum: While volume data isn't fully visible, the price action suggests momentum has slowed after the resistance test, with a 0.27% change indicating stability at the current level.
Outlook: The price is currently testing the support zone. A bounce from here could signal a retest of $2,443, while a break below $2,000 might lead to further downside toward $1,800-$1,900.
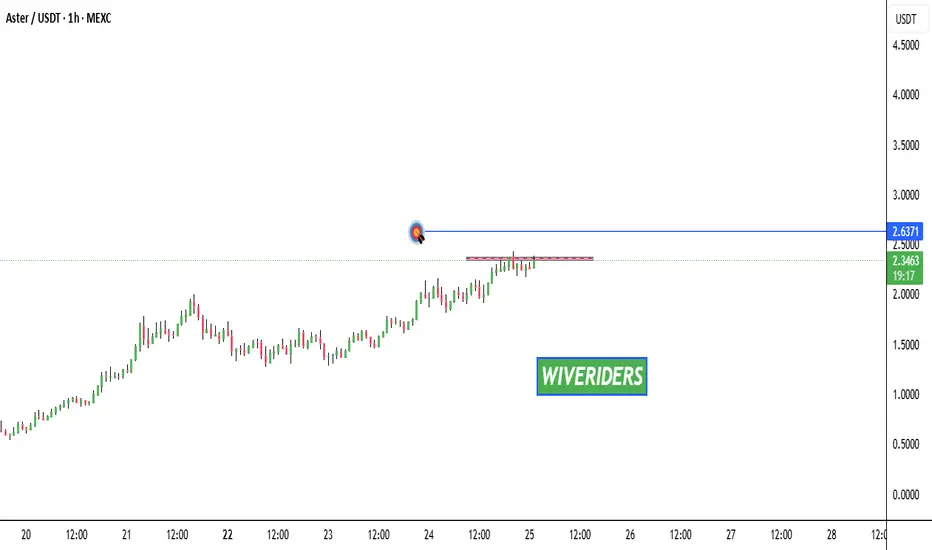
ASTER is testing the red resistance zone📊 $ASTER Market Update
$ASTER is testing the red resistance zone 🔴
If it breaks out with confirmation, the first target will be the green line level 🎯
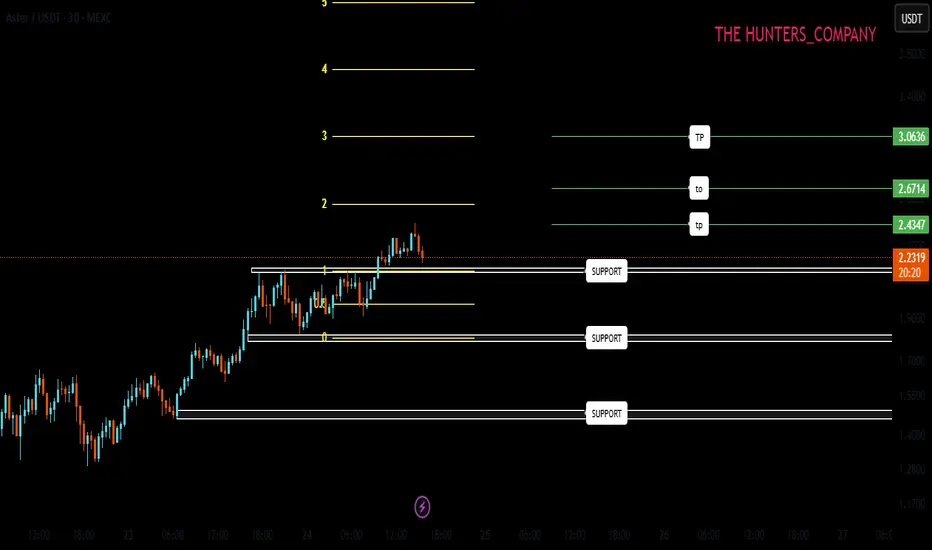
ASTER analysisHello friends
Given the upward trend of the market, we can expect a resurgence in the price during pullbacks.
Now we have identified 3 support areas that can support the price and if the price is supported, it can move to the specified targets.
*Trade safely with us*
ASTER Momentum Could Push Toward $6
Aster (ASTER) has been one of the strongest performers in the market this week, rallying over 2,000% according to multiple sources. The project positions itself as a decentralized perp DEX with features like hidden orders, multi-chain support, and even on-chain stocks trading up to 100x leverage. Backing from YZi Labs, a firm associated with Binance’s founder CZ, has further fueled speculation and attracted whales.
Why I see $6 as a realistic short-term target:
Strong Momentum — Price action shows parabolic growth with high-volume confirmation. Momentum plays like this often overshoot before retracing.
Low Float & Supply Pressure — With a limited circulating supply, ASTER reacts quickly to buying pressure.
Speculative Catalysts — CEX listings (Bitunix already listed ASTER/USDT and perps) show growing traction, and traders are betting on a potential larger exchange listing.
Market Psychology — After such rapid gains, round numbers like $5 and $6 act as magnet levels, especially when retail FOMO is high.
My Trading Plan:
Entry: Pullbacks around $2.5–$3 zones (support from recent consolidation).
Target: $6 (psychological and Fibonacci extension level).
Stop-Loss: Below $2.0 (invalidate momentum structure).
Risk Factors:
Token unlocks could flood supply.
Extremely high volatility with potential 40–60% intraday swings.
Regulatory and adoption risks for perp DEXs.
Aster: Hidden Orders, Big Players & Q4 PotentialThe #Aster vs #HYPE confrontation could be one of the key narratives of Q4.
Main driver: hidden limit orders — a feature loved by whales for reducing exposure to monitoring groups.
Key points:
Bitfinex introduced this feature back in 2017 with higher fees compared to standard orders.
Current market conditions (advanced screeners, bots, higher liquidity, and demand for anonymity) make such functionality far more relevant.
CZ’s potential comeback adds additional weight to Aster’s expansion strategy.
Analysts estimate that for Aster to match Hype’s scale, the token would need to trade at $7.83.
Our accumulation zones (if correction occurs):
$1.70 — reasonable entry
$1.40 — ideal target
$0.90 — extended wish
Question remains: will Aster evolve into a Q4 market leader, or is it simply another hype cycle?
______________
◆ Follow us ❤️ for daily crypto insights & updates!
🚀 Don’t miss out on important market moves
🧠 DYOR | This is not financial advice, just thinking out loud.
