BTCUSD Long: Small Correction and Pump to new ATHHello, traders! The prior market structure for BTCUSD saw a powerful breakout from an ascending channel, which propelled the price to a new all-time high of 125600. Following this peak, the market has entered a new consolidation phase, forming a high-level range between the new ATH and the key support area around the 120400 level.
Currently, the price is in a corrective phase within this new range. After an initial drop from the highs and a minor bounce, the auction is heading back towards the major support zone located around the 120400 level for what I believe will be a decisive test of buyer strength.
My scenario for the development of events is a successful re-accumulation within this range. I believe the price will complete its correction down to the 120400 support zone. In my opinion, a confirmed bounce from this area will signal the end of the pullback and trigger the next impulsive wave higher, breaking the top of the range. The take-profit is therefore set at 125700, targeting a new ATH. Manage your risk!
ATH

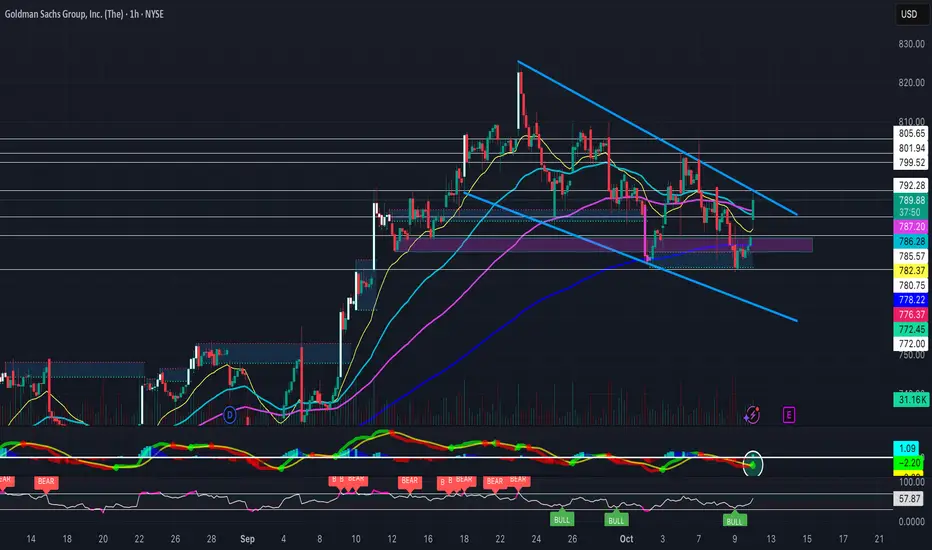
Falling Wedge Heading into EarningsAfter previously breaking out of a falling wedge to hit new ATH's, NYSE:GS is holding yet another falling wedge heading into earnings next week. (Previous Chart Below)
Its EMA's are curling upwards, some bullish hidden divergence on the RSI, a MACD golden cross, and a bullish FVG formed as support- Will definitely be watching this one.
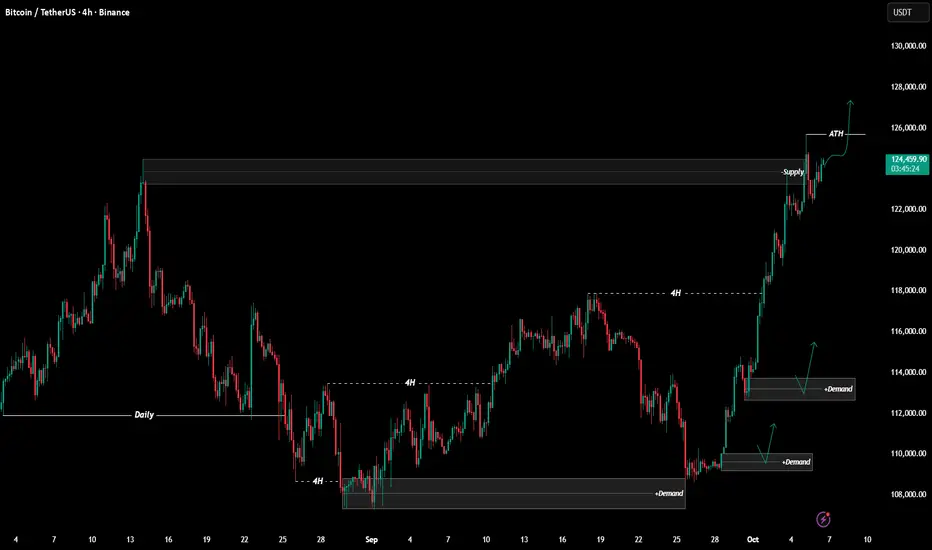
$BTCUSDT Analysis - Oct 10 | 4H Time FrameBINANCE:BTCUSD Analysis - 4H
Hello and welcome to another analysis from the Satoshi Frame team!
I’m Abolfazl, and today we’re going to analyze Bitcoin on the 4-hour timeframe.
Bitcoin’s current all time high stands at $126,199!
Price has tapped into a demand zone, which could potentially trigger a bullish move toward this high.
This zone is worth the risk, and it’s recommended to look for buy positions on the 15-minute timeframe, targeting $130,000.
See you in the next analyses!
Stay tuned with the Satoshi Frame team...

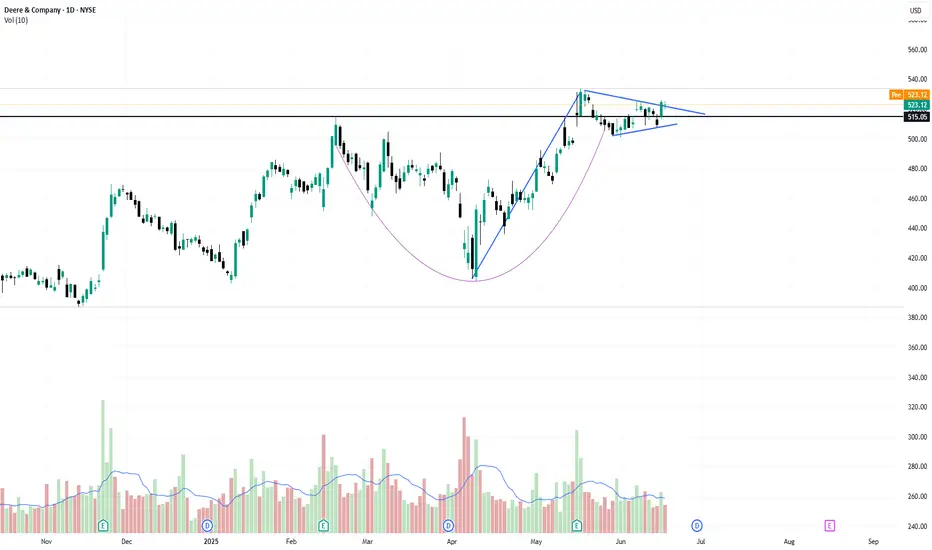
the wedge pattern breakout near ATHStock is outperforming the index and trading near its all-time high and forming a small wedge pattern, indicating consolidation before a potential breakout. A sustained move above $507.50 could trigger bullish momentum. Targeting $553 in the near term. Risk-reward remains favorable with strong price structure and bullish sentiment.
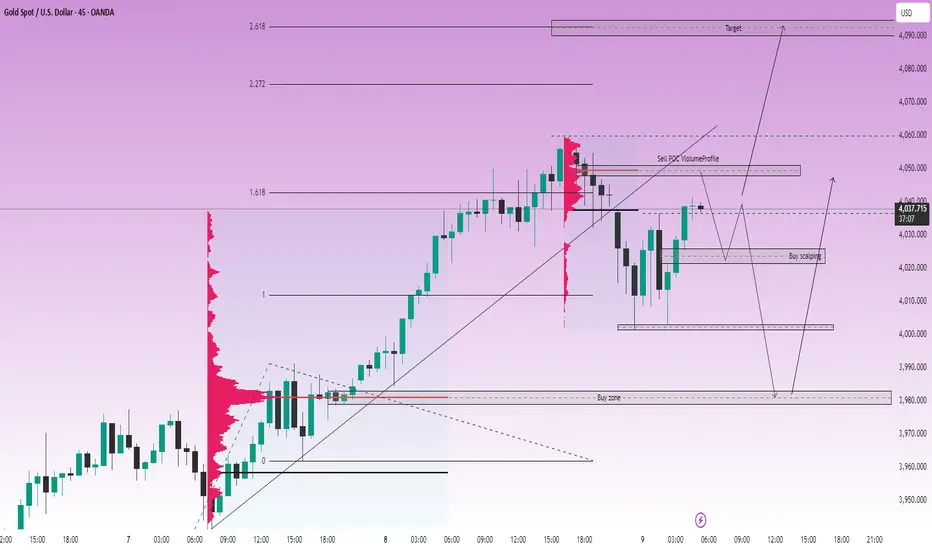
GOLD: The upward structure continues, target 4090 is approachingLiamTrading – GOLD: The upward structure continues, target 4090 is approaching
Hello everyone,
Gold and US stocks are setting new records, but don't forget — strong sell-offs often occur when everyone believes prices can only go up.
Currently, gold maintains a sustainable upward structure, with each subsequent low higher than the previous one, confirming a clear trend on the H1–H4 frames.
📊 Technical Analysis (Chart 45m – XAUUSD)
The price structure remains clearly Higher High – Higher Low, indicating that buyers still control the market.
Key liquidity zones are around:
🔹 4050–4060 (resistance – POC Volume Profile)
🔹 4020–4025 (temporary support zone – confluence Fibo 0.618)
🔹 3980 (technical bottom, strong previous liquidity zone)
The upward target according to Fibonacci Extension is currently in the 4090 zone, corresponding to the 2.618 extension level — likely to become a major profit-taking area for buyers.
🎯 Today's Trading Scenario
Short-term Sell (based on resistance reaction):
📍 4048–4050
🛑 SL: 4055
🎯 TP: 4030 – 4018 – 4005 – 3980
Buy scalping:
📍 4022–4024
🛑 SL: 4017
🎯 TP: 4030 – 4045 – 4060 – 4080
Buy swing (trend-following):
📍 3980–3982
🛑 SL: 3975
🎯 TP: 3995 – 4010 – 4025 – 4040 – 4060
🧭 Fundamental & Market Sentiment
According to the FOMC minutes from 16–17/9, most Fed officials believe that continuing to cut interest rates this year is appropriate.
This is the first time since 2020 that the Fed has officially reduced the interest rate by 0.25%, bringing the range down to 4.75% – 5.00%.
→ Cheap money + safe haven sentiment continues to be the main driver pushing gold higher.
However, with both gold and stocks reaching peaks, the risk of technical correction may occur when prices hit major liquidity zones.
📌 Conclusion
Gold is still in a stable upward trend, with a short-term target towards 4090 USD/oz.
However, watch for liquidity zones around 4050–4060 and 4000–4025 to optimize entry points, avoiding FOMO when prices are already high.
👉 I will continue to update details each trading session.
Follow me to not miss the earliest gold scenarios!
BNB; ATHHello friends
Given the recent growth we have had, the price has formed a double top pattern and is in the specified support areas, we can expect the price to be supported until the specified targets.
*Trade safely with us*

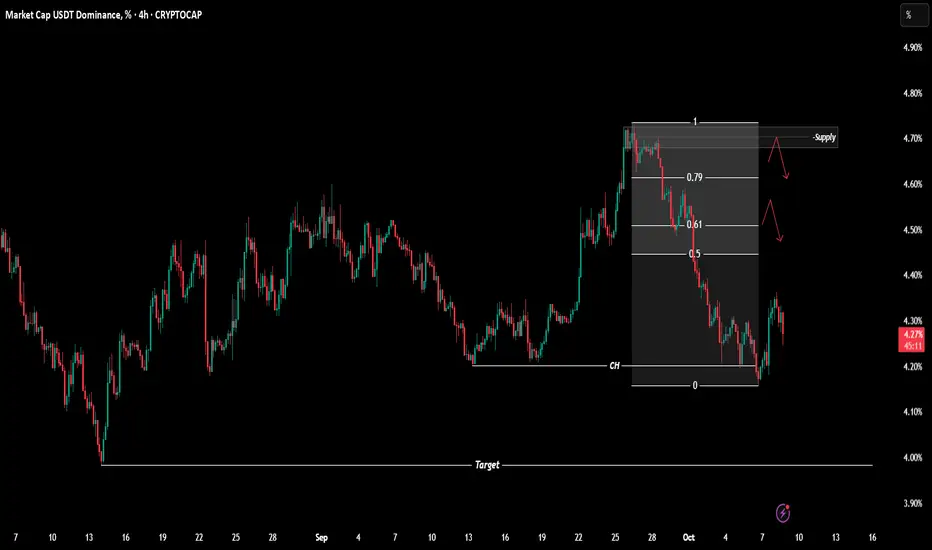
$USDT.D Analysis - Oct 8 | 4H Time FrameCRYPTOCAP:USDT.D Analysis - 4H
Hello and welcome to another analysis from the Satoshi Frame team!
I’m Abolfazl, and today we’re going to analyze Bitcoin on the 4-hour timeframe.
USDT dominance has shown a trend reversal on the 4-hour timeframe and has turned bearish.
The OTE zone and the marked supply area could act as potential rejection zones if dominance makes a short-term pullback upward.
On the other hand, we could also see another drop from the current level, moving toward the lower support area near the recent low.
The main target (4%) is already marked on the chart.
See you in the next analyses!
Stay tuned with the Satoshi Frame team...
$BTCUSDT Analysis - Oct 8 | 4H Time FrameBINANCE:BTCUSDT Analysis - 4H
Hello and welcome to another analysis from the Satoshi Frame team!
I’m Abolfazl, and today we’re going to analyze Bitcoin on the 4-hour timeframe.
Bitcoin has been rejected from the $120,000 level, and we currently expect it to move toward the all-time high.
You can look for entry confirmations on the 15-minute timeframe.
See you in the next analyses!
Stay tuned with the Satoshi Frame team...

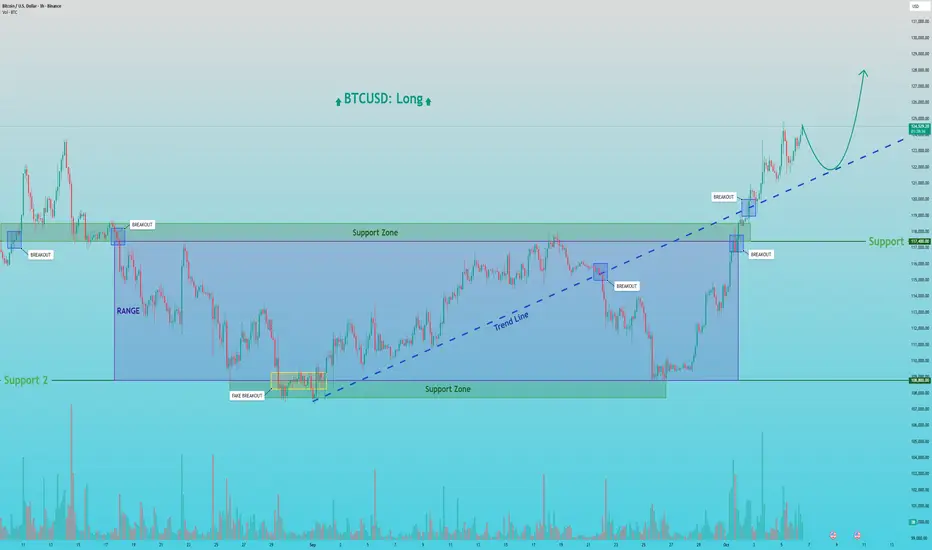
BTCUSD: Is This the Breakout to a New All-Time High?Hello everyone, here is my breakdown of the current Bitcoin setup.
Market Analysis
From a broader perspective, the price action for Bitcoin has been complex, culminating in a powerful breakout. After a fake breakdown below the 108800 Support level, the price reversed strongly, broke out of its consolidation range, and also pushed above a major trend line.
This series of events shows significant bullish strength. Currently, after this strong breakout, the price is in a natural corrective phase, pulling back to retest the broken structures from above.
My Scenario & Strategy
My scenario is built on the idea that this breakout is valid and the uptrend will continue. I see the current pullback as a classic retest, offering a potential opportunity to join the new bullish momentum.
I'm looking for the price to complete its correction to the broken trend line. A confirmed and strong bounce from this line would be the key signal for me that the pullback is over and the primary trend is ready to resume.
Therefore, the strategy is to watch for this bounce. A successful defense of the trend line would validate the long scenario. My new target for the next impulsive wave higher is 128000, which would be a new ATH.
That's the setup I'm tracking. Thank you for your attention, and always manage your risk.
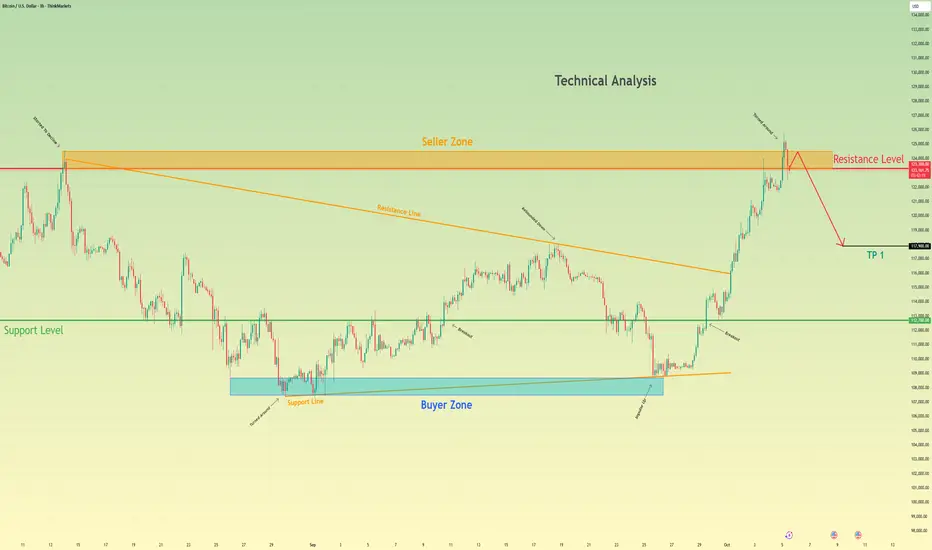
Bitcoin can Fail its Retest and Fall to 117900 pointsHello traders, I want share with you my opinion about Bitcoin. The market for Bitcoin has shown a significant sign of exhaustion and reversal after establishing a new all-time high at the 126000 level. Although this peak was preceded by a strong breakout from a prior downward wedge, the rally failed to sustain, leading to a sharp sell-off. This has shifted the market structure to a bearish bias, confirmed by a decisive breakdown below the key 123300 level. Currently, the price of BTC is in a minor corrective phase, rallying back towards this broken structure. This price action is setting up a classic retest of former support as new resistance. In my mind, this retest presents a high-probability opportunity for sellers. I expect that the price will make a small upward movement into the seller zone near 123300. I think a confirmed rejection from this area will validate the bearish reversal and trigger the next impulsive move downwards. Therefore, I have placed my TP at 117900, targeting a significant area of prior price action and liquidity. Please share this idea with your friends and click Boost 🚀
Disclaimer: As part of ThinkMarkets’ Influencer Program, I am sponsored to share and publish their charts in my analysis.
XAU/USD | Gold Update – Calm Before the $4,000 Breakout?I was about to drop a full gold analysis for you today, but honestly — the chart isn’t showing anything super clean or exciting right now.
So here’s a quick summary instead 👇
Price is still following its bullish momentum, and I’m expecting gold to reach $4,000 within the next day or two.
If we see a solid close and stability above $4,000, my next target will be around $4,084.
Key Demand Zones:
• $3927–$3934
• $3900–$3908
Keep an eye on how price reacts to these levels — any sharp rejection or bounce here could confirm the next wave up.
Also, note that gold has just made a new ATH at $3,970 — a good sign that momentum’s still alive.
Stay tuned — I’ll post the full technical analysis soon once the setup gets clearer.

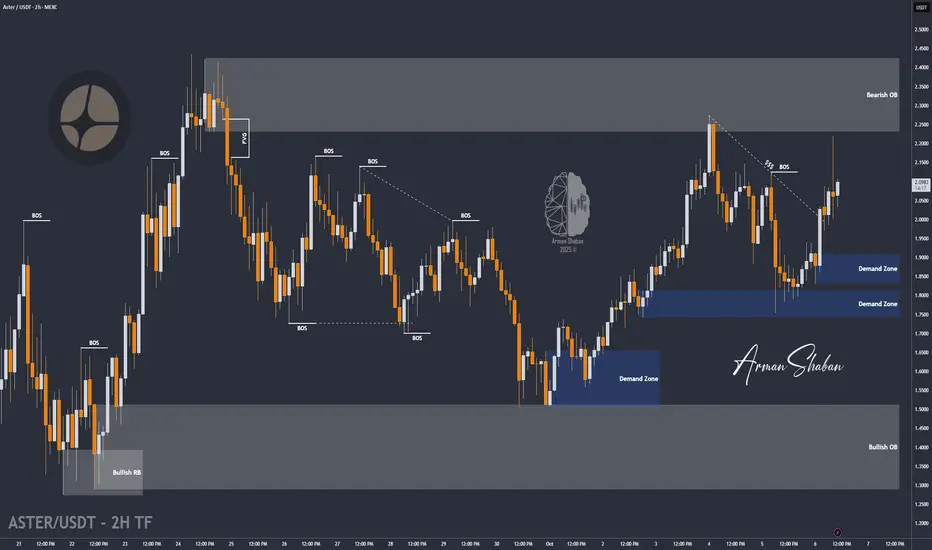
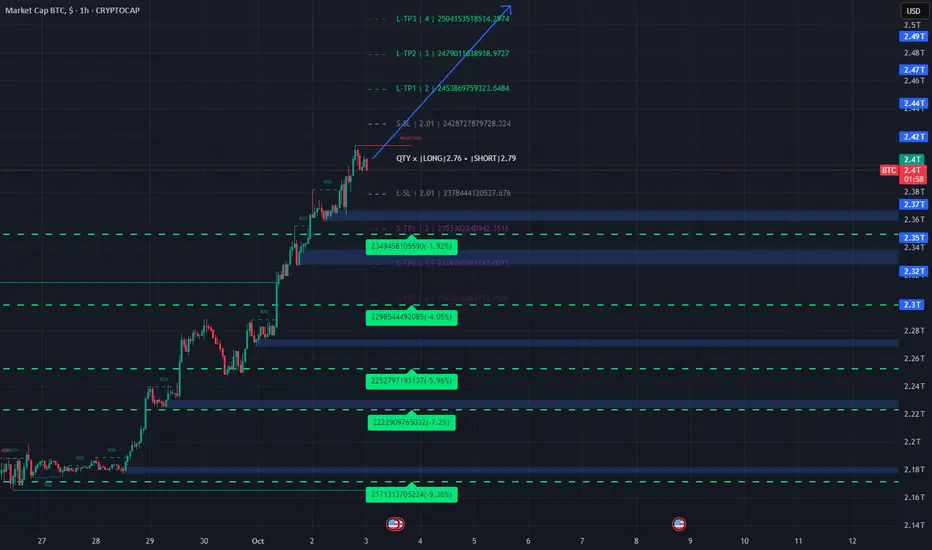
ASTER/USDT | +7000% Since Listing, What’s Next?By analyzing the Aster (ASTR) chart on the 2-hour timeframe, we can see that the price is currently trading around $2.08. Since its listing, this crypto has surged over 7000%, but later experienced a heavy drop. Now it’s consolidating within a key range — making it a high-risk, high-reward setup for early investors.
The first major support zone is between $1.83–$1.91, while the medium-term upside targets are $2.22, $2.38, and $2.50.
Please support me with your likes and comments to motivate me to share more analysis with you and share your opinion about the possible trend of this chart with me !
Best Regards , Arman Shaban
$XAUUSD Analysis - Oct 6 | 15m Time FrameFX:XAUUSD Analysis - 15m
Hello and welcome to another analysis from the Satoshi Frame team!
I’m Abolfazl, and today we’re going to analyze XAUUSD on the 15-minute timeframe.
Gold is showing a strong bullish trend on the 15-minute timeframe, so I recommend avoiding sell positions and focusing only on buy setups.
The marked zones are suitable for trading opportunities.
Price may also react to Fibonacci levels, and the OTE range offers a good area for potential entries.
See you in the next analyses!
Stay tuned with the Satoshi Frame team...

$BTCUSDT Analysis - Oct 6 | 4H Time FrameBINANCE:BTCUSDT Analysis - 4H
Hello and welcome to another analysis from the Satoshi Frame team!
I’m Abolfazl, and today we’re going to analyze Bitcoin on the 4-hour timeframe.
After reaching a new all-time high and making a slight correction, Bitcoin has started moving upward again and could rise up to $127,000
If we see any trend reversal in Bitcoin, we’ll discuss it in future analyses.
On the lower timeframe (15 minutes), you can look for buy positions targeting $127,000** and $130,000.
See you in the next analyses!
Stay tuned with the Satoshi Frame team...
06/10/25 Weekly OutlookLast weeks high: $125,735.08
Last weeks low: $111,559.20
Midpoint: $118,6547.14
New All Time High for Bitcoin in the first week of "Uptober", really impressive strength since flipping $117,500.
BTC still finds itself within a range between ATH and $108,000 but with such strength on the bounce from range lows, could we see price discovery going into the last leg of the year?
From a macro perspective month/quarter end is now over and done with, banks have completed their window dressing/de-risking and we can expect liquidity to flow back into the risk markets. Rate cut cycle continues, M2 Global money supply at ATH with seemingly no plans to stop in the near future.
For now I am still treating trading BTC as it is in a range until we get price acceptance above $125,000. If there is a breakout above and a rally altcoins should follow. In terms of news releases this week because of the US Government shutdown there is a disruption on data releases but overall nothing of great importance is disrupted.
Good luck this week everybody!

XAUUSD - Will Gold Hit $4,000?!Gold is trading above the EMA200 and EMA50 on the hourly chart and is trading in its medium-term ascending channel. A correction towards the demand zone will provide us with a better risk-reward buying opportunity. It should be noted that these positions are intended to hedge against this uptrend.
In early Monday trading in Asian markets, global gold prices surpassed $3,900 per ounce for the first time, driven by stronger demand for safe-haven assets amid the U.S. government shutdown and rising expectations of further Federal Reserve rate cuts.
Goldman Sachs once again reaffirmed its bullish outlook on gold, calling it its “most favored long-term commodity asset”, even as the precious metal continues to reach new record highs. Analysts at the bank believe the upward momentum remains intact.
Goldman forecasts that gold will reach $4,000 by mid-2026 and $4,300 by December 2026. However, the bank cautioned that upside risks beyond these projections are emerging. Notably, speculative flows account for only about 1% of the recent 14% rally, signaling stronger and more sustainable support from ETFs and central banks.
Marc Chandler, CEO of Bannockburn Global Forex, commented: “Gold has risen for the seventh consecutive week, having declined in only one week since late July. The U.S. government shutdown, Europe’s debate over reusing Russian reserves, and ongoing hybrid tensions across Europe have all contributed to this rally.” He added, “A short-term support level has formed near $3,800, and reaching $4,000 no longer seems far-fetched.”
Similarly, Darin Newsom, senior market analyst at Barchart.com, noted: “The market trend remains bullish. The U.S. economy has not improved—if anything, it has deteriorated further. Central banks and global investors clearly recognize this and continue accumulating gold.”
For this week, considerable uncertainty surrounds the U.S. data release calendar. If Democrats and Republicans manage to reach an agreement on a temporary funding bill early in the week, the September employment report could be released on schedule Friday. Estimates suggest a modest improvement in job creation, with around 50,000 new positions, though the weak ADP private payrolls data paints a more cautious picture. Still, downside risks to employment remain, reinforcing expectations for further rate cuts.
Even if the jobs report is delayed, the ongoing government shutdown alone could drive markets to increase bets on rate reductions, as a surge in furloughed federal workers and reduced economic output from halted government operations may compel the Fed to lower borrowing costs.
Beyond Washington’s political standoff, investors’ focus this week will be on the minutes from the Fed’s September meeting, which could reveal growing divisions among policymakers over the labor market outlook.
The Fed’s latest dot plot highlights a widening gap between hawkish and dovish members, meaning any new clues in the minutes about the timing or pace of rate cuts could spark a strong market reaction.
Toward the end of the week, attention will also turn to the University of Michigan’s preliminary consumer sentiment survey, particularly the inflation expectations component, which holds significant weight for gauging domestic demand. At the same time, the U.S. Treasury market faces a busy schedule of debt auctions, adding another layer of focus for investors.

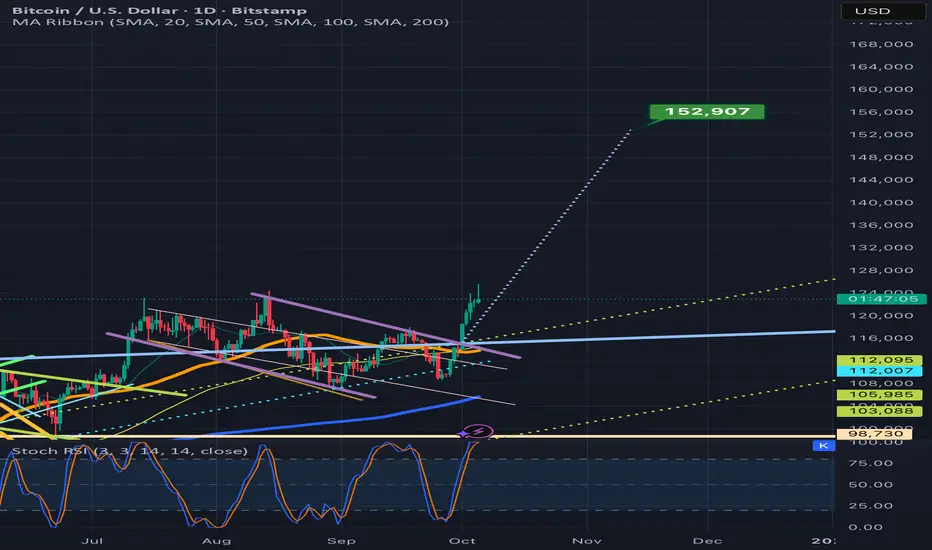
BTC just achieved a new all time high on its way to 153kFeels like it may be validating the breakout above the blue line as it also seems to be climbing up the dotted measured move line here on the last few candles. So probability is quite good that we validate the breakout on this impulse. If so the full measured move target is around 152.9k or more or less 153k. *not financial advice*
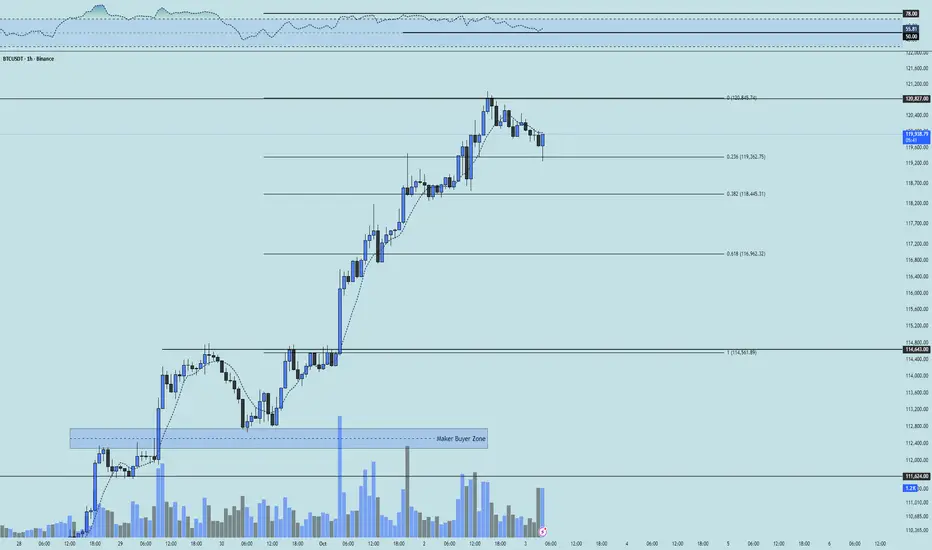
BTC 1H Analysis - Key Triggers Ahead | Day 51☃️ Welcome to the cryptos winter , I hope you’ve started your day well.
⏰ We’re analyzing BTC on the 1-Hour timeframe .
👀 On the 1-hour timeframe for Bitcoin, we can see that after this recent bullish leg, price has now reached its resistance at $120,827. If this resistance breaks — a zone packed with short orders — Bitcoin could start an extremely sharp and powerful upward leg, essentially triggering a short squeeze. At the moment, Bitcoin is entering a corrective phase; with the start of this correction, price could head down toward its Fibonacci retracement supports, bounce from one of those levels, and then form a new trading structure.
🧮 Looking at the RSI oscillator, price has been ranging around the 70 zone and briefly entered overbuy. It is now moving toward the 50 area, its oscillation mean. A break below 50 could deepen the correction, but if support holds, RSI could again head toward the resistance zone near 70 and re-test the overbought boundary.
🎮 The Fibonacci retracement drawn from the breakout at $114,562 to $120,827 highlights several strong support areas. The most important zones for Bitcoin are the 0.236 and 0.382 retracement levels. Support here, followed by a fresh structure, could set up strong trading opportunities.
🕯 The size and volume of buy candles have been exceptionally strong and increasing — something rarely seen in Bitcoin with such a one-sided move to the upside. Now, during this corrective phase, even as selling pressure appears, roughly 70% of that sell volume is being absorbed by buyers. What we must watch closely is how buyers decide to allocate capital from here. If the key Fibonacci levels are lost, we respect the market’s decision and only then consider new trades.
🧠 For a Bitcoin position If you don’t have an open position, I recommend waiting for a new structure to form at critical Fibonacci levels, and only enter after a breakout of that structure.
If you already hold a position, consider partial profit-taking, since USDT dominance has also reached an important support zone.
❤️ Disclaimer : This analysis is purely based on my personal opinion and I only trade if the stated triggers are activated .
Title: BTC/USD: Breakout Confirmed - Targeting $135K After SucceBitcoin has decisively broken and closed above the major resistance level of $120,000. Following a clean and successful retest of this level as new support, the structure confirms a strong bullish breakout.
The momentum is now building for the next leg up, with all signs pointing towards a challenge of the next significant target.
🎯 Primary Target: $135,295.5
🛡️ Major Support (Buying Zone): $118,043.66
The overall structure suggests Bitcoin is gearing up for a significant continuation pump.
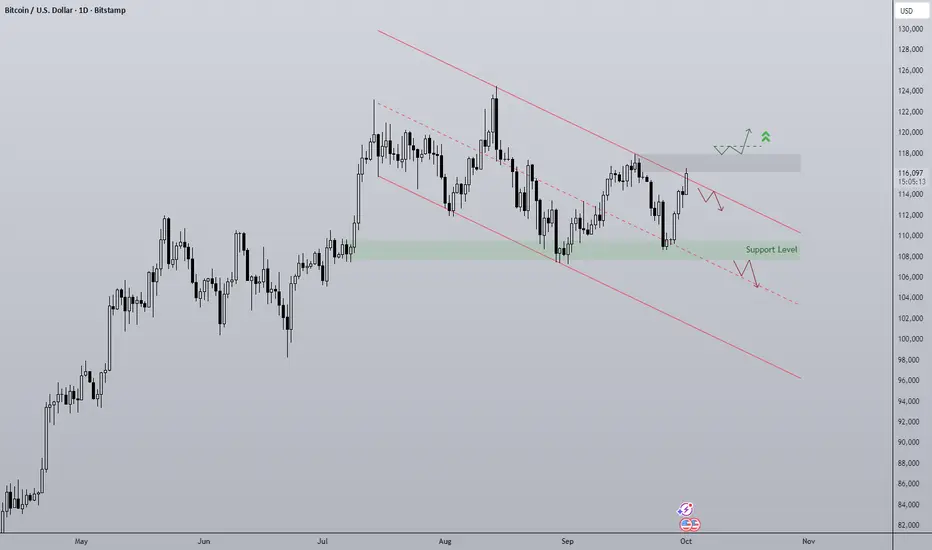
Bitcoin in Q4 As "Uptober" begins the layout for Bitcoin is as follows:
- Downtrend on the daily officially since 18th September but really it began after the SFP of ATH on August 14th.
- The origin of the rally to ATH has served as support twice since at $108,000
- Diagonal trendline resistance being tested as Q4 begins, seasonality shows October is very strong for returns, 21.89% average since 2019.
- Compression of the range inevitably leads to a breakout in either direction.
Bullish scenario is reclaim of $117,500 to push towards ATH.
Bearish scenario is a loss of $108,000
ATH Market Update📊 ATH Market Update
ATH is testing the red resistance zone 🔴
If it breaks out with confirmation, the first target will be the green line level 🎯

ETH - Near ATH… Price Discovery Reload?BINANCE:ETHUSDT ETH has marched back to its cycle ceiling on the weekly after a long range. We’re now pressing the final resistance band around $4,880–$5,000—where a clean breakout would shift ETH into price discovery again.
Confluence is strong here: prior ATH supply + round-number magnet + momentum structure. If buyers clear $5K with a weekly close, I’ll look for the next leg toward $6.5K–$7.25K, then a stretch path into five digits as discovery unfolds. If rejected, a healthy retest toward $4,100–$3,550 would keep the uptrend intact while the range persists.
What’s your plan => buy the weekly breakout above $5K, or wait for a dip into $4.1K for better risk–reward? 🤔
⚠️ Disclaimer: This is not financial advice. Always do your own research and manage risk properly.
📚 Stick to your trading plan regarding entries, risk, and management.
Good luck! 🍀
All Strategies Are Good; If Managed Properly!
~Richard Nasr

BNB/USDT | BNB Bull Run Continues – No Signs of Correction Yet!By analyzing the Binance Coin (BNB) chart on the weekly (logarithmic) timeframe, we can see that the price has set a new ATH above $1,000. Since the last time I analyzed BNB — over 2 years ago — the price has increased by more than 400%!
Currently, BNB is trading around $1,060, and there are still no signs of a correction on the chart. With the current momentum, I expect further growth, possibly pushing the price to levels above $1,200. This analysis will be updated again!
Please support me with your likes and comments to motivate me to share more analysis with you and share your opinion about the possible trend of this chart with me !
Best Regards , Arman Shaban
