AUDCAD Bullish Setup: Waiting for the Pullback📈 The AUDCAD is showing strong bullish momentum ✅. I’m watching for a pullback on the 30-minute timeframe ⏰ into equilibrium ⚖️ as a potential buy opportunity 💹. Everything is broken down in the video 🎥 (not financial advice ⚠️).
AUD (Australian Dollar)

GBP/AUD : Lets Make Crazy Money From This Sideway Movement!This is GBP/AUD chart on the daily timeframe. if u take a close look you will see that the price is moving perfectly in a sideway between absolutely 2 strong resistance and support no break for months so far.
Trading the sideway if very fun for me because i know the price boundaries and the stronger these boundaries are the less risk you take in trading the sideway movement.
in the GBP/AUD case i will enter a buy trade @ 2.04600 u can wait and enter directly or you can sell a limit order just like me to make sure that u enter the trade even if you are sleeping.
regarding the target usually the space between the support and the resistance is your target but for me taking between 300 to 400 pips will be enough i can't wait longer that this :)

AUDCAD - Trade Plan After recording this video, I also noticed that RSI and Stochastics on the 4hour are showing topping action, this give me some belief that this pair very well might correct and pullback as expected.
Happy Trading - Trade Safe..

GBPAUD Is Going Up! Buy!
Here is our detailed technical review for GBPAUD.
Time Frame: 1D
Current Trend: Bullish
Sentiment: Oversold (based on 7-period RSI)
Forecast: Bullish
The market is testing a major horizontal structure 2.051.
Taking into consideration the structure & trend analysis, I believe that the market will reach 2.072 level soon.
P.S
The term oversold refers to a condition where an asset has traded lower in price and has the potential for a price bounce.
Overbought refers to market scenarios where the instrument is traded considerably higher than its fair value. Overvaluation is caused by market sentiments when there is positive news.
Disclosure: I am part of Trade Nation's Influencer program and receive a monthly fee for using their TradingView charts in my analysis.
Like and subscribe and comment my ideas if you enjoy them!

GBP/AUD BEARS WILL DOMINATE THE MARKET|SHORT
Hello, Friends!
Previous week’s green candle means that for us the GBP/AUD pair is in the uptrend. And the current movement leg was also up but the resistance line will be hit soon and upper BB band proximity will signal an overbought condition so we will go for a counter-trend short trade with the target being at 2.047.
Disclosure: I am part of Trade Nation's Influencer program and receive a monthly fee for using their TradingView charts in my analysis.
✅LIKE AND COMMENT MY IDEAS✅

AUDJPY Short From Resistance!
HI,Traders !
#AUDJPY keeps growing
But the pair is locally overbought
So after the pair hits a horizontal
Resistance of 97.298we will
Be expecting a local correction !
Comment and subscribe to help us grow !

EUR/AUD SELLERS WILL DOMINATE THE MARKET|SHORT
Hello, Friends!
EUR/AUD pair is in the uptrend because previous week’s candle is green, while the price is evidently rising on the 3H timeframe. And after the retest of the resistance line above I believe we will see a move down towards the target below at 1.779 because the pair overbought due to its proximity to the upper BB band and a bearish correction is likely.
Disclosure: I am part of Trade Nation's Influencer program and receive a monthly fee for using their TradingView charts in my analysis.
✅LIKE AND COMMENT MY IDEAS✅

EUR-AUD Local Short! Sell!
Hello,Traders!
EUR-AUD will soon retest
A horizontal resistance
Level of 1.7940 and as it
Is a strong level we will
Be expecting a local
Bearish move down
Sell!
Comment and subscribe to help us grow!
Check out other forecasts below too!
Disclosure: I am part of Trade Nation's Influencer program and receive a monthly fee for using their TradingView charts in my analysis.

EURAUD Is Very Bullish! Long!
Please, check our technical outlook for EURAUD.
Time Frame: 4h
Current Trend: Bullish
Sentiment: Oversold (based on 7-period RSI)
Forecast: Bullish
The market is trading around a solid horizontal structure 1.785.
The above observations make me that the market will inevitably achieve 1.794 level.
P.S
We determine oversold/overbought condition with RSI indicator.
When it drops below 30 - the market is considered to be oversold.
When it bounces above 70 - the market is considered to be overbought.
Disclosure: I am part of Trade Nation's Influencer program and receive a monthly fee for using their TradingView charts in my analysis.
Like and subscribe and comment my ideas if you enjoy them!

AUD/JPY BULLISH BIAS RIGHT NOW| LONG
Hello, Friends!
AUD/JPY pair is trading in a local uptrend which know by looking at the previous 1W candle which is green. On the 1D timeframe the pair is going down. The pair is oversold because the price is close to the lower band of the BB indicator. So we are looking to buy the pair with the lower BB line acting as support. The next target is 96.919 area.
Disclosure: I am part of Trade Nation's Influencer program and receive a monthly fee for using their TradingView charts in my analysis.
✅LIKE AND COMMENT MY IDEAS✅

Potential bearish continuation?EUR/AUD is rising towards the pivot which acts as an overlap resistance that lines up with the 38.2% Fibonacci retracement and could reverse to the 1st support.
Pivot: 1.79259
1st Support: 1.77764
1st Resistance: 1.79745
Disclaimer:
The above opinions given constitute general market commentary, and do not constitute the opinion or advice of IC Markets or any form of personal or investment advice.
Any opinions, news, research, analyses, prices, other information, or links to third-party sites contained on this website are provided on an "as-is" basis, are intended only to be informative, is not an advice nor a recommendation, nor research, or a record of our trading prices, or an offer of, or solicitation for a transaction in any financial instrument and thus should not be treated as such. The information provided does not involve any specific investment objectives, financial situation and needs of any specific person who may receive it. Please be aware, that past performance is not a reliable indicator of future performance and/or results. Past Performance or Forward-looking scenarios based upon the reasonable beliefs of the third-party provider are not a guarantee of future performance. Actual results may differ materially from those anticipated in forward-looking or past performance statements. IC Markets makes no representation or warranty and assumes no liability as to the accuracy or completeness of the information provided, nor any loss arising from any investment based on a recommendation, forecast or any information supplied by any third-party.

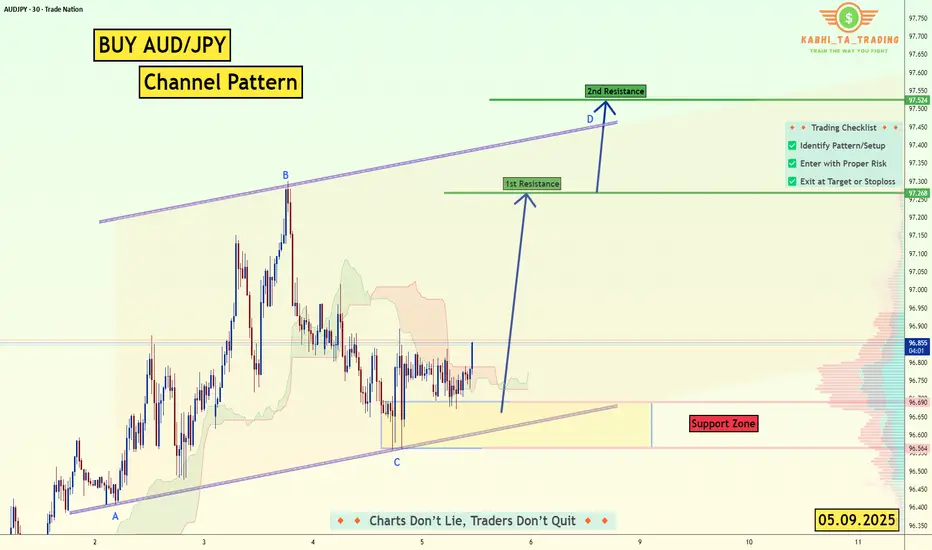
AUD/JPY - Channel Pattern (05.09.2025) The AUD/JPY pair on the M30 timeframe presents a Potential Buying Opportunity due to a recent Formation of a Channel Pattern. This suggests a shift in momentum towards the upside and a higher likelihood of further advances in the coming hours.
Possible Long Trade:
Entry: Consider Entering A Long Position around Trendline Of The Pattern.
Target Levels:
1st Resistance – 97.26
2nd Resistance – 97.52
🎁 Please hit the like button and
🎁 Leave a comment to support for My Post !
Your likes and comments are incredibly motivating and will encourage me to share more analysis with you.
Best Regards, KABHI_TA_TRADING
Thank you.
Disclosure: I am part of Trade Nation's Influencer program and receive a monthly fee for using their TradingView charts in my analysis.
Bullish continuation?AUD/JPY has bounced off the pivot, which is a pullback support, and could bounce to the 1st resistance.
Pivot: 96.68
1st Support: 96.14
1st Resistance: 97.47
Disclaimer:
The above opinions given constitute general market commentary, and do not constitute the opinion or advice of IC Markets or any form of personal or investment advice.
Any opinions, news, research, analyses, prices, other information, or links to third-party sites contained on this website are provided on an "as-is" basis, are intended only to be informative, is not an advice nor a recommendation, nor research, or a record of our trading prices, or an offer of, or solicitation for a transaction in any financial instrument and thus should not be treated as such. The information provided does not involve any specific investment objectives, financial situation and needs of any specific person who may receive it. Please be aware, that past performance is not a reliable indicator of future performance and/or results. Past Performance or Forward-looking scenarios based upon the reasonable beliefs of the third-party provider are not a guarantee of future performance. Actual results may differ materially from those anticipated in forward-looking or past performance statements. IC Markets makes no representation or warranty and assumes no liability as to the accuracy or completeness of the information provided, nor any loss arising from any investment based on a recommendation, forecast or any information supplied by any third-party.

AUD_NZD RISKY SHORT|
✅AUD_NZD is going up now
But a strong resistance level is ahead at 1.1180
Thus I am expecting a pullback
And a move down towards the target of 1.1131
SHORT🔥
✅Like and subscribe to never miss a new idea!✅

AUDNZD: Free Trading Signal
AUDNZD
- Classic bearish pattern
- Our team expects retracement
SUGGESTED TRADE:
Swing Trade
Sell AUDNZD
Entry - 1.1154
Stop - 1.1161
Take - 1.1139
Our Risk - 1%
Start protection of your profits from lower levels
Disclosure: I am part of Trade Nation's Influencer program and receive a monthly fee for using their TradingView charts in my analysis.
❤️ Please, support our work with like & comment! ❤️

GBPAUD Support Ahead!
HI,Traders !
#GBPAUD keeps falling down
In a strong local downtrend
And the pair is locally oversold
So after the pair hits the
Horizontal support of 2.04755
A local bullish correction
Is to be expected !
Comment and subscribe to help us grow !

Breakout of Head & Shoulders on AJOANDA:AUDJPY has completed a strong triple reversal pattern, the Head and Shoulders!
Price currently has broken through the Neckline or Support line and we will want to see price close underneath to validate the breakout!
Once price has closed underneath Support, we will want to wait to watch for a retest of that breakout around 96.75 with rejection to signal a successful retest!
This could deliver a great shorting opportunity!

EURAUD BUYEURAUD just swept liquidity and tapped into the H4 FVG zone, giving us a potential long bias.
After confirming the higher-timeframe setup, we zoomed into H1 where a clear CHoCH appeared.
Now I’ll be looking for a long entry if price retraces lower into my area of interest.
Let’s see how this plays out—stay tuned! 🚀

AUD-JPY Pullback Ahead! Sell!
Hello,Traders!
AUD-JPY made a nice
Retest of the horizontal
Resistance of 97.440
And we are already seeing
A local bearish reaction
So we are locally bearish
Biased and we will be
Expecting a local pullback
Sell!
Comment and subscribe to help us grow!
Check out other forecasts below too!
Disclosure: I am part of Trade Nation's Influencer program and receive a monthly fee for using their TradingView charts in my analysis.

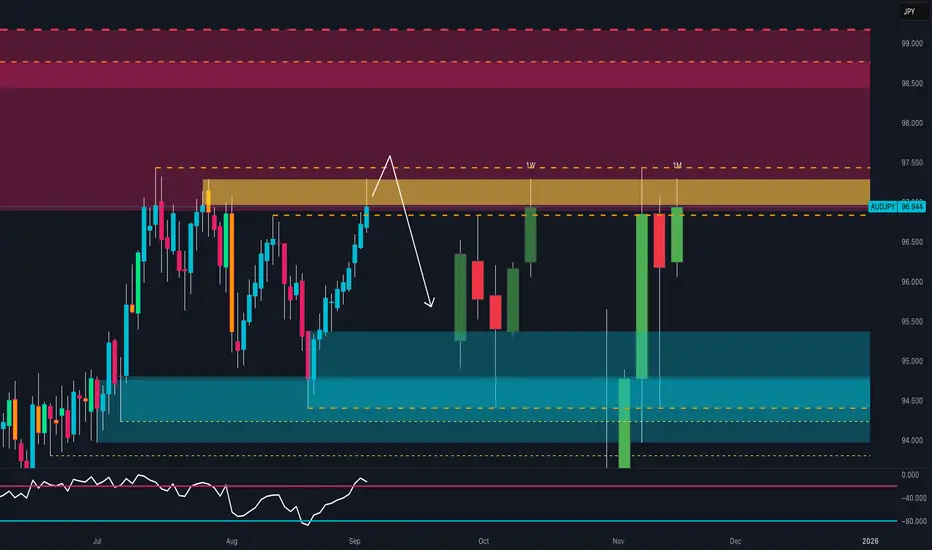
AUD/JPY at Make-or-Break Zone: Final Squeeze Before a Big Drop?1. Technical Analysis
AUD/JPY is trading around 96.90, testing the 97.00–97.50 resistance zone. This area has been rejected multiple times in the past and represents a key technical cluster. The RSI is approaching overbought territory, signaling stretched conditions. Price action shows potential exhaustion of the recent rally: the current candle is struggling to break resistance, and a rejection here could trigger a correction towards the 95.00–94.50 demand zone. Structurally, as long as there is no weekly close above 97.50, the preferred scenario remains short from resistance.
2. COT Report
AUD: Non-Commercials remain heavily net short (129k short vs 28k long). Downside pressure on the Australian Dollar remains strong, supported by institutional positioning.
JPY: Non-Commercials are skewed to the long side (170k long vs 86k short), signaling institutional demand for the Yen as a safe-haven asset.
👉 The COT combination indicates a structural bias in favor of JPY strength and AUD weakness, reinforcing the bearish AUD/JPY outlook.
3. Retail Sentiment
79% short vs 21% long. The majority of retail traders are already short, which increases the risk of a short-term squeeze. However, since price is testing a major resistance zone, upside potential remains limited. A possible “stop hunt” towards 97.50–98.00 would still align with the broader bearish setup.
4. Seasonality
AUD in September: Historically weak, with average negative returns between -0.6% and -1.6% across different time horizons.
JPY in September: Historically strong, with average positive returns of +0.5% to +1.5%.
👉 Seasonality supports a bearish view on AUD/JPY for September.
5. Strategic Outlook
AUD/JPY is at a critical turning point. The macro (COT & seasonality) and technical context support a bearish rejection from 97.00–97.50. However, retail positioning suggests the market may orchestrate one last squeeze towards 98.00 before reversing.
Suggested Strategy: Wait for confirmation of rejection or a false breakout at resistance to enter short positions, targeting 95.50 initially and 94.50 as an extension.
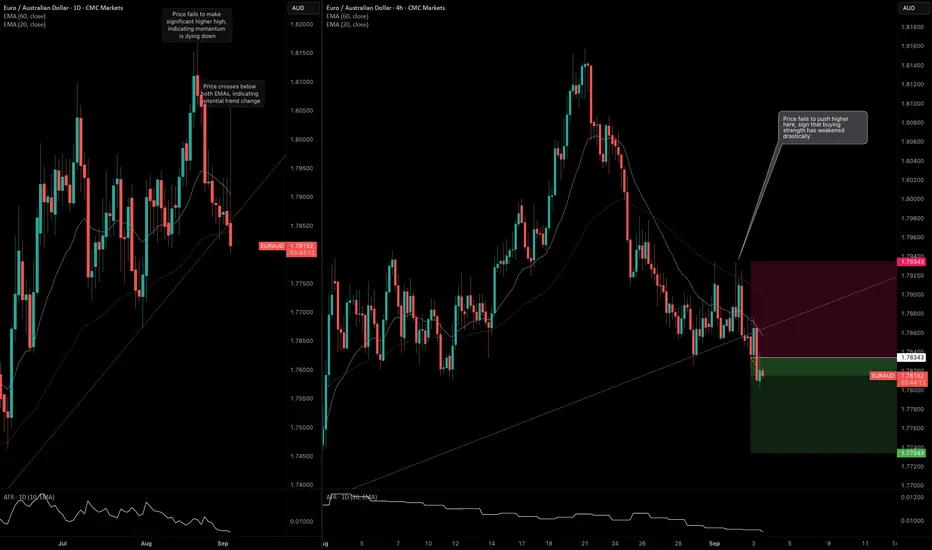
EURAUD: Ascending Trendline BreakThis is a counter-trend trade as I see exhaustion on the daily timeframe.
Daily Timeframe:
I plotted an ascending trendline on the daily timeframe. Price attempted to push to a new high on August 20th, but failed to hold. That was the first indication that the uptrend might be over.
The signal occurred when price crossed below the ascending trendline. Currently, the daily bar is active. If the current bar manages to close below the ascending trendline and tomorrow's daily bar does the same, it's safe to say that we can expect further downside.
H4 Timeframe
The bearish signal is also supported on the 4-hour timeframe. In the intraday timeframe, price made a "double top" indicating that it's not able to push higher to the upside. I'm anticipating that momentum will build up throughout the rest of the day and into tomorrow as well.
AUDCHFAUDCHF If the price can hold above 0.51620, there is a chance that the price is in an uptrend. Consider buying in the red zone.
🔥Trading futures, forex, CFDs and stocks carries a risk of loss.
Please consider carefully whether such trading is suitable for you.
>>GooD Luck 😊
❤️ Like and subscribe to never miss a new idea!

AUDCAD Is Very Bearish! Sell!
Please, check our technical outlook for AUDCAD.
Time Frame: 2h
Current Trend: Bearish
Sentiment: Overbought (based on 7-period RSI)
Forecast: Bearish
The market is approaching a significant resistance area 0.902.
Due to the fact that we see a positive bearish reaction from the underlined area, I strongly believe that sellers will manage to push the price all the way down to 0.899 level.
P.S
Overbought describes a period of time where there has been a significant and consistent upward move in price over a period of time without much pullback.
Disclosure: I am part of Trade Nation's Influencer program and receive a monthly fee for using their TradingView charts in my analysis.
Like and subscribe and comment my ideas if you enjoy them!
