AUD/USD | Going higher after BSL sweep? (READ THE CAPTION)By analysing the hourly chart of AUDUSD we can see that it barely failed to touch and sweep the liquidity pool above 0.7094 level, and it's being traded at 0.7090 at the moment. I expect liquidity sweep to happen relatively soon, and then a drop in price.
Targets for AUDUSD after the liquidity sweep: 0.7087, 0.7080, 0.7073 and 0.7066.
If it manages to stay above the 0.7094 level after the Liquidity sweep, the targets are: 0.7100, 0.7106 and 0.7112.
AUDUSD

NZD/USD | Buyside Liquidity Sweep (READ THE CAPTION)As you can see, after today's open and struggle to make a move, NZDUSD finally managed to break free of the NWOGs and make an upwards move, filling the Feb 4th NDOG and now it's being traded at 0.6051.
I expect NZDUSD to go for the liquidity above 0.6063, sweep it and then a small correction, before going back up for the next liquidity sweep above 0.6079 level.
Targets for NZDUSD: 0.6057, 0.6063, 0.6069 and 0.6075.

EUR/USD | Bearish breaker ahead! (READ THE CAPTION)By examining the hourly chart of EURUSD we can see that it has managed to sweep both liquidity pools ahead of it and no sign of slowing down, it is still going up and now it's being traded at 1.1877.
I would like to see a reaction to the bearish breaker.
For now, the targets for EURUSD are: 1.1884, 1.1891 and 1.1898.

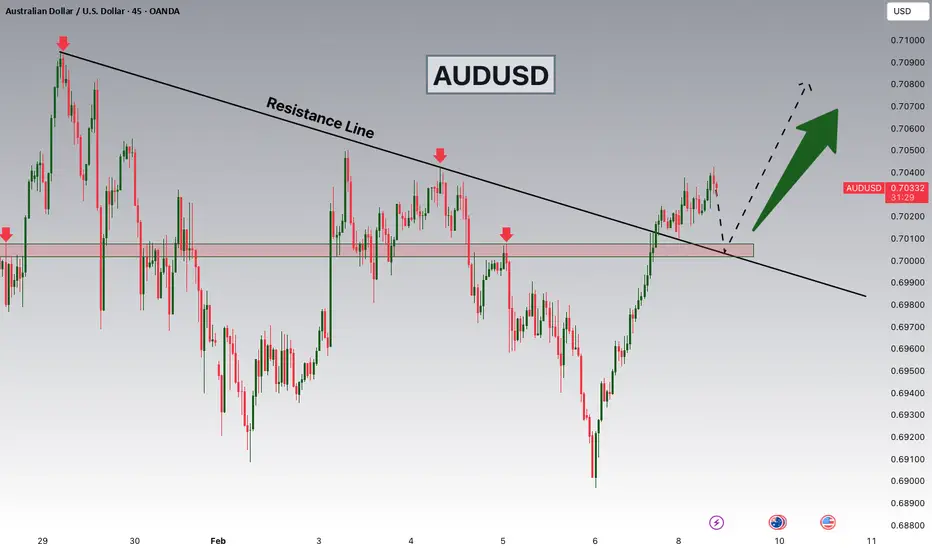
AUDUSD coiling pattern breakout support at 0.6990The AUDUSD remains in a bullish trend, with recent price action showing signs of a breakout within the broader uptrend.
Support Zone: 0.6990 – a key level from previous consolidation. Price is currently testing or approaching this level.
A bullish rebound from 0.6990 would confirm ongoing upside momentum, with potential targets at:
0.7100 – initial resistance
0.7120 – psychological and structural level
0.7140 – extended resistance on the longer-term chart
Bearish Scenario:
A confirmed break and daily close below 0.6990 would weaken the bullish outlook and suggest deeper downside risk toward:
0.6960 – minor support
0.6920 – stronger support and potential demand zone
Outlook:
Bullish bias remains intact while the AUDUSD holds above 0.6990 A sustained break below this level could shift momentum to the downside in the short term.
This communication is for informational purposes only and should not be viewed as any form of recommendation as to a particular course of action or as investment advice. It is not intended as an offer or solicitation for the purchase or sale of any financial instrument or as an official confirmation of any transaction. Opinions, estimates and assumptions expressed herein are made as of the date of this communication and are subject to change without notice. This communication has been prepared based upon information, including market prices, data and other information, believed to be reliable; however, Trade Nation does not warrant its completeness or accuracy. All market prices and market data contained in or attached to this communication are indicative and subject to change without notice.

AUDUSD | FRGNT DAILY FORECAST | Q1 | W6 | D9| Y26
📅 Q1 | W6 | D9| Y26
📊 AUDUSD | FRGNT DAILY FORECAST |
🔍 Analysis Approach
I’m applying a developed version of Smart Money Concepts, with a structured focus on:
• Identifying Key Points of Interest (POIs) on Higher Time Frames (HTFs) 🕰️
• Using those POIs to define a clear and controlled trading range 📐
• Refining those zones on Lower Time Frames (LTFs) 🔎
• Waiting for a Break of Structure (BoS) as confirmation ✅
This process keeps me precise, disciplined, and aligned with market narrative, rather than reacting emotionally or chasing price.
💡 My Motto
“Capital management, discipline, and consistency in your trading edge.”
A positive risk-to-reward ratio, combined with a high-probability execution model, is the backbone of any sustainable trading plan 📈🔐
⚠️ On Losses
Losses are part of the mathematical reality of trading 🎲
They don’t define you — they are necessary, expected, and managed.
We acknowledge them, learn, and move forward 📊➡️
🙏 I appreciate you taking the time to review my Daily Forecast.
Further context and supporting material can be found in the Links section.
Stay sharp 🧠
Stay consistent 🎯
Protect your capital 🔐
— FRGNT 🚀📈
FX:AUDUSD

AUD/USD Builds Momentum As Bulls Target Fresh GainsMarket Analysis: AUD/USD Builds Momentum As Bulls Target Fresh Gains
AUD/USD started a fresh increase above 0.6980 and 0.7000.
Important Takeaways for AUD USD Analysis Today
- The Aussie Dollar started a decent increase above 0.6950 against the US Dollar.
- There was a break above a key bearish trend line with resistance at 0.7000 on the hourly chart of AUD/USD.
AUD/USD Technical Analysis
On the hourly chart of AUD/USD, the pair started a fresh increase from 0.6900. The Aussie Dollar was able to clear 0.6950 to move into a positive zone against the US Dollar.
There was a close above 0.6980 and the 50-hour simple moving average. Besides, there was a break above a key bearish trend line with resistance at 0.7000. Finally, the pair tested 0.7035. A high was formed near 0.7037 and the pair recently started a consolidation phase.
There was a minor decline below 0.7030. On the downside, initial support is near the 23.6% Fib retracement level of the upward move from the 0.6897 swing low to the 0.7037 high.
The next area of interest could be near 0.6985, the 50% Fib retracement, and the 50-hour simple moving average. If there is a downside break below 0.6985, the pair could extend its decline toward 0.6960. Any more losses might signal a move toward 0.6910.
On the upside, the AUD/USD chart indicates that the pair is now facing resistance near 0.7035. The first major hurdle for the bulls might be 0.7050. An upside break above 0.7050 might send the pair further higher. The next stop is near 0.7090. Any more gains could clear the path for a move toward 0.7120.
This article represents the opinion of the Companies operating under the FXOpen brand only. It is not to be construed as an offer, solicitation, or recommendation with respect to products and services provided by the Companies operating under the FXOpen brand, nor is it to be considered financial advice.

AUDUSD Breakout and Potential RetraceHey Traders, in today's trading session we are monitoring AUDUSD for a buying opportunity around 0.70000 zone, AUDUSD was trading in a downtrend and successfully managed to break it out. Currently is in a correction phase in which it is approaching the retrace area at 0.70000 support and resistance area.
Trade safe, Joe.
XAGUSD: still under pressure🛠 Technical Analysis: On the H4 chart, Silver (XAGUSD) has printed a sharp reversal from the major resistance zone near 120, confirming exhaustion after the parabolic rally. Price is now trading around 86.84 and has slipped back below the mid-range resistance (around 92–96), shifting momentum to the downside. The current structure suggests a corrective phase with potential consolidation inside the 80–84 demand area before the next leg. Notably, price is still hovering just above the SMA 200, while the SMA 50 and SMA 100 remain overhead, acting as dynamic resistance. A clean breakdown and hold below the 82.03 support would open the way toward the next support cluster near 72.00. If selling pressure accelerates, the deeper support area around 63.94 becomes the extended downside target. A bullish alternative would require reclaiming 90+ and holding above the 92–96 zone, which currently looks less likely while price stays capped under those levels.
———————————————
❗️ Trade Parameters (SELL)
———————————————
➡️ Entry Point: Sell on a confirmed break below 82.03
🎯 Take Profit: 63.94
🔴 Stop Loss: 91.08
⚠️ Disclaimer: This is a potential trade idea based on current analysis; market conditions and price direction are subject to change based on news factors and volatility.

AUDUSD Pressing the Breakdown Zone: Relief Rally or Just a BetteAUDUSD is pushing up into a structure break area after a strong impulsive run, but the way price is reacting here looks more like a corrective squeeze than a clean trend continuation. We’ve got prior support turned resistance, trendline pressure, and a macro backdrop that still doesn’t fully favor sustained AUD strength. From my perspective, this is the kind of spot where you don’t chase green candles — you map the reaction and let the level decide. Either we reclaim and hold above resistance and rotate higher, or this becomes a classic lower-high setup before another leg down.
Current Bias
Neutral to bearish
Short term momentum is up, but location is weak — price is testing a resistance cluster and prior breakdown structure. Unless we get firm acceptance above the resistance band, the bias favors rejection and rotation back toward lower supports.
Key Fundamental Drivers
US side: US services PMI remains in expansion while inflation risk is still sticky enough to keep the Fed cautious. That keeps USD broadly supported on dips.
Fed policy: Restrictive hold, with markets highly sensitive to CPI and labor data. Cuts are expected later, not imminent — USD not structurally weak yet.
Australia side: Inflation has shown persistence, but growth is uneven and highly exposed to China demand and global trade flows.
China linkage: Mixed China price and activity data limits strong AUD upside follow-through.
Rate spread: Still modestly USD-supportive overall.
Macro Context
Interest rate expectations: Fed on hold at restrictive levels; RBA cautious and data-dependent. Policy spread still leans USD even if no new hikes are expected.
Economic growth trends: US growth is slowing but still expanding in services. China growth signals are uneven, which matters directly for AUD.
Commodity flows: Oil has seen inventory draws and geopolitical premium, but bulk commodity demand signals are not strongly accelerating — limiting AUD tailwinds.
Geopolitical themes: Elevated geopolitical tension supports USD and safe-haven flows at times, which indirectly pressures AUD.
Primary Risk to the Trend
The main risk to the bearish case is a soft US CPI or weak US labor print that sharply weakens USD and compresses yield expectations. That would support a breakout and hold above resistance instead of rejection.
A strong China upside surprise is the secondary upside risk for AUD.
Most Critical Upcoming News/Event
US CPI (top tier)
US labor market releases
China inflation and activity data
RBA communication
These will drive rate spread expectations and risk sentiment — both critical for AUDUSD.
Leader/Lagger Dynamics
AUDUSD is generally a risk and China-sensitivity lagger.
It tends to follow:
Equity indices
China data
Broad USD direction set by EURUSD and DXY
It can influence:
NZDUSD (often moves in tandem, AUD usually leads NZD slightly)
AUD crosses like AUD/JPY and AUD/NZD
It is not the primary USD leader — it reacts more than it drives.
Key Levels
Support Levels:
0.6910 — near-term structure support (breakdown trigger zone)
0.6765 area — secondary support
0.6595 major lower demand zone
Resistance Levels:
0.7020–0.7050 resistance band
0.7090–0.7100 upper resistance zone
Stop Loss (SL):
Above 0.7100 for bearish setup invalidation
Take Profit (TP):
TP1: 0.6910
TP2: 0.6765
TP3: 0.6595 (extended move)
Summary: Bias and Watchpoints
AUDUSD is testing a resistance and structure-break zone, and my bias stays neutral to bearish unless price can firmly hold above the 0.7020–0.7100 band. The macro backdrop still favors USD slightly, with Fed policy restrictive and China-linked growth signals mixed — not ideal conditions for sustained AUD strength. The key invalidation for the bearish view sits above 0.7100, while downside targets line up at 0.6910, then 0.6765 and potentially 0.6595 if risk sentiment weakens. The biggest watchpoint is US CPI — that print likely decides whether this becomes a breakout continuation or a rejection and rollover.

AUDUSD Weekly Smart Money Map As Liquidity Shifts Control Price AUDUSD has completed a strong impulsive expansion from the accumulation base and is now transitioning into a distribution–rebalancing phase.
The current price action shows Smart Money shifting from aggressive markup into controlled liquidity rotation, with price respecting clear premium and discount boundaries rather than trending freely.
The prior bullish leg has already achieved its objective:
buy-side liquidity above structure highs has been tapped, inefficiencies have been filled, and price is now reacting inside a corrective framework — a classic SMC environment favoring fade-at-zones, not breakout chasing.
🌐 Market Context (This Week’s Hot AUD News)
AUDUSD volatility this week is driven by:
Ongoing USD sensitivity ahead of US CPI & Fed speakers
Shifting risk sentiment tied to equities and China-related data
RBA maintaining a cautious stance, limiting AUD upside momentum
Market positioning favoring mean reversion and liquidity grabs
This macro backdrop supports range-based Smart Money execution, not trend continuation.
📊 Market Structure & Liquidity Read
Accumulation → impulsive rally already completed
Buy-side liquidity above recent highs partially consumed
Price now reacting from premium into a corrective pullback
Clear HTF discount zone aligned with prior breakout base
Premium zone above acting as a liquidity inducement area
Smart Money Logic:
Induce at premium → rotate lower to rebalance → decide next expansion.
🔑 Key Weekly Trading Scenarios
🟢 Discount Buy Setup — Smart Money Re-Accumulation
BUY AUDUSD: 0.69125 – 0.68970
SL: 0.68356
Confluence:
HTF demand & breakout retest zone
Sell-side liquidity pool below range lows
Corrective leg completion area
Execution rule:
Only enter after LTF bullish CHoCH / BOS confirmation.
Expectation:
Reaction from discount → rotation back toward equilibrium / premium.
🔴 Premium Sell Setup — Liquidity Fade
SELL AUDUSD: 0.70942 – 0.71150
SL: 0.71480
Confluence:
Premium pricing after impulsive move
Prior buy-side liquidity zone
Potential distribution / exhaustion area
Expectation:
Rejection from premium → pullback toward discount liquidity.
Bias & Execution Notes
Weekly bias: Rotational, liquidity-driven
Avoid breakout chasing
Let price deliver into Smart Money zones
Confirmation > anticipation
AUDUSD is not trending randomly this week —
it’s rotating where liquidity is most vulnerable.

AUDUSD WEEK 6 ANALYSISAUDUSD has seen a nice push to the upside. Seeing how strong the current resistance zone is, I would favor bearish momentum. This is identical to the same 2020 momentum. Trade wisely!

AUD-USD Free Signal! Sell!
Hello,Traders!
AUDUSD reacts from a well-defined horizontal supply area after a strong bullish push. Rejection and bearish displacement indicate smart money distribution, favoring continuation toward lower liquidity.
--------------------
Stop Loss: 0.7024
Take Profit: 0.6984
Entry: 0.7017
Time Frame: 2H
--------------------
Sell!
Comment and subscribe to help us grow!
Check out other forecasts below too!
Disclosure: I am part of Trade Nation's Influencer program and receive a monthly fee for using their TradingView charts in my analysis.

Q1 | W6 | Y26 AUDUSD | FRGNT WEEKLY FORECAST | 📅 Q1 | W6 | Y26
📊 AUDUSD | FRGNT WEEKLY FORECAST |
🔍 Analysis Approach
I’m applying a developed version of Smart Money Concepts, with a structured focus on:
• Identifying Key Points of Interest (POIs) on Higher Time Frames (HTFs) 🕰️
• Using those POIs to define a clear and controlled trading range 📐
• Refining those zones on Lower Time Frames (LTFs) 🔎
• Waiting for a Break of Structure (BoS) as confirmation ✅
This process keeps me precise, disciplined, and aligned with market narrative, rather than reacting emotionally or chasing price.
💡 My Motto
“Capital management, discipline, and consistency in your trading edge.”
A positive risk-to-reward ratio, combined with a high-probability execution model, is the backbone of any sustainable trading plan 📈🔐
⚠️ On Losses
Losses are part of the mathematical reality of trading 🎲
They don’t define you — they are necessary, expected, and managed.
We acknowledge them, learn, and move forward 📊➡️
🙏 I appreciate you taking the time to review my Daily Forecast.
Further context and supporting material can be found in the Links section.
Stay sharp 🧠
Stay consistent 🎯
Protect your capital 🔐
— FRGNT 🚀📈
FX:AUDUSD

Technical Pullback or Early Signs of Trend Weakness?Hello everyone, let’s take a look at AUDUSD on the H4 timeframe.
After a fairly smooth and extended rally, AUDUSD has entered a clear corrective phase. Price has slipped below the fast EMA, while the medium-term EMA — the level that previously supported the entire uptrend — is now being tested but not decisively broken. This is a very familiar post-trend state: the market is no longer euphoric, yet not weak enough to signal a full reversal.
From a structural perspective, the current decline carries more characteristics of a technical pullback than a complete trend deterioration. Buying momentum has slowed as new highs lose their dominance, but on H4 the sequence of higher lows is still intact. Price is reacting directly around the medium-term EMA — a dynamic support that worked effectively throughout the prior rally — and the fact that downside range has not expanded suggests selling pressure is more corrective than aggressive.
Volume during the pullback has increased compared to the prior consolidation phase, reflecting profit-taking after the uptrend, but not to a degree that would qualify as strong distribution. In other words, the market is releasing pressure rather than entering a capitulation phase.
From an experience-based perspective, this is the zone where the market must answer a key question: is the uptrend still being defended? If the medium-term EMA continues to hold and price shows renewed acceptance above it, this correction is likely to function as a rebalancing phase before trend continuation. Conversely, a clear H4 close below the medium-term EMA, accompanied by a break of the higher low structure, would signal that the trend is beginning to lose its foundation.
In terms of context, AUDUSD remains influenced by the divergence in policy expectations between the Fed and the RBA, as well as global risk sentiment. These factors will ultimately determine whether the current pullback remains a purely technical move or evolves into a broader phase of weakness.

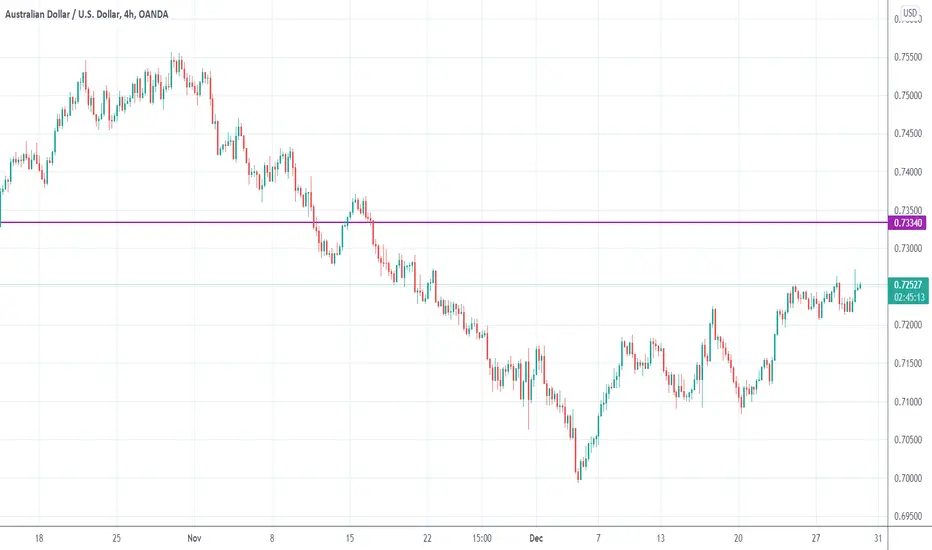
0.73340 is a must be touched target for AUDUSDBased on the correlation between AUDUSD, EURUSD, GBPUSD and USDCHF, 0.73340 is a to be soon expected target for AUDUSD
AUDUSD LOCAL SHORT|
✅AUDUSD rallies into a premium supply PD array after bullish expansion. Rejection from supply and bearish displacement favor a pullback lower, targeting sell-side liquidity below recent lows. Time Frame 2H.
SHORT🔥
✅Like and subscribe to never miss a new idea!✅

NZDUSD: false breakout setup🛠 Technical Analysis: On the H4 chart, NZDUSD remains in a broader bullish structure after the earlier “global bullish signal” from the base. The recent pullback formed a corrective descending channel, but the latest dip produced a clear false breakout below the lower boundary. Price has now reclaimed the key demand area around 0.5989–0.5991, turning it back into near-term support. The pair is holding above the rising SMA100 and SMA200, suggesting the short-term trend is still constructive despite the correction. A sustained hold above the reclaimed support increases the odds of a push back to the upper resistance zone near 0.6086. If price slips back below 0.5989 and fails to recover quickly, the bullish scenario weakens and the move could extend toward lower supports.
———————————————
❗️ Trade Parameters (BUY)
———————————————
➡️ Entry Point: 0.59893
🎯 Take Profit: 0.60857
🔴 Stop Loss: 0.59255
⚠️ Disclaimer: This is a potential trade idea based on current analysis; market conditions and price direction are subject to change based on news factors and volatility.

EUR/USD | Going to the bearish breaker (READ THE CAPTION)Good afternoon folks, Amirali here.
As you can see in the hourly chart of EURUSD, in the early hours of today, it reached the Bullish OB zone, then Swept the liquidity pool and then went up, hitting the IFVG and then gone above it, now being traded at 1.1796.
I'm eying the Bearish Breaker for a potential reversal. However if it goes through the bearish breaker, the targets are: 1.1805, 1.812, 1.819 and 1.1826.
If it reacts to the Bearish Breaker, the targets are: 1.1790, 1.1784, 1.1778 and 1.1772.

AUDUSD: Short Trade with Entry/SL/TP
AUDUSD
- Classic bearish pattern
- Our team expects retracement
SUGGESTED TRADE:
Swing Trade
Sell AUDUSD
Entry - 0.6985
Stop - 0.7002
Take - 0.6958
Our Risk - 1%
Start protection of your profits from lower levels
Disclosure: I am part of Trade Nation's Influencer program and receive a monthly fee for using their TradingView charts in my analysis.
❤️ Please, support our work with like & comment! ❤️

AUDUSD Will Go Down! Short!
Take a look at our analysis for AUDUSD.
Time Frame: 4h
Current Trend: Bearish
Sentiment: Overbought (based on 7-period RSI)
Forecast: Bearish
The market is testing a major horizontal structure 0.697.
Taking into consideration the structure & trend analysis, I believe that the market will reach 0.689 level soon.
P.S
Please, note that an oversold/overbought condition can last for a long time, and therefore being oversold/overbought doesn't mean a price rally will come soon, or at all.
Like and subscribe and comment my ideas if you enjoy them!

AUDUSD Rally Into Sell Zone | Strong Dollar Theme Returns!Hey Traders,
In today’s trading session we are monitoring AUDUSD for a potential selling opportunity around the 0.70200 zone.
AUDUSD remains in a clear downtrend and is currently in a corrective pullback, approaching a confluence resistance area near 0.70200, where the descending trendline aligns with a key support-turned-resistance zone. This area could act as a sell-the-rally level if bearish momentum returns.
From a fundamental perspective, the recent Fed Chair nomination of Kevin Warsh is viewed as hawkish, which may support short-term USD strength. A stronger dollar typically pressures risk currencies like the Australian dollar, adding fundamental confluence to the bearish technical outlook.
As always, wait for confirmation and manage risk.
Trade safe,
Joe.

AUD-USD Free Signal! Sell!
Hello,Traders!
AUDUSD breaks decisively below a well-respected horizontal supply zone, confirming bearish structure shift. Acceptance below supply signals smart money distribution and continuation toward lower liquidity.
--------------------
Stop Loss: 0.6993
Take Profit: 0.6939
Entry: 0.6971
Time Frame: 2H
--------------------
Sell!
Comment and subscribe to help us grow!
Check out other forecasts below too!
Disclosure: I am part of Trade Nation's Influencer program and receive a monthly fee for using their TradingView charts in my analysis.

AUD/USD | Where to next? (READ THE CAPTION)As you can see, after hitting the Consequent Encroachment of the Feb 2nd's NWOG, AUDUSD went back up from 0.6958 to 0.6990, and then dropped again just above the high of the NWOG, and is now being at 0.6970.
I expect AUDUSD to retest the IFVG, but before that it may fall back to the Feb 2nd NWOG.
If it holds above the NWOG, the targets are: 0.6978, 0.6988, 0.6998 and 0.7008.
If it fails to hold above the NWOG: 0.6966, 0.6958, 0.6950 and 0.6942.
