XAU/USD | Gold Setup Before FOMC – Big Move Coming Soon!By analyzing the Gold (XAUUSD) chart on the 2-hour timeframe, we can see that after the previous analysis, gold rose to $3,970 before facing heavy selling pressure that pushed it down to $3,908. Once price entered this demand zone, buyers stepped in again, driving gold back above $4,000.
As we marked on the chart, the $4,015–$4,050 range is a key supply zone, and today the price climbed to $4,030 before pulling back again. Gold is currently trading around $4,005, and if it holds below $4,014, we can expect a deeper decline.
Alternatively, if price breaks above $4,030, gold could aim for higher targets near $4,055 and beyond.
Keep in mind that tonight’s FOMC meeting could bring strong volatility — a rate cut of 25 basis points (to 4%) may cause short-term fluctuations, but a larger cut could trigger a sharp gold rally.
Stay cautious with your trades — I’ll update you after the FOMC results. Happy trading, guys! 💛
THE LATEST ANALYSIS :
Please support me with your likes and comments to motivate me to share more analysis with you and share your opinion about the possible trend of this chart with me !
Best Regards , Arman Shaban
AUDUSD

AUDUSD - Elliott Wave >TheoryAUDUSD - Elliott Wave >Theory
The Idea is based on Elliott wave theory
We probably finished the ABC and we can have a potential Long signal for 3 wave..

AUDUSD – corrective math in motion.Price retraces into the prior order block that broke structure, completing a textbook ABC correction inside a premium zone. Liquidity pools just above IDM hint at a sweep before continuation toward 0.63.
Strengths :
Confluence between wave symmetry, premium retracement, and liquidity structure. Clear invalidation point above IDM keeps risk defined.
Weaknesses :
AUD fundamentals (RBA policy shifts, USD softness) could disrupt structure-based setups. No confirmed momentum shift yet on lower timeframes — patience required.
SmellyTaz — decoding chaos .

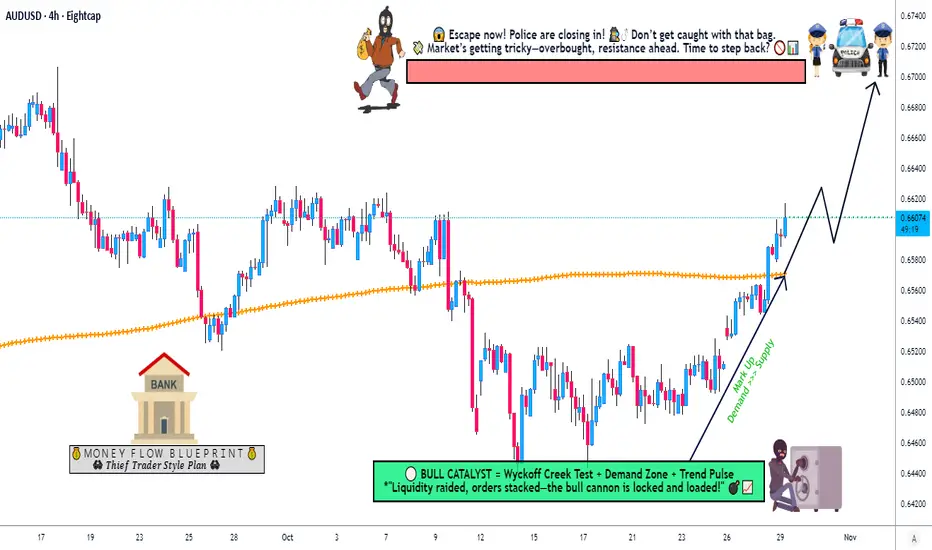
Is the Aussie Dollar Ready for a Strong Upside Push?🎯 AUD/USD: The Great Heist Setup | 200 SMA Breakout in Play! 💰
📊 Market Overview
The Aussie Dollar is making moves, ladies and gents! We've got a confirmed bullish breakout above the 200 Simple Moving Average — and you know what that means... it's time to plan our strategic entry! 🚀
🎭 The "Thief Strategy" Breakdown
🔍 Asset Analysis
Pair: AUD/USD (Aussie Dollar vs. US Dollar)
Market Type: Forex
Trade Style: Swing/Day Trade
Setup: Capital Flow Blueprint
📈 Technical Outlook
✅ Bullish bias confirmed with price breaking and holding above the 200 SMA
✅ Momentum building as buyers step in
✅ Higher timeframe structure supporting upside potential
🎯 Entry Strategy: "The Layering Heist"
The Thief Strategy uses multiple limit orders (layering technique) to scale into positions like a pro! Here's the blueprint:
💎 Multi-Layer Entry Zones:
Layer 1: 0.65400
Layer 2: 0.65600
Layer 3: 0.64800
Layer 4: 0.66000
Note: You can add more layers based on your capital allocation and risk appetite. Scale in smart, scale out smarter! 😎
🛡️ Risk Management
⛔ Stop Loss: 0.65200
Disclaimer: This is the Thief's SL level for reference. However, OG Thieves — set your own stop loss based on YOUR risk tolerance. Your capital, your rules! 🎲
🎯 Take Profit Target: 0.67000
Why 0.67000? This level acts as:
🚧 Strong resistance zone ("Police Barricade")
📊 Potential overbought territory
Historical trap zone — secure profits before the reversal!
Disclaimer: This is a suggested TP level. Trail your stops, scale out partially, or set your own target. Take money when you make money — it's your game! 💵
🔗 Correlated Pairs to Watch
Keep an eye on these related markets for confluence:
OANDA:NZDUSD — Commodity currency cousin, often moves in tandem with AUD
OANDA:AUDJPY — Risk-on sentiment gauge
OANDA:AUDCAD — Inter-commodity pair correlation
USD Index ( TVC:DXY ) — Inverse correlation with AUD/USD
Gold ( OANDA:XAUUSD ) — Aussie correlates with gold due to mining exports
💡 Pro Tip: If USD weakens broadly and gold rallies, AUD/USD typically benefits!
🔑 Key Points Summary
✨ Bullish breakout above 200 SMA = momentum shift
✨ Layering strategy allows better average entry price
✨ Risk-to-reward favors bulls with clear targets
✨ Watch DXY weakness and gold strength for confirmation
✨ Resistance at 0.67000 — bank profits before reversal zones!
✨ If you find value in my analysis, a 👍 and 🚀 boost is much appreciated — it helps me share more setups with the community!
#AUDUSD #ForexTrading #SwingTrading #DayTrading #ThiefStrategy #200SMA #Breakout #TechnicalAnalysis #ForexSignals #AussieDollar #LayeringStrategy #RiskManagement #ForexSetup #TradingIdeas #PriceAction
Australian Dollar Rises Above $0.660Australian Dollar Rises Above $0.660
According to the AUD/USD chart today, the Australian dollar has climbed to its highest level in three weeks. The currency’s strength stems from the following factors:
→ Australia’s monthly consumer price index (CPI) came in stronger than expected. According to Forex Factory, annual inflation reached 3.5%, compared with analysts’ forecasts of 3.1%. This marks the highest reading since July 2024, pointing to renewed inflationary pressure.
→ As a result, traders have significantly reduced bets on further monetary easing. Data from Trading Economics shows that the probability of the Reserve Bank of Australia keeping its interest rate unchanged at 3.6% at its 4 November meeting is now close to 90%.
Technical Analysis of the AUD/USD Chart
Since mid-September, movements in the AUD/USD pair have formed a descending channel (shown in red), built on a series of lower highs and lows starting from point A.
However, note that in mid-October:
→ the price dipped below the lower boundary;
→ the RSI indicator entered oversold territory;
→ candles displayed large bodies;
→ an inverted head and shoulders reversal pattern emerged.
From a Smart Money Concept perspective, it is reasonable to assume that within the area marked by the purple rectangle, Smart Money was accumulating sellers’ liquidity to build long positions.
Following this, the Australian dollar showed strong momentum as the price broke through:
→ resistance at 0.6520 near the channel’s median (forming a bullish gap in the process);
→ the upper boundary of the red channel around 0.6565.
Building on this view → the price now appears to be moving towards a liquidity zone, where Smart Money could find sufficient buy-side liquidity. This area may lie above the 0.6630 level, which previously acted as resistance in early October.
It is also possible that today’s Federal Reserve decision (the Federal Funds Rate announcement scheduled for 21:00 GMT+3) will help this scenario play out.
This article represents the opinion of the Companies operating under the FXOpen brand only. It is not to be construed as an offer, solicitation, or recommendation with respect to products and services provided by the Companies operating under the FXOpen brand, nor is it to be considered financial advice.

AUDUSD H4 | Potential Bearish Reversal from Key Resistance LevelAUD/USD is rising towards the sell entry which is a pullback resistance that aligns with he 78.6% retracement and the 78.6% Fibonacci projection and could reverse from this level to the downside.
Sell entry is at 0.6636, which is a pullback resistance that aligns with the 78.6% retracement and the 78.6% Fibonacci projection.
Stop loss is at 0.6684, which is a swing high resistance.
Take profit is at 0.6559, which is a pullback support.
Stratos Markets Limited (tradu.com ):
CFDs are complex instruments and come with a high risk of losing money rapidly due to leverage. 68% of retail investor accounts lose money when trading CFDs with this provider. You should consider whether you understand how CFDs work and whether you can afford to take the high risk of losing your money.
Stratos Europe Ltd (tradu.com ):
CFDs are complex instruments and come with a high risk of losing money rapidly due to leverage. 70% of retail investor accounts lose money when trading CFDs with this provider. You should consider whether you understand how CFDs work and whether you can afford to take the high risk of losing your money.

AUDUSD → Attempt to reverse the trend to bullish FX:AUDUSD is forming a correction after breaking through the resistance of the downward channel. The market needs a trading range or consolidation above 0.6526.
The dollar is consolidating but is not ready to continue growing. Pressure on the currency is emerging ahead of the Fed meeting. This may support the growth of the Australian dollar.
The currency pair is entering a distribution phase after consolidation. The breakout of 0.6526 triggered a break of the downward channel resistance. An attempt to change the trend is forming. If the bulls keep the price above 0.6526, this could trigger further growth.
Resistance levels: 0.6567, 0.661
Support levels: 0.6526, 0.6493
At the moment, an attempt to change the trend has been initiated. Consolidation and distribution are a good sign, but above the previously broken trend line, a trading range should form, which will confirm the fact of a change in the local trend.
Best regards, R. Linda!

Hot CPI Kills Hopes of an RBA CutAustralia's Q3 inflation figures have just dropped, and all surprised to the upside. Not only does this kill hopes of a cut next week — and likely for the rest of the year — but it also suggests the RBA may have already reached the terminal rate of this cutting cycle. I take a quick look at the figures, AUD/USD, and the ASX 200.
Matt Simpson, Market Analyst at City Index and Forex.com.

AUDUSD FRGNT Daily Forecast - Q4 | W44 | D29| Y25 |📅 Q4 | W44 | D29| Y25 |
📊 AUDUSD FRGNT Daily Forecast
🔍 Analysis Approach:
I’m applying Smart Money Concepts, focusing on:
Identifying Points of Interest on the Higher Time Frames (HTFs) 🕰️
Using those POIs to define a clear trading range 📐
Refining those zones on Lower Time Frames (LTFs) 🔎
Waiting for a Break of Structure (BoS) for confirmation ✅
This method allows me to stay precise, disciplined, and aligned with the market narrative, rather than chasing price.
💡 My Motto:
"Capital management, discipline, and consistency in your trading edge."
A positive risk-to-reward ratio, paired with a high win rate, is the backbone of any solid trading plan 📈🔐
⚠️ Losses?
They’re part of the mathematical game of trading 🎲
They don’t define you — they’re necessary, they happen, and we move forward 📊➡️
🙏 I appreciate you taking the time to review my Daily Forecast.
Stay sharp, stay consistent, and protect your capital
— FRNGT 🚀
OANDA:AUDUSD

AUD/USD in focus ahead of CPI, FOMC and Trump-Xi summitAhead of the release of inflation data from Australia and the Fed's rate decision, both on Wednesday, the AUD/USD was among the strongest FX pairs our there today, rising in tandem with stock indices. The pair has broken out of a short-term bear channel and risen above its 21--day exponential average. Key short-term support now comes in at 0.6500-0.6530 area, and resistance around 0.6580-0.6600.
Rising expectations that the Trump-Xi meeting will result in the extension of the trade truce between the world's largest economy continues to underpin the risk rally, which has benefitted the Aussie.
The AUD/USD will face a key test, not only due to the Trump-Xi summit which is likely to take place on Thursday, but we will also have CPI data from Australia and a likely rate cut decision from the Fed on Wednesday to look forward to.
Australia's CPI is due at 12:30 GMT in the early hours of Wednesday. A 1.1% quarter-over-quarter reading is expected, up from 0.7% in the previous quarter, while the year-over-year rate is seen edging higher to 3.1% from 3.0% previously.
Earlier this week, RBA’s Gov Bullock said:
- We will have to decide whether need cut to help job market
- Unemployment Could Come Down Again Next Month
- Monthly Numbers Can Be Volatile But Unemployment Rate Jump Was Surprise
- Unemployment Rise Was Not A Huge Amount Above Forecast
- Board Is Cautious About Policy, Rates Still A Bit Restrictive
While a rate cut is not out of the question, the RBA is among the more hawkish of central banks out there, and should the US-China trade relations improve, we could see further appreciation in the Aussie dollar - especially in light of the pair breakout out of its bearish channel.
By Fawad Razaqzada, market analyst with FOREX.com

XAU/USD : Gold Breaks $4,000 Support – Can Bulls Hold the Line?By analyzing the Gold (XAUUSD) chart on the 2-hour timeframe, we can see that after rising to $4,138 and entering the marked supply zone, gold faced strong selling pressure and continued to drop, finally breaking below the $4,000 support and reaching $3,971.
As shown on the chart, this area is a key demand zone, and we expected a reaction here.
If gold manages to hold above the current level, we could see a short-term bounce toward $4,015. This analysis will be updated soon!
Please support me with your likes and comments to motivate me to share more analysis with you and share your opinion about the possible trend of this chart with me !
Best Regards , Arman Shaban

AUDUSD - Scalping longAUDUSD - Scalping long
a quickly signal for scalping long.
In this moment we have a H&S Long pattern ready for a long

AUDUSD Eyes 0.6500 as Softer CPI and Weak Jobs Data Weigh on USDHey Traders,
In the coming week, we’re monitoring AUDUSD for a potential buying opportunity around the 0.65000 zone. The pair remains in a broader uptrend, with the current pullback shaping up as a healthy correction toward key structural support.
Structure:
Price continues to respect its ascending trendline, and the 0.65000 area aligns with a strong confluence of horizontal support and dynamic trend structure — a level that has previously attracted strong buying momentum.
Macro Outlook:
The latest U.S. inflation print came in softer at 3.0%, undershooting expectations, while labour market data continues to signal cooling conditions. Together, these developments reinforce a dovish shift in Fed sentiment, weighing on the U.S. Dollar Index (DXY).
At the same time, Gold continues to rally, underpinned by the weakening Dollar and rising safe-haven demand. Given the positive correlation between AUD and Gold, this macro backdrop strengthens the bullish case for AUDUSD in the coming sessions.
Next Move:
A sustained bid around 0.65000 could mark the start of another impulse leg higher — targeting a retest of recent highs if momentum confirms.
Trade safe,
Joe

AUDUSD POSSIBLE SELL SETUP🧭 Market Structure Overview
Current price: around 0.6547
The chart shows a bearish structure shift — after price reached a high near 0.6560–0.6565, it created:
A Break of Structure (BOS) to the downside.
A Change of Character (CHoCH) confirming a transition from bullish to bearish momentum.
🧱 Key Supply and Demand Zones
Supply zone (short entry area):
Marked in red around 0.6550–0.6560
This is where sellers previously entered and broke structure — potential retest zone for short entry.
Demand zones (targets):
Minor demand: around 0.6530–0.6535
Major demand / final target: near 0.6515–0.6510
📉 Trade Plan (Sell Setup)
Bias: Bearish
Entry zone (sell):
Wait for a retracement into 0.6550–0.6555 (supply zone retest)
Confirmation:
Look for lower time frame rejection (e.g. bearish engulfing, BOS down on 1–5m chart) at that zone.
Stop loss:
Above 0.6565 (just beyond the BOS high / supply zone)
Take profit targets:
TP1: 0.6535 (first demand / liquidity pocket)
TP2: 0.6515 (main target, strong demand zone)
Risk-to-reward (approx):
1:3 to 1:4, depending on entry precision
🔍 Market Logic
Price made a lower high and broke structure to the downside.
The CHoCH confirms momentum has shifted.
The liquidity above 0.6560 has been swept — institutions likely distributed there.
Expect a retracement into supply before the next impulsive leg down.
⚠️ Trade Management Tips
If price fails to reach 0.6550 and instead breaks below 0.6535 decisively, consider waiting for a pullback to 0.6540 for re-entry.
Move SL to breakeven after TP1 is hit.

AUDUSD reaching important resistance at 0.6560The AUDUSD remains in a neutral trend, with recent price action indicating a potential resistance retest within the broader uptrend.
Resistance Zone: 0.6560 – a key level from previous consolidation. Price is currently testing or approaching this level.
A bearish rebound from 0.6560 would confirm ongoing downside momentum, with potential targets at:
0.6500 – initial support
0.6490 – psychological and structural level
0.64800 – extended support on the longer-term chart
Bullish Scenario:
A confirmed break and daily close above 0.6560 would weaken the bullish outlook and suggest deeper downside risk toward:
0.6576 – minor resistance
0.6590 – stronger resistance and potential supply zone
Outlook:
Neutral bias remains intact while the AUDUSD trades around the pivotal 0.6560 level. A sustained break below or above this level could shift momentum.
This communication is for informational purposes only and should not be viewed as any form of recommendation as to a particular course of action or as investment advice. It is not intended as an offer or solicitation for the purchase or sale of any financial instrument or as an official confirmation of any transaction. Opinions, estimates and assumptions expressed herein are made as of the date of this communication and are subject to change without notice. This communication has been prepared based upon information, including market prices, data and other information, believed to be reliable; however, Trade Nation does not warrant its completeness or accuracy. All market prices and market data contained in or attached to this communication are indicative and subject to change without notice.

QUICK BUY TRADE OPPORTUNITY FOR AUDUSDAUDUSD has broken a very powerful resistance level (red trendline).. and is very likely to test the next powerful resistance zone which is all the way up at 0.66600. great time to buy now (low risk high reward)

AUDUSD potential move in short term Had test of OB and trend shift on LTF, ptentially move to take buyside liqudity

AUDUSD Trade Plan - Waiting for a Pullback & Structure Break.The AUDUSD has officially broken structure to the upside, signaling bullish momentum ✅.
I’m currently waiting for price to retrace back into equilibrium within the previous swing range before considering any long positions—price is overextended at current levels and chasing here wouldn’t be smart ⚖️📉.
Patience is key as I wait for premium liquidity zones to be tapped for a high-probability entry setup 🎯.
⚠️ Disclaimer: This is market analysis and not financial advice.
AUDUSD Trade Plan - Waiting for a Pullback & Structure Break.

AUDUSD My Opinion! SELL!
My dear followers,
This is my opinion on the AUDUSD next move:
The asset is approaching an important pivot point 0.6538
Bias - Bearish
Technical Indicators: Supper Trend generates a clear short signal while Pivot Point HL is currently determining the overall Bearish trend of the market.
Goal - 0.6510
About Used Indicators:
For more efficient signals, super-trend is used in combination with other indicators like Pivot Points.
Disclosure: I am part of Trade Nation's Influencer program and receive a monthly fee for using their TradingView charts in my analysis.
———————————
WISH YOU ALL LUCK

Is Geopolitical Re-Alignment the New AUD Catalyst?The Australian Dollar's (AUD) sharp surge against the US Dollar (USD) is driven by a powerful synergy of geopolitical de-escalation and structural economic realignment. Near-term momentum stems from optimism surrounding an imminent US-China trade deal. As a primary commodity exporter and a financial 'China proxy', Australia's currency benefits directly from reduced Sino-American trade tensions, prompting a global "risk-on" rally that lifted commodity prices and commodity-linked currencies. Simultaneously, softer-than-expected US inflation data has amplified expectations for a Federal Reserve rate cut in December, weakening the USD by narrowing the interest rate differential in favor of the Aussie.
Structurally, the AUD gains foundational strength from a landmark $8.5 billion US-Australia Critical Minerals Agreement. This strategic pact, targeting vital rare-earth elements, aims to secure a Western supply chain for high-tech and defense industries, directly countering China's resource dominance. The joint commitment of over $1 billion in near-term investment into Australian mining and processing facilities introduces significant foreign capital and long-term economic diversification. This geostrategic pivot transforms Australia into a key node in the non-Chinese supply of materials essential for the global clean energy transition and advanced cyber systems, moving the AUD beyond purely cyclical commodity flows.
In essence, the $AUD/USD rally is a dual narrative: a cyclical uplift from cooling trade wars and a structural upgrade from a new science and technology alliance with the US. While markets await specific details from the upcoming high-level trade talks and the Federal Reserve's next move, this combination of favorable macroeconomic divergence and a foundational critical minerals investment provides a robust, multi-domain argument for sustained Australian Dollar strength.
AUDUSD FRGNT Daily Forecast -Q4 | W44 | D27| Y25 | GAP FILL !📅 Q4 | W44 | D27| Y25 |
📊 AUDUSD FRGNT Daily Forecast
🔍 Analysis Approach:
I’m applying Smart Money Concepts, focusing on:
Identifying Points of Interest on the Higher Time Frames (HTFs) 🕰️
Using those POIs to define a clear trading range 📐
Refining those zones on Lower Time Frames (LTFs) 🔎
Waiting for a Break of Structure (BoS) for confirmation ✅
This method allows me to stay precise, disciplined, and aligned with the market narrative, rather than chasing price.
💡 My Motto:
"Capital management, discipline, and consistency in your trading edge."
A positive risk-to-reward ratio, paired with a high win rate, is the backbone of any solid trading plan 📈🔐
⚠️ Losses?
They’re part of the mathematical game of trading 🎲
They don’t define you — they’re necessary, they happen, and we move forward 📊➡️
🙏 I appreciate you taking the time to review my Daily Forecast.
Stay sharp, stay consistent, and protect your capital
— FRNGT 🚀
OANDA:AUDUSD

Stop!Loss|Market View: NZDUSD🙌 Stop!Loss team welcomes you❗️
In this post, we're going to talk about the near-term outlook for the USDCAD currency pair☝️
Potential trade setup:
🔔Entry level: 0.57463
💰TP: 0.56839
⛔️SL: 0.57955
"Market View" - a brief analysis of trading instruments, covering the most important aspects of the FOREX market.
👇 In the comments 👇 you can type the trading instrument you'd like to analyze, and we'll talk about it in our next posts.
💬 Description: The New Zealand dollar continues to trade in a mid-term downtrend. Currently, this currency pair, as a commodity currency, is one of the most promising buying instruments for the USD, with further strengthening expected in the near future. Current prices are favorable for potential selling, but a false breakout near 0.57550 is possible, which would provide an even more reliable sell signal.
Thanks for your support 🚀
Profits for all ✅
❗️ Updates on this idea can be found below 👇

Potential bullish bounce?AUD/USD has bounced off the support level, which serves as a pullback support and could rise from this level to our take-profit target.
Entry: 0.6500
Why we like it:
There is a pullback support level.
Stop loss: 0.6481
Why we like it:
There is a pullback support level.
Take profit: 0.6542
Why we like it:
There is a pullback resistance level.
Enjoying your TradingView experience? Review us!
Please be advised that the information presented on TradingView is provided to Vantage (‘Vantage Global Limited’, ‘we’) by a third-party provider (‘Everest Fortune Group’). Please be reminded that you are solely responsible for the trading decisions on your account. There is a very high degree of risk involved in trading. Any information and/or content is intended entirely for research, educational and informational purposes only and does not constitute investment or consultation advice or investment strategy. The information is not tailored to the investment needs of any specific person and therefore does not involve a consideration of any of the investment objectives, financial situation or needs of any viewer that may receive it. Kindly also note that past performance is not a reliable indicator of future results. Actual results may differ materially from those anticipated in forward-looking or past performance statements. We assume no liability as to the accuracy or completeness of any of the information and/or content provided herein and the Company cannot be held responsible for any omission, mistake nor for any loss or damage including without limitation to any loss of profit which may arise from reliance on any information supplied by Everest Fortune Group.
