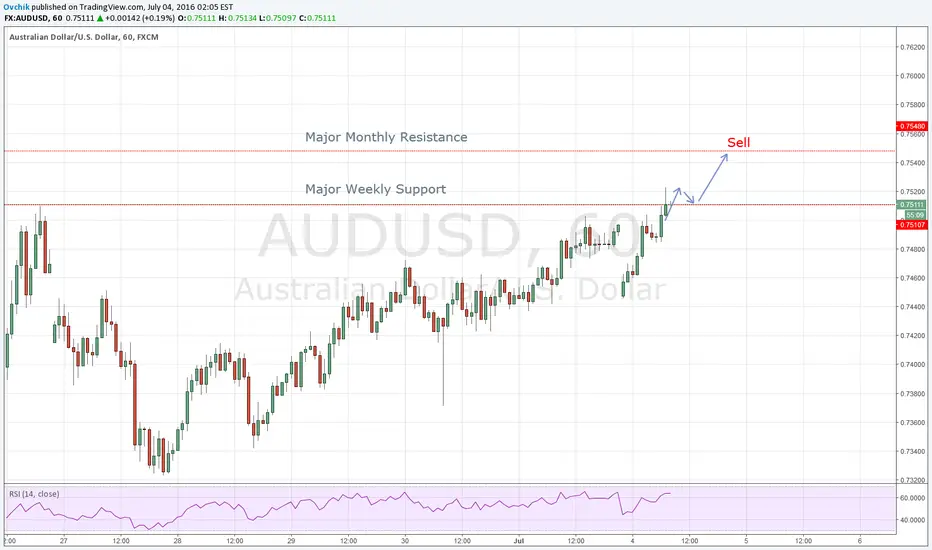
TCT trade on AUDUSDHey guys,
Australian dollar has gained a lot over the pasy days, you can see this from the chart above and you can also see that lately price has been ranging in a very tiny space. When you see impulsive move like this you would expect price not to retrace so much because of the strength disequilibrium. And that is what i think could happen next here: flags, pennants, wedges, these are all trend continuation patterns that appear when price has a strong trend. Therefore, if it will retrace a bit i'm going to enter long with stops below the lows and target1 at the retest of the highs. Target2 will be placed around 0,76.
Let's see how it plays out!
If you have questions or if you want to share your view, feel free to write below.
Otherwise, see you in the next chart!
Audusdbullish

50 Pips Opportunity - AUD/USD LongThis is a trade more in the short term category, and so I would suggest to risk half what you usually risk. So that way you still get into the position and make some profits if it goes as expected, if not, you lose half what you usually lose.
This is only a signal/idea. Always make your own analysis and money manage properly.
Happy trading!

AUD/USD bouncing up nicely, remain bullish Price has started to bounce up really nicely. We remain bullish above 0.7441 support (Fibonacci retracement, horizontal swing low support, bullish divergence) for a push up to at least 0.7510 resistance (Fibonacci retracement, Fibonacci extension, horizontal overlap resistance).
Stochastic (34,5,3) is seeing strong support above the 5.1% where stochastic is bouncing up nicely from and also sees bullish divergence versus price signalling that a bounce is impending.

1 HR reverse head & shoulders . LONGBullish reversal pattern on daily S&R for a .618 retracement.
Long position. for a retracement , then a continuation of downtrend.


Long AUD/USDI like a nice move up from support level. also a nice bearish bat setup. Lets see it hit TP.

H&S pattern within' H&S pattern?... 4HR AUD/USD AnalysisTechnically speaking this pair should be on the upside near term. Longer term to test the 52 week high as of 25/3/2017, the .7890-7920 level. Out on the daily a simple TCT trade is easily visible. As RBA Interest Rate decision draws nearer it maybe the definitive factor in pushing this pair to newer highs and higher lows. My eyes are on this opportunity for sure.

FX:audusdHello fellow traders,
Forex likes patterns so, this is copper take a close look and tell me that is is not the same as W1 AudUsd. SELLLL AUD USD that is done.
See you.


AUDUSD short termRetest .7555, fail to close above and a short position would be very possible at this point. Strong bearish MACD divergence.

AUDUSD short term positionMarket price has been on a steady uptrend since the 5th of 2017 but momentum stoped its upward move on the 17th of this month. Momentum has been creating lower highs and higher lows since then. Momentum came back up to test the .001 level and is looking to break the lower trend line. On a break of the lower tend line a short position will be available with the 200 EMA (blue) acting as a TP.


0.74466 VS 0.75664 = Fight!!! ;)#include
using namespace std;
int main()
{
setlocale(0, "");
double num;
cout << "0.75267 ";
cin >> num;
if (num < 10) { //If the price breakthrough the price 0.74466 = short term Downtrend
cout <<
} else { // If the price breakthrough the price 0.75664 = short term Uptrend
cout <<
}
return 0;
}


AUDUSDmight be a little dip down before shooting up, TP1 0.76008 TP2 0.76426. take half at tp1, Trailing stop after TP2. let's get rich :P


AUDUSD 60minsLooking forward for this cypher pattern completion. Structure for this pair is the motive, seeing recent volatility has given all of the new structure high gains back. Dollar strength breeds downside for this pair.

AUDUSD IntradayPivot: 0.7575
Most Likely Scenario: long positions above 0.7575 with targets @ 0.7640 & 0.7660 in extension.
Alternative scenario: below 0.7575 look for further downside with 0.7540 & 0.7520 as targets.
Comment: a support base at 0.7575 has formed and has allowed for a temporary stabilization.

AUDUSD: LONG EASY SETUPWe're nicely in between weekly and monthly resistance/support levels and just broke above weekly resistance.