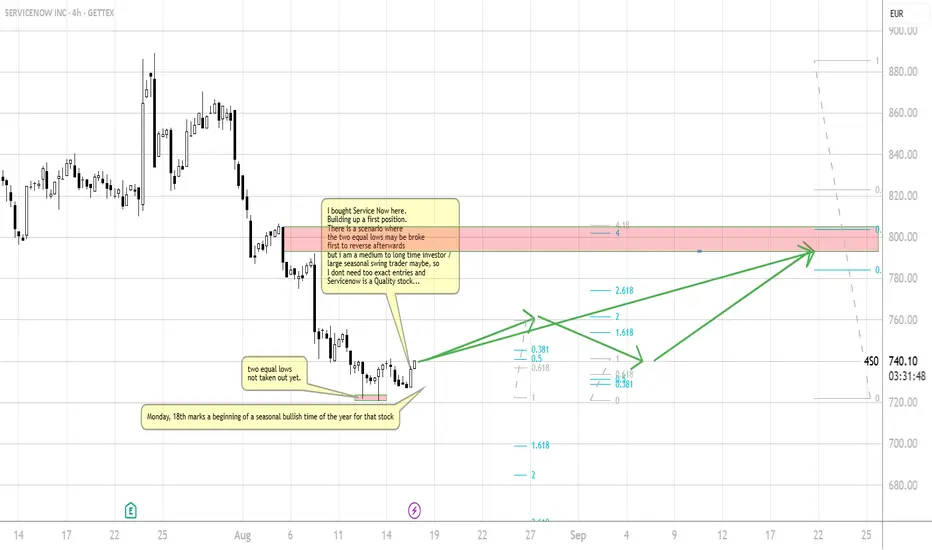
NOW Servicenow Service Now - Long scenarioI bought Service Now here.
Building up a first position.
There is a scenario where
the two equal lows may be broke
first to reverse afterwards
but i am a medium to long time investor /
large seasonal swing trader maybe, so
I dont need too exact entries and
Servicenow is a Quality stock...
this is not a trade call, no financial advice. for educational purpose only....
I d be happy about a like/rocket or comment and a chat with you guys!
August
(BTC) bitcoin "balancing act"Lines drawn based on indications in an attempt to foresee the direction of bitcoin. Day chart. Yellow Lines are aligned with variable average patterns. Orange lines are more concretely focused on consistent timeframe measurements. The trading psychology right now is not at its peak. Array pressure on the price is high where May 2025 was the last time BTC was at a low array buying pressure. Similarly, Bollinger Band phase is positive with the last negative being around April to May 2025. Bear power is in control right now. Selling pressure chop chai confirms the bear power indicator. Directional momentum does appear to be being taken over by selling also indicated is the strong average gauge to confirm the strength of selling. MA quad gives an indication the price is losing with the losing line in control over the top of the winning line. Triple descending pyramids appeared last week with the last time multiples of those type appeared happened around the start of February 2025. MACD lines have crossed 0 moving in a downward direction.
The balance of the imaginary weighted scale appears to be shifting to the right as in falling until the balance is level. The price of BTC often follows no logical path or makes any sense. This image is not entirely made up and relies on indicators which are unpublished that I drew over to show what is stated in the post.

ETH - Eyes on a New All-Time High?ETHUSDT has been on fire lately, following a textbook bullish structure of Impulse → Fakeout → Impulse.
After breaking above the previous range in July, ETH confirmed strength with a sharp impulse move, only to shake out weak hands via a fakeout retest before pushing higher again. 📈
Currently, ETH is in the midst of another impulsive leg, with the next major target sitting at the ATH around $4,876.
📊 Key Notes:
- Fakeouts have served as liquidity grabs before strong rallies 🏹
- Current momentum favors the bulls 🐂
- As long as price holds above the last breakout zone (~$4,050–$4,150), the path of least resistance remains up.
🎯 Next Stop: ATH and beyond if bullish pressure sustains.
📚 Always follow your trading plan regarding entry, risk management, and trade management.
Good luck!
All Strategies Are Good; If Managed Properly!
~Richard Nasr

Bitcoin Range for August?Historically August has been a tough month for crypto in the past with mostly flat to negative returns. For that reason, although not a perfect science, I would not be surprised if we see a rangebound environment continuation for BTC.
So what would that look like? Structurally there are three thirds to the range, currently price is looking to break through into the upper third after bouncing off the bottom third bullish orderblock.
Trade setups will naturally present themselves as rotational plays both bullish and bearish at the extremes of each of the thirds but much larger trades from the range top and bottom.
Altcoins are lagging behind BTC structurally so where BTC has been choppy for a few weeks, most large cap alts have hit their highs and are now looking to settle into a range before the next leg up.

(BTC) bitcoinIs this the bitcoin price? In the indicator I used to view this chart I drew some information based on a guess into the future is Bitcoin does what I think it is doing to do in the following week, 10 days exactly. If I am wrong then I guess I saw the change being too predictable. I think the force of energy will push down on Bitcoin and that force of energy from the indicators will entice buyers to buy against the energy pushing Bitcoin down.

(JASMY) jasmyCurrent trajectory for Jasmy using a previous shape to plot to fan assist tools, one on top and one on bottom, from the two fans creates a gap in the middle where the trend of Jasmy appears to visually chart its price.

(JASMY) JASMY The price is maintaining nicely, the graph shows an indicator that measures moving averages and overlapping information. Circles are progress signals, crosses are negative signals. The recents show crosses around the same time the price was falling. Also I modified my indicator's colors and adjusted things to be more starry to look at. Sometimes it's more for the sake of knowing I'm going to stare at the same indicator for a long time. Many indicators outside BTC, ETH, Jasmy, are showing signals of cryptocurrency overall reaching a well point surpassing the crossunder length of the longest running moving average lines. Jasmy is not showing long moving average lines crossing and is maintaining a strong price increasing inertia. Long lines will have big circles or big cross and short lines will have small circles or small cross in this indicator. The 10 and the 50 is the yellow line.

(PRO) propy "ICOEarly funding for Propy came in the form of an ICO, crunchbase.com metrics.
Initial coin offerings give a chance for people to buy the token before it is available for public trade on markets. Less decentralized than if the token had made no sales before being pushed to market.

(NCT) polyswarm "ICO"Early funding for polyswarm came in the form of ICO, crunchbase.com data metrics.
Initial coin offerings give a chance for people to buy the token before it is available for public trade on markets. Less decentralized than if the token had made no sales before being pushed to market.

(TRAC) origintrail "ICO"The origin story of origintrail (TRAC) appears to show funding in the form of ICO, crunchbase.com data metrics.
Initial coin offerings give a chance for people to buy the token before it is available for public trade on markets. Less decentralized than if the token had made no sales before being pushed to market.

(OSMO) osmosis "ICO"The origin story of Osmosis appears to have an ICO as part of funding early on; crunchbase.com data metrics.
Initial coin offerings give a chance for people to buy the token before it is available for public trade on markets. Less decentralized than if the token had made no sales before being pushed to market.

(SHPING) shping "ICO"The origins of shping appear to have an ICO, crunchbase.com metrics.
Initial coin offerings give a chance for people to buy the token before it is available for public trade on markets. Less decentralized than if the token had made no sales before being pushed to market.

(PRQ) parsiq "ICO"The origins of Parsiq appear to feature an ICO at some point, crunchbase.com metrics. Initial coin offerings give a chance for people to buy the token before it is available for public trade on markets. Less decentralized than if the token had made no sales before being pushed to market.

(TRX) tronThis has to be the biggest candle I've ever seen Tron produce. I've never seen the price go higher than the 0.15 cents barrier. Looks like this year might be different. I don't own any tron anymore.

(ETH) ethereum "direction"I think Ethereum is headed in the direction of the black neutral zone area as seen in the auto fib retracement indicator. The 50 day and 100 day moving average lines show Ethereum headed towards the neutral zone. Due to the neutral zone being above the price, I think the price of Ethereum is going to gain in price.

(JASMY) jasmy Is now a good time to buy? The price is awfully close to turning over to the green side. If the line goes green the price could have a small surge increasing the price of Jasmy. I remain along the sentiment that Jasmy is gaining in price, not losing.

(BTC) bitcoin Here's what I see on my chart using my indicator. Really tight weave right now after BTC surpassed the blackhole zone. Now the price is working itself away from the compass overpass. Unlike ETH which is working through the underpass.


(BEAM) beam "ICO -- funding"Early funding for BEAM based in Tel Aviv, Israel; most active location Peru 25%, was ICO in nature. Historically, ICO's are the type of company funding the SEC is most aggressive labeling securities.

Thorchain (RUNE) "ICO -- funding"Early funding for Thorchain was an ICO. As many people know the SEC in America does not take ICO funding for cryptocurrency lightly. They don't like it and many companies that were first funded as by ICO funding have found their way onto the SEC lawsuits list.

(DYDX) dydx "third most active location -- China"The third most active location is China with 13%, second UK 13%, and India first most active location for Dydx at 26%. Headquarters are here in USA, California.

(L3) layer3 "second most active in Russia"The second most active location data for (L3) layer3 is in Russia with 11% activity comapred to the first location Vietnam with 31%.

(TOKE) tokemak "second most active location in China"The activity for Tokemak (TOKE) shows 11% in China and 79% in USA. Data from crunchbase.com.
