AUS200 ASX200 - LETS MAKE MILLIONTeam, time to buy AUS200 at 8530-45 ranges
STOP LOSS AT 8480
Target 1 - 8575-86
Target 2 - 8592-8605
Last night I predict the market will pull back
We short UK100 and both target hit
now we are going long on AUS200
lets go
AUS200
AUS200 Turning Higher? Key Buy Zones and Profit RoadmapAUS200 (Australia 200) 🚀 BULLISH SWING LAYER Strategy | "The Thief" Entry Method
🥳 Greetings, Traders & "Thief OG's"! 🥳
Get ready for a deep dive into a high-probability BULLISH swing trade setup on the $AUS200. This plan uses a sophisticated entry method to maximize opportunities. Likes & Follows are highly appreciated if you find this valuable! ✅
📈 Trade Thesis & Market Context
The AUS200 is showing strength, and we are anticipating a continued upward move. Our strategy is to enter on any potential pullbacks using a layered approach, ensuring we get a favorable average entry price.
⚔️ Trading Plan: "The Thief" Layered Entries
This strategy uses multiple limit orders to "steal" good prices from the market.
Direction: 🟢 BULLISH (Swing Trade)
Asset: AUS200 (Australia 200 Index)
🎯 Entry Zone (Layered Limit Orders)
We are setting buy limits at key support levels:
▶️ Layer 1: 8480.0
▶️ Layer 2: 8520.0
▶️ Layer 3: 8560.0
▶️ Layer 4: 8600.0
💡 Pro Tip: You can increase or adjust the number of layers and levels based on your own capital and risk appetite. The goal is to build a position at a good average cost.
🛑 Stop Loss (RISK MANAGEMENT)
Initial Hard Stop: 8440.0 (Below the deepest entry layer).
⚠️ IMPORTANT NOTE FOR THIEF OG'S: This is MY strategic stop loss. You MUST adjust your SL based on your personal risk tolerance and account size. Protect your capital at all costs! This is not financial advice.
🎯 Profit Target
Primary Target: 8850.0
This target is based on:
📍 Previous major resistance zones.
📉 Potential for Moving Averages to act as dynamic resistance.
🚨 Overbought conditions that may trap late buyers – we plan to exit before the crowd.
💰 Take Profit Reminder: You are free to take profits earlier! Scale out as price moves in your favor. "Make money, then take money" at your own discretion.
🔍 Related Pairs & Key Correlations (Must Watch!)
Understanding these relationships is crucial for this trade:
OANDA:AUDUSD 📉 (Inverse Correlation): A weaker AUD is often BULLISH for the AUS200, as it benefits the large export companies in the index. Watch for USD strength.
OANDA:XAUUSD (Gold) 📈: Australia is a major gold producer. A strong gold price can boost mining stocks and provide a tailwind for the AUS200.
US30 / SPX500 🇺🇸: Global risk sentiment is often led by US indices. A strong or stable US market generally supports bullish moves in the AUS200.
CN50 🇨🇳 (China A50): China is Australia's largest trading partner. Strength in the Chinese economy and its stock market is a positive signal for the AUS200.
✅ Final Checklist Before Entering:
✅ Confirm overall BULLISH market structure on the 4H/Daily chart.
✅ Check OANDA:AUDUSD for weakness (positive for this trade).
✅ Monitor US indices for positive risk sentiment.
✅ Set your LAYERED LIMIT ORDERS.
✅ Define your PERSONAL Stop Loss and Position Size.
Let's get this bread! 🍞
Like, Follow, and Comment with your thoughts or questions below! Let's build a community of smart traders.
Disclaimer: This is my personal trading idea, not financial advice. Trade at your own risk. You are solely responsible for your trading decisions.
#AUS200 #ASX #TradingView #SwingTrade #Bullish #TradingStrategy #ThiefStrategy #LayerEntry #TechnicalAnalysis #AUD

AUS200 - OPPORTUNITY ARISETeam, earlier today as I mentioned that AUS200 could go down to 8700
current price is 8711 - good for entry ranges
unemployment data is great - from 4.5 down to 4.2
Inflation is 3%
NOT A chance for rate cut this month.
STOP LOSS at 8660
Target 1 at 8730-45 - DO NOT FORGET TO TAKE PARTIAL AND BRING STOP LOSS TO BREAK EVEN
target 2 at 8765-80
lets GO

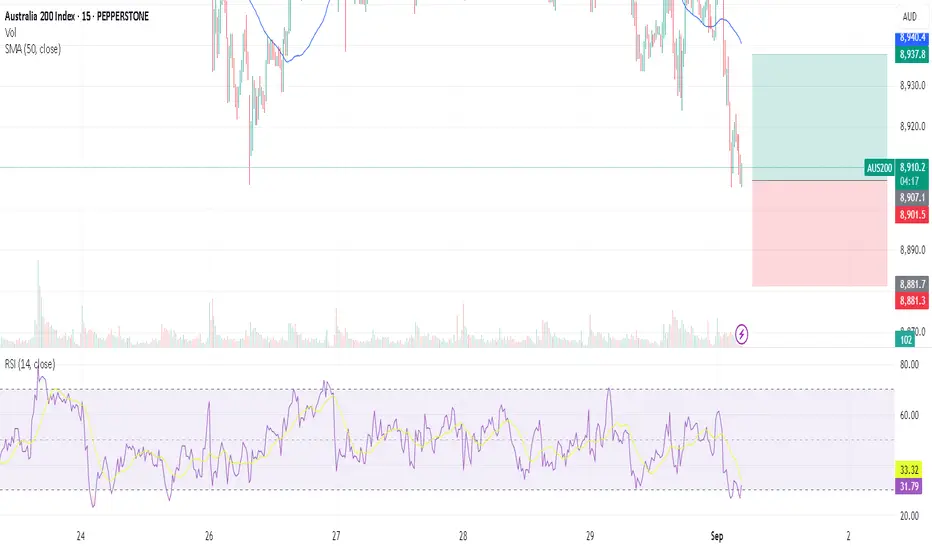
AUS200 - SCALPING Team,
ENTER LONG AUS200 AT 8908-8910 - TIGHT STOP LOSS AT 8885
TARGET AT 8930-40 - TAKE 70% PARTIAL, and bring stop loss to BE
There is a resistance zone at 8930-35 if it can break through we looking further toward 8960
LETS GO
Technical Analysis Report for the AUS200 (ASX 200)# AUS200 Technical Analysis: Comprehensive Multi-Timeframe Trading Strategy
Executive Summary
Current Price: 8943.0 (August 30, 2025, 12:54 PM UTC+4)
Market Sentiment: Cautiously Bullish with September Seasonality Concerns
Primary Trend: Uptrend with potential consolidation phase
The AUS200 (ASX 200) continues to demonstrate resilience near record highs, with the index climbing 2.48% over the past month and up 10.89% year-over-year. However, technical analysis suggests we're entering the "September Swoon" period, historically the worst performing month for equities.
Market Context & Fundamentals
Economic Backdrop
The Australian market operates within a supportive monetary environment with the RBA recently cutting the cash rate by 25 basis points to 3.60%. After years of steep hikes, the central bank began lowering rates in 2025, with three cuts implemented so far. This accommodative policy stance provides underlying support for equity valuations.
Key Fundamental Drivers
Monetary Policy: Inflation within the 2-3% target range with unemployment remaining low despite slight increases
Economic Outlook: Moderate growth expectations with global uncertainty remaining elevated
Sectoral Rotation: Energy and resources maintaining relative strength
Technical Analysis Framework
Japanese Candlestick Analysis
Weekly Pattern: Doji formation suggesting indecision at current levels
Daily Pattern: Small-bodied candles with extended upper shadows indicate selling pressure at highs
Intraday Patterns: Hammer and shooting star formations prevalent in 1H and 4H timeframes
Elliott Wave Analysis
Primary Count: Wave 5 of larger degree impulse potentially nearing completion
Alternative Count: Extended Wave 3 with further upside potential to 9200-9300
Critical Levels: Wave 4 low at 8750 provides key support structure
Harmonic Patterns
Active Pattern: Potential AB=CD pattern completion near 8950-9000 zone
Fibonacci Confluence: 61.8% retracement of major swing aligns with current resistance
PRZ (Potential Reversal Zone): 8920-8980 represents high-probability turning point
Wyckoff Analysis
Phase Assessment: Late accumulation/early markup phase
Volume Analysis: Decreasing volume on recent advances suggests distribution characteristics
Composite Operator: Large player activity evident in 8900-9000 range
W.D. Gann Analysis
# Time Theory Application
Critical Time Windows:
- September 3-6: High volatility period based on seasonal Gann squares
- September 23: Autumn equinox - significant time cycle
- October 7-14: 90-degree time cycle from previous major low
# Square of 9 Analysis
Current Position: 8943 sits at 299.05° on the wheel
Next Resistance: 9025 (300°) and 9216 (304°)
Support Levels: 8836 (297°) and 8649 (294°)
# Price and Time Squaring
Square of Current Price: √8943 = 94.57
Next square: 95² = 9025 (key resistance)
Previous square: 94² = 8836 (support level)
Ichimoku Kinko Hyo Analysis
Tenkan-sen (9): 8932 (neutral to slightly bullish)
Kijun-sen (26): 8895 (bullish above this level)
Senkou Span A: 8913 (current cloud top)
Senkou Span B: 8847 (cloud bottom support)
Assessment: Price above cloud with bullish bias, but approaching cloud resistance
Multi-Timeframe Technical Indicators
5-Minute Chart (Scalping Focus)
RSI(14): 58.2 - Neutral with slight bullish bias
VWAP: 8938 - Price trading above, confirming intraday strength
Bollinger Bands: Upper band at 8965, suggesting potential resistance
Moving Averages: EMA(20) > EMA(50) maintaining bullish structure
15-Minute Chart (Scalping Focus)
MACD: Bullish crossover pending, histogram improving
Stochastic: 62.8 in neutral zone with upward momentum
Volume Profile: High volume node at 8920-8930 zone
1-Hour Chart (Day Trading)
RSI(14): 61.5 approaching overbought threshold
VWAP: 8925 providing dynamic support
ADX: 28.4 indicating moderate trend strength
Support: 8910, 8885, 8850
Resistance: 8955, 8975, 9000
4-Hour Chart (Swing Trading)
RSI(14): 65.8 in overbought territory
MACD: Positive but showing divergence
Bollinger Bands: Price at upper band, expansion phase
Key Levels: Support at 8870, Resistance at 8980-9000
Daily Chart (Position Trading)
RSI(14): 68.2 overbought but not extreme
Moving Averages: All major MAs aligned bullishly
Volume: Below-average, concerning for sustainability
Pattern: Rising wedge formation suggesting potential correction
Weekly Chart (Long-term View)
RSI(14): 72.1 significantly overbought
MACD: Positive but momentum slowing
Trend: Strong uptrend since October 2024 low
Resistance: 9000-9100 zone represents major overhead supply
Support and Resistance Analysis
Primary Support Levels
1. 8910-8920: Immediate support zone with volume confluence
2. 8870-8885: Previous resistance turned support, multiple touches
3. 8840-8850: 20-day EMA and psychological level
4. 8800-8815: 50-day EMA and structural support
5. 8750-8765: Key weekly support and Elliott Wave 4 low
Primary Resistance Levels
1. 8955-8965: Immediate resistance with Gann and Fibonacci confluence
2. 8980-9000: Major psychological level and distribution zone
3. 9025-9040: Square of 9 resistance and measured move target
4. 9080-9100: Long-term resistance zone and potential wave completion
5. 9200-9250: Extended target based on harmonic pattern completion
Weekly Trading Strategy (September 2-6, 2025)
Monday, September 2, 2025
Market Outlook: Post-weekend gap potential, focus on 8920-8950 range
Strategy: Range trading with breakout preparation
Intraday Levels:
Long Entry: 8920-8925 with stop at 8905
Target 1: 8945
Target 2: 8960
Short Entry: 8965-8970 with stop at 8980
Target 1: 8940
Target 2: 8920
Swing Setup: Monitor for breakout above 8970 for continuation to 9000
Tuesday, September 3, 2025
Market Outlook: Gann time cycle activation, increased volatility expected
Strategy: Trend following with tight risk management
Intraday Levels:
Long Entry: 8930-8935 (if holding above 8920)
Target 1: 8955
Target 2: 8975
Short Entry: 8975-8985 with stop at 9000
Target 1: 8950
Target 2: 8925
Key Events: Watch for reversal patterns near 8980-9000 zone
Wednesday, September 4, 2025
Market Outlook: Mid-week consolidation expected, range-bound trading
Strategy: Scalping opportunities within established range
Intraday Levels:
Range Bottom: 8920-8930
Range Top: 8970-8980
Breakout Levels: Above 8985 (bullish) / Below 8915 (bearish)
Scalp Long: 8925-8930, Target: 8950-8955
Scalp Short: 8970-8975, Target: 8940-8945
Thursday, September 5, 2025
Market Outlook: Potential breakout day, monitor volume for confirmation
Strategy: Breakout trading with momentum confirmation
Breakout Scenarios:
Bullish Breakout: Above 8985 targets 9015-9025
Bearish Breakdown: Below 8915 targets 8885-8870
Volume Requirement: 1.5x average for valid breakout
Intraday Management:
Stop Loss: 15-20 points for scalps, 30-35 points for swings
Position Sizing: Reduce size by 25% given increased volatility
Friday, September 6, 2025
Market Outlook: Weekly close positioning, potential profit-taking
Strategy: End-of-week profit-taking and position adjustments
Weekly Close Targets:
Bullish Scenario: Close above 8960 sets up next week rally
Neutral Scenario: Close 8920-8960 maintains range
Bearish Scenario: Close below 8920 suggests correction beginning
Day Trading Focus:
Morning: Trend continuation from Thursday
Afternoon: Range trading and profit-taking
Risk Management Framework
Position Sizing
Scalping (5M-15M): 0.5-1% risk per trade
Day Trading (1H-4H): 1-1.5% risk per trade
Swing Trading (Daily): 2-2.5% risk per trade
Stop Loss Guidelines
5M Charts: 8-12 points maximum
15M Charts: 12-18 points maximum
1H Charts: 20-30 points maximum
4H Charts: 35-50 points maximum
Daily Charts: 60-100 points maximum
Profit Taking Strategy
Target 1: 1:1 Risk/Reward (50% position close)
Target 2: 1:2 Risk/Reward (30% position close)
Target 3: 1:3 Risk/Reward (20% position close)
Trailing Stop: Implement after Target 1 achievement
Geopolitical and Market Risk Factors
Domestic Considerations
RBA Policy: Economic outlook remains "uncertain" with potential for policy reversals if downside risks materialize
Employment Data: Rising unemployment to 4.3% may influence future policy decisions
Seasonal Patterns: September historically weak for Australian equities
International Factors
US Market Correlation: Strong correlation with S&P 500 performance
China Economic Data: Resource sector sensitivity to Chinese growth metrics
Currency Impact: AUD strength/weakness affecting export competitiveness
Commodity Prices: Iron ore and gold price movements critical for index performance
Event Risk Calendar
September 3: RBA Meeting Minutes release
September 5: US Non-Farm Payrolls (strong correlation impact)
September 17: RBA Policy Decision (potential further rate cut)
September 24: Chinese PMI data release
Sector Rotation Analysis
Outperforming Sectors
1. Energy: Benefiting from geopolitical tensions and supply constraints
2. Financials: Rate cut cycle creating yield curve steepening opportunities
3. Resources: China stimulus hopes and infrastructure demand
Underperforming Sectors
1. Technology: Higher rates historically impacting growth valuations
2. REITs: Competition from rising dividend yields in other sectors
3. Consumer Discretionary: Economic uncertainty dampening spending
Trading Psychology and Market Sentiment
Sentiment Indicators
Put/Call Ratio: 0.85 (slightly bearish)
VIX Equivalent: Elevated but not extreme levels
Insider Trading: Moderate selling activity at current levels
Psychological Levels
9000: Major psychological resistance
8800: Key psychological support
8500: Crisis level support (low probability scenario)
Advanced Trading Setups
Harmonic Trading Opportunities
1. Bullish Bat Pattern: Completion at 8880-8900 zone
2. Bearish Gartley: Potential formation at 9020-9050 levels
3. AB=CD Pattern: Active completion zone 8950-8980
Gann-Based Setups
1. Square of 9 Trades: Long at 297° (8836), Short at 300° (9025)
2. Time Cycle Trades: Reversal zones at September 3-6 window
3. Angle Confirmation: 1x1 angle from August low providing dynamic support
Wyckoff Accumulation/Distribution
Current Phase: Late accumulation (Phase E potential)
Volume Characteristics: Decreasing volume on advances (concerning)
Composite Operator: Evidence of large player distribution above 8950
Technology Integration
Algorithmic Considerations
High-Frequency Impact: Increased volatility during 9:30-10:30 and 14:30-15:30 windows
Order Flow Analysis: Large block transactions evident at 8920 and 8970 levels
Market Microstructure: Bid-ask spreads widening above 8960
Recommended Tools
1. TradingView: Chart analysis and alert systems
2. Market Profile: Volume distribution analysis
3. Order Flow Software: Real-time institutional activity tracking
Conclusion and Weekly Outlook
The AUS200 stands at a critical juncture, trading near historical highs while facing seasonal headwinds and technical exhaustion signals. The combination of supportive monetary policy and strong year-to-date performance provides underlying bullish bias, but elevated RSI readings across multiple timeframes warrant cautious optimism.
Key Themes for September:
1. Range Trading: 8920-8980 likely to contain price action initially
2. Breakout Preparation: Monitor volume for sustained moves beyond range
3. Seasonal Weakness: Historical September underperformance requires defensive positioning
4. Policy Support: RBA accommodation providing floor for significant declines
Recommended Approach:
- Favor range trading over directional bias initially
- Reduce position sizes given elevated volatility expectations
- Focus on high-probability setups with multiple confluence factors
- Maintain disciplined risk management throughout September
The technical analysis suggests a market in transition, where traditional support and resistance levels will be tested against changing fundamental backdrops. Traders should remain flexible and prepared for both continuation and reversal scenarios as the market navigates this critical period.
---
*This analysis incorporates multiple technical methodologies and should be used in conjunction with proper risk management. Market conditions can change rapidly, and all trading decisions should be based on current market information and individual risk tolerance.*

Potential Double Top on AUS200 — 4HPotential Double Top on AUS200 — 4H 📉
I’m watching the AUS200 index closely for a potential short setup.
The pattern in focus is a double top forming on the 4-hour timeframe.
#GTradingMethod Tip: Always manage your risk first before dreaming about the profits.
Trade Details:
📊 Risk/Reward: 3.9
🎯 Entry: 8 906.3
🛑 Stop Loss: 8 941.8
💰 Take Profit 1 (50%): 8 788.9
💰 Take Profit 2 (50%): 8 726.2
Please note: This is not financial advice. This content is to track my trading journey and for educational purposes only.

UPDATE: Australia 200 treading nicely to profit targetAustralia is treading up on it's own as if it is not pulled by any weight.
Unlike many markets, there are fine reasons for the upside including:
📈 Strong earnings from major Aussie companies
🏦 RBA holding interest rates steady
🌏 Positive global market sentiment
🏗️ Mining & construction sectors booming
💵 AUD stability attracting investors
ANd technically, the updated version looks strong as well.
Cup and Handle formed on 12 May 2025,
Price broke up and out of it and since then has been treading nicely on a 45 degree uptrend.
Price> 20 and 200MA
Target 9,163
One could even close half profits here and let the rest ride on up.
Disclosure: I am part of Trade Nation's Influencer program and receive a monthly fee for using their TradingView charts in my analysis.

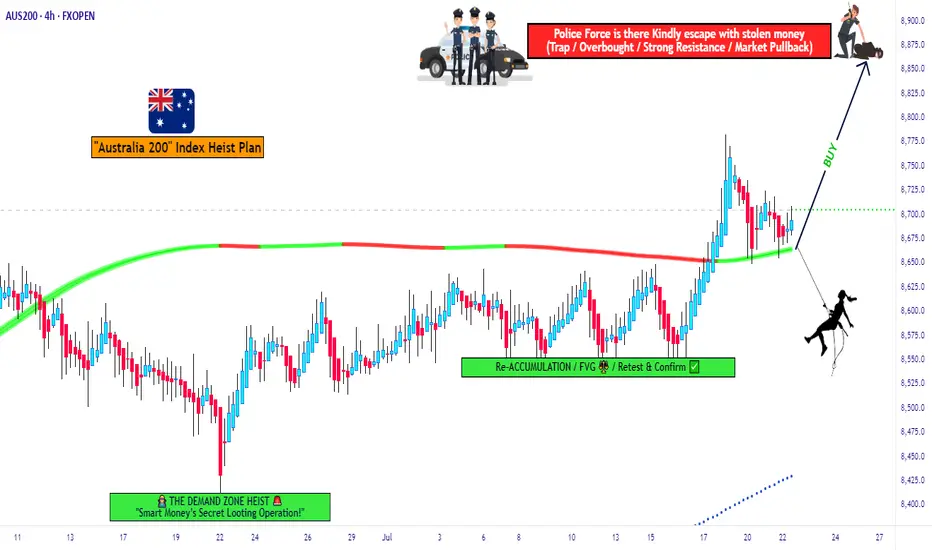
ASX200 Heist Blueprint – Entry, Exit, Escape Mapped Out!💼💣 The ASX200 Heist Blueprint: Bullish Loot Incoming! 🔥💰
🌍 Hi! Hola! Ola! Bonjour! Hallo! Marhaba! 👋
Welcome back, Money Makers & Market Robbers! 🤑💸✈️
It's time for another high-stakes heist, this time targeting the ASX200 / AUS200 “Australia 200” Index. Get your trading toolkit ready – we're planning a strategic, stealthy bullish operation based on Thief Trader’s signature blend of technical setups + macro fundamental analysis.
💹 ENTRY STRATEGY – "The Vault Is Open!"
The bullish loot is ripe for the taking. Watch for pullbacks on the 15M to 30M charts – layer in limit buy orders near recent swing lows or key levels.
🧠 Use DCA-style (Dollar Cost Averaging) layering to maximize your position like a smart thief scaling walls.
Every entry counts – but precision matters. Time your move, rob the dip, and don’t get caught by the bears. 🐂💥
🛡 STOP LOSS – "Don’t Trip the Alarm!"
Protect your capital like it’s the last stack of bills in the vault.
📉 Suggested SL: Near 4H swing low/high (e.g., 8620.0)
Always adjust based on:
Your risk tolerance
Position size
Number of open entries
Risk smart. The getaway must be clean. 🚁💨
🎯 TARGET – "8880.0 & Beyond!"
That’s the main exit point for our current job.
Expect tough resistance ahead – the police barricade zone where supply, exhaustion, and reversal pressure builds.
Book profits and treat yourself like a boss – your hustle deserves celebration! 💪🎉🍾
📊 Market Condition Overview
The ASX200 is currently in a bullish trend, supported by:
Risk-on sentiment globally 🌐
Aussie economic data strength 📈
Global indices correlation 🧩
Technical confirmations from Thief Trader tools 🔧
📌 Important Note – Stay Informed!
📢 Fundamentals Matter!
Tap into macro analysis, COT reports, geopolitical news, sentiment indicators, and intermarket flows. These are the real gears behind the charts.
📡 Always stay sharp and analyze what’s behind the candles.
⚠️ NEWS TRAP WARNING
🚨 Big news = big volatility. Don’t get caught during releases.
✔️ Avoid opening new positions around high-impact events
✔️ Use trailing SLs to protect open profits
✔️ Manage leverage like a pro thief manages their escape route
💖 Support the Thief Gang!
If this heist plan helped you, hit that Boost 💥 & Follow – it fuels our mission to help more traders rob the market cleanly and smartly.
Together we earn. Together we learn.
🧠💼 Stay tuned for more heist blueprints and tactical break-ins into global markets with the Thief Trading Style™.
🔥 Until next time, rob responsibly. 🕶💸🎯
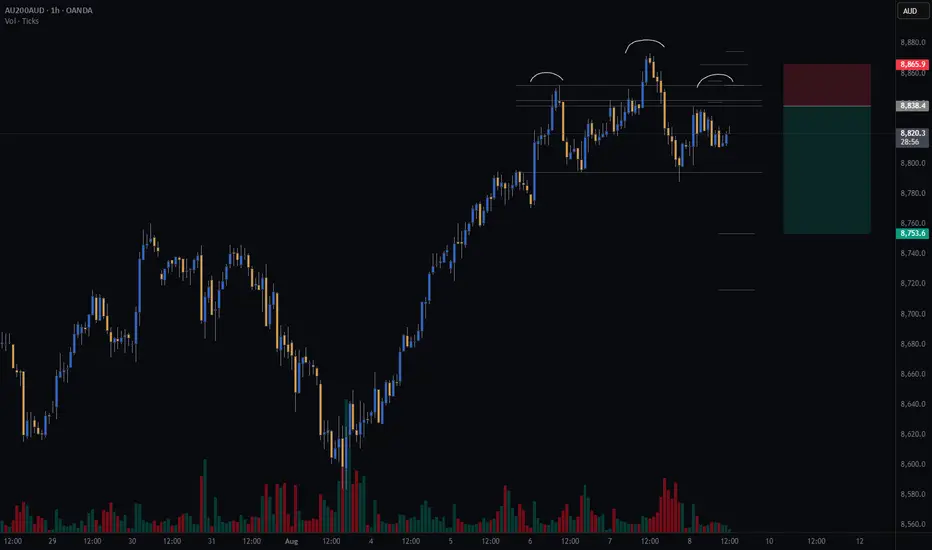
Watching for a Head & Shoulders on AUS200Watching AUS200 for a potential short setup — possible head and shoulders on the hourly chart. Left shoulder and head complete; waiting to see if right shoulder forms to confirm.
All my setup variables are met so far.
#GTradingMethod calculates take profits using the distance between the head’s peak and neckline, projected downwards.
Risk/Reward: 3.4
Entry: 8838.3
Stop Loss: 8865.8
TP1 (50%): 8753
TP2 (50%): 8716
Join the journey, what are your guys and girls thoughts on how to trade a head and shoulders, and does anyone track the AUS200?
Disclaimer: Please note, this is not financial advice. This content is intended to track my trading journey and for educational purposes only
SHORT AUS200/ASX200 - TIME TO SHORT THE AUSSIETeam, over the last few days, we have been successfully SHORT BOTH UK100/AUS200, but I did not post the chart
Today is a good time to post.
Ensure you understand your RISK - can always discuss with us in the room
Let's SHORT UK100/FTSE100, I still expect the market to be volatile even though the US expect a rate cut. on the 9th JULY, there will be a tariff announcement, and it could also extend towards September
We are SHORTING AUS200 at 8586 toward 8616 - SLOWLY
with target at 8562-47
DOUBLE THE SHORT AT 8632-56
Target at 8608-8592

AUS 200 on track to 9,163Whether the trade analysis does well or not, we need to update accordingly.
That's the life of traders and how we all weather through the markets, whether just starting out or whether you're highly experienced.
We don't Take losses personally but instead see them as strikes and data points.
In this case the AUD200 is moving up nicely towards the medium term target of 9,163.
And if the analysis changes, we will let you know.
Disclosure: I am part of Trade Nation's Influencer program and receive a monthly fee for using their TradingView charts in my analysis.

AUS200 UNDER ATTACK: TRADERS RAID THE TREND!🔥 Australia 200 HEIST: STEAL THE TREND LIKE A MARKET BANDIT! 🚨💰
Locked & loaded for the AUS200 (Australia200 Index) heist? This slick blueprint cracks the code to loot profits—blending killer technicals with macro intel. Ride the bullish wave, but dodge traps near the Overbought Zone. Bears lurk, so secure your bag before the reversal hits! 🐻💨
🎯 ENTRY: STRIKE LIKE A PRO THIEF
Long the breakout near 8430.00.
Set stealth alerts to catch moves in real-time. 🕶️🔔
🛡️ STOP LOSS: ESCAPE ALIVE
Hide stops under the last 2H swing low/wick—no reckless bets!
Adjust for your risk—survivors play smart. ⚡
💸 TAKE PROFIT: VANISH WITH THE LOOT
Main Target: 8650.00 (or bail early if momentum fades).
Scalpers: Trail stops & ghost out with quick wins. 🏃♂️💨
📡 WHY THIS HEIST WORKS
Australia 200’s on fire: Fundamentals + COT data + macro tides align.
Sentiment’s bullish, but stay sharp—links below for the full intel. 🔍🌐
⚠️ WARNING: NEWS = POLICE SIRENS
Avoid new trades during high-impact news. 📢
Lock profits with trailing stops if you’re already in. 🔐
🤝 JOIN THE TRADING MAFIA
Smash LIKE, drop a comment, & let’s dominate the AUS200 (Australia200)! �
Ready for the next big move? Stay tuned. 👀
Happy hunting, chart pirates! 🏴☠️📉

ASX 200 Rallies into Resistance ClusterIt can be useful to monitor several renditions of the same market, in order to identify higher probability support and resistance levels. And I would personally argue this becomes the more important if one trades CFDs exclusively.
Today I am comparing the ASX 200 cash market (XJO) and ASX 200 futures market (SPI 200, or AP1!) alongside the forem.com AUS200 CFD.
All three markets are approaching a key resistance cluster around 8,000. Neither the cash market nor futures market has broken above 8,000 yet and have several resistance levels (including a 61.8% Fibonacci ratio while the March low and December high) remain unbreached. Also note that futures volumes have been declining while prices rise, which shows a lack of bullish initiation (and also points to a short-covering rally).
Therefore, my bias is to fade into moves on the AUS200 should it breach its own 8,000, with the short bias becoming invalidated with a break above the 61.8% Fib level.
Matt Simpson, Market Analyst at City Index and Forex.com

Momentum Turns Against the ASXThe rally of the past two week on the ASX took a turn for the worse on Wednesday, on the warning (and official announcement) of Trump's 25% tariff on non-US cars.
This has seen the ASX get caught in the negative sentiment on Wall Street.
The daily chart shows that momentum has turned lower around a resistance cluster, including the December low, 38.2% Fibonacci ration and 20-day EMA. The daily RSI (2) reached a highly overbought level on Wednesday and now sits below 50, and the RSIK (14) has remained beneath 50 to show negative momentum overall.
A bearish divergence also formed on the 4-hour RSI ahead of the selloff.
The bias is for a move down to at least the 7930 area, a break beneath which brings the lows around 7850 into focus.
Matt Simpson, Market Analyst at City Index and Forex.com

AUS200 - time to double up Team, with the AUS200
hold tight for monday recovery
as the DOW - NAS expect to recover as closing time will likely push the AUS200 for monday recovery.

ASX200 H4 | Potential bullish bounceASX200 (AUS200) is falling towards an overlap support and could potentially bounce off this level to climb higher.
Buy entry is at 7,994.30 which is an overlap support that aligns with the 23.6% Fibonacci retracement.
Stop loss is at 7,859.00 which is a level that lies underneath an overlap support and the 50.0% Fibonacci retracement.
Take profit is at 8,092.48 which is an overlap resistance that aligns close to the 38.2% Fibonacci retracement.
High Risk Investment Warning
Trading Forex/CFDs on margin carries a high level of risk and may not be suitable for all investors. Leverage can work against you.
Stratos Markets Limited (www.fxcm.com):
CFDs are complex instruments and come with a high risk of losing money rapidly due to leverage. 63% of retail investor accounts lose money when trading CFDs with this provider. You should consider whether you understand how CFDs work and whether you can afford to take the high risk of losing your money.
Stratos Europe Ltd (www.fxcm.com):
CFDs are complex instruments and come with a high risk of losing money rapidly due to leverage. 63% of retail investor accounts lose money when trading CFDs with this provider. You should consider whether you understand how CFDs work and whether you can afford to take the high risk of losing your money.
Stratos Trading Pty. Limited (www.fxcm.com):
Trading FX/CFDs carries significant risks. FXCM AU (AFSL 309763), please read the Financial Services Guide, Product Disclosure Statement, Target Market Determination and Terms of Business at www.fxcm.com
Stratos Global LLC (www.fxcm.com):
Losses can exceed deposits.
Please be advised that the information presented on TradingView is provided to FXCM (‘Company’, ‘we’) by a third-party provider (‘TFA Global Pte Ltd’). Please be reminded that you are solely responsible for the trading decisions on your account. There is a very high degree of risk involved in trading. Any information and/or content is intended entirely for research, educational and informational purposes only and does not constitute investment or consultation advice or investment strategy. The information is not tailored to the investment needs of any specific person and therefore does not involve a consideration of any of the investment objectives, financial situation or needs of any viewer that may receive it. Kindly also note that past performance is not a reliable indicator of future results. Actual results may differ materially from those anticipated in forward-looking or past performance statements. We assume no liability as to the accuracy or completeness of any of the information and/or content provided herein and the Company cannot be held responsible for any omission, mistake nor for any loss or damage including without limitation to any loss of profit which may arise from reliance on any information supplied by TFA Global Pte Ltd.
The speaker(s) is neither an employee, agent nor representative of FXCM and is therefore acting independently. The opinions given are their own, constitute general market commentary, and do not constitute the opinion or advice of FXCM or any form of personal or investment advice. FXCM neither endorses nor guarantees offerings of third-party speakers, nor is FXCM responsible for the content, veracity or opinions of third-party speakers, presenters or participants.

ASX200/AUS200 "Australia 200" Indices Market Bearish Heist Plan🌟Hi! Hola! Ola! Bonjour! Hallo! Marhaba!🌟
Dear Money Makers & Thieves, 🤑 💰🐱👤🐱🏍
Based on 🔥Thief Trading style technical and fundamental analysis🔥, here is our master plan to heist the ASX200/AUS200 "Australia 200" Indices Market. Please adhere to the strategy I've outlined in the chart, which emphasizes short entry. Our aim is the high-risk Green Zone. Risky level, oversold market, consolidation, trend reversal, trap at the level where traders and bullish thieves are getting stronger. 🏆💸Book Profits Be wealthy and safe trade.💪🏆🎉
Entry 📈 : "The vault is wide open! Swipe the Bearish loot at any price - the heist is on!
however I advise placing Sell limit orders within a 15 or 30 minute timeframe. Entry from the most recent or closest low or high level should be in retest.
Stop Loss 🛑: Thief SL placed at (8360) swing Trade Basis Using the 3H period, the recent / swing high or low level.
SL is based on your risk of the trade, lot size and how many multiple orders you have to take.
Target 🎯: 8000 (or) Escape Before the Target
🧲Scalpers, take note 👀 : only scalp on the Short side. If you have a lot of money, you can go straight away; if not, you can join swing traders and carry out the robbery plan. Use trailing SL to safeguard your money 💰.
📰🗞️Fundamental, Macro, COT Report, Sentimental Outlook:
ASX200/AUS200 "Australia 200" Indices Market is currently experiencing a Bearish trend in short term, driven by several key factors.
⭐Fundamental Analysis
Earnings: Q4 2024 EPS growth strong for ASX 200 firms (e.g., banks, miners); Q1 2025 prelims suggest resilience—bullish.
Rates: RBA at 4.35% (stable, Feb 2025)—high yields vs. ECB (2.5%) pressure equities—bearish.
Inflation: Australia at 2.8% (Jan 2025)—above RBA’s 2-3% target, mixed impact.
Growth: GDP ~1.5% (Q4 2024 est.)—steady, mildly bullish.
Geopolitics: U.S.-China tariffs shift trade to Australia—bullish for miners.
⭐Macroeconomic Factors
U.S.: Fed at 3-3.5%, PCE 2.6%—USD softness aids AUD—bullish (Eurostat/U.S. data).
Eurozone: PMI 46.2—stagnation pressures global equities—bearish
Global: China 4.5%, Japan 1%—slow growth, commodity demand soft—bearish (ECB forecasts).
Commodities: Iron ore ~$100/ton, oil $70.44—stable, neutral for ASX miners/energy (global data).
Trump Policies: Tariffs (25% Mexico/Canada, 10% China)—benefits Australian exports—bullish.
⭐Global Market Analysis
Equity Markets: S&P 500 at 5,990, DAX ~19,000—range-bound, neutral correlation with ASX.
Commodities Influence: Stable mining/energy sectors (BHP, Rio Tinto) support ASX—bullish.
Liquidity: High trading volume reflects global interest—bullish stability.
⭐Commitments of Traders (COT) Data
Speculators: Net long ~60,000 contracts (down from 70,000)—cautious bullishness (global futures).
Hedgers: Net short ~65,000—stable, locking in highs.
Open Interest: ~130,000 contracts—steady global interest, neutral.
⭐Market Sentiment Analysis
Retail: 55% short contrarian upside—bullish potential.
Institutional: Mixed—optimism for miners, caution on rates—neutral.
Corporate: Firms hedge at 8,600-8,650—neutral.
Social media Trends: Bearish bias to 8,200-8,160—bearish short-term (
⭐Positioning Analysis
Speculative: Longs target 8,675-8,700, shorts aim for 8,080-8,000.
Retail: Shorts at 8,568-8,600—squeeze risk if price rises.
Institutional: Balanced, commodity-focused optimism.
⭐Next Trend Move
Technical:
Support: 8080-8000
Resistance: 8,675-8,700
Below 8,080 targets 8,000; above 8,675 aims for 8,750.
Short-Term (1-2 Weeks): Dip to 8,000 if risk-off persists; rebound to 8,700 if support holds.
Medium-Term (1-3 Months): Range 8,080-8,800, tariff-driven.
⭐Overall Summary Outlook
ASX 200 at 8,080.00 balances bullish fundamentals (earnings, tariffs, commodity stability) with bearish pressures (global slowdown, RBA rates, sentiment). COT shows cautious longs, positioning suggests short-term caution, and global trends support a dip before recovery. Short-term downside to 8,000 likely, with medium-term upside to 8,800 if macro stabilizes.
📌Keep in mind that these factors can change rapidly, and it's essential to stay up-to-date with market developments and adjust your analysis accordingly.
⚠️Trading Alert : News Releases and Position Management 📰 🗞️ 🚫🚏
As a reminder, news releases can have a significant impact on market prices and volatility. To minimize potential losses and protect your running positions,
we recommend the following:
Avoid taking new trades during news releases
Use trailing stop-loss orders to protect your running positions and lock in profits
💖Supporting our robbery plan 💥Hit the Boost Button💥 will enable us to effortlessly make and steal money 💰💵. Boost the strength of our robbery team. Every day in this market make money with ease by using the Thief Trading Style.🏆💪🤝❤️🎉🚀
I'll see you soon with another heist plan, so stay tuned 🤑🐱👤🤗🤩

AUS200 - LONG / BUYTeam, I missed out yesterday when the dipped at 8185, and I did not enter,
today is my opportunity to enter 8188
will add more at 8145, STOP LOSS at 8110
Target 1 at 8222-8242
Target 2 at 8265-8282
NOTE: once it breaks above 8215 or the first target, take partial and bring stop loss to BE.

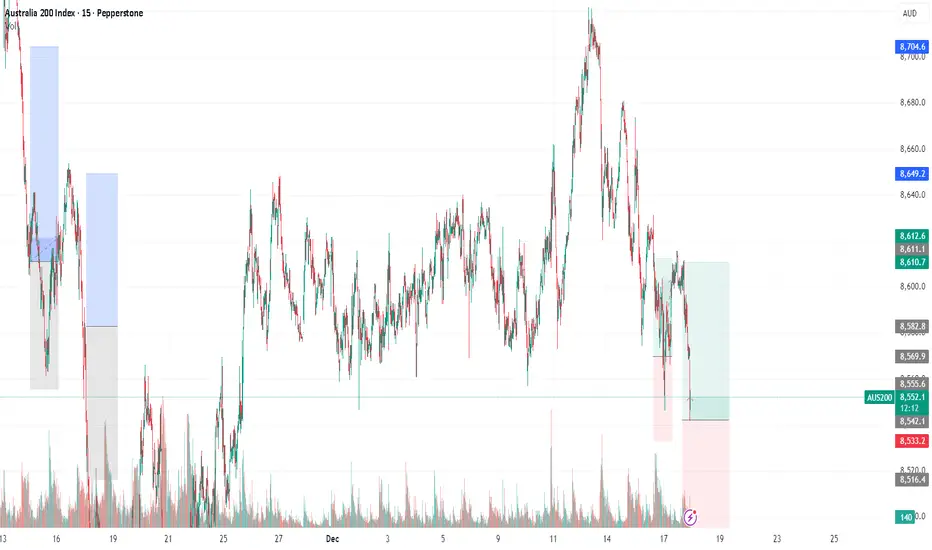
AUS200 "Australia 200" Indices Market Heist Plan🌟Hi! Hola! Ola! Bonjour! Hallo!🌟
Dear Money Makers & Robbers, 🤑💰🐱👤🐱🏍
Based on 🔥Thief Trading style technical and fundamental analysis🔥, here is our master plan to heist the AUS200 "Australia 200" Indices market. Please adhere to the strategy I've outlined in the chart, which emphasizes long entry. Our aim is the high-risk Red Zone. Risky level, overbought market, consolidation, trend reversal, trap at the level where traders and bearish robbers are stronger. 🏆💸Book Profits Be wealthy and safe trade.💪🏆🎉
Entry 📈 : "The vault is wide open! Swipe the Bullish loot at any price - the heist is on!
however I advise placing Buy limit orders within a 15 or 30 minute timeframe. Entry from the most recent or closest low or high level should be in retest.
Stop Loss 🛑: Thief SL placed at 8530 (swing Trade) Using the 1H period, the recent / nearest low level.
SL is based on your risk of the trade, lot size and how many multiple orders you have to take.
Target 🎯: 8750 (or) Escape Before the Target
Scalpers, take note 👀 : only scalp on the Long side. If you have a lot of money, you can go straight away; if not, you can join swing traders and carry out the robbery plan. Use trailing SL to safeguard your money 💰.
📰🗞️Fundamental, Macro, COT, Sentimental Outlook:
AUS200 "Australia 200" Indices Market market is currently experiencing a bullish trend,., driven by several key factors.
🔆Fundamental Analysis
Australia's GDP Growth Rate: 2.2% in Q4 2024, with a forecast of 2.5% in Q1 2025
Inflation Rate: Australia's inflation rate is expected to rise to 2.8% in 2025, from 2.5% in 2024
Interest Rates: The Reserve Bank of Australia (RBA) has kept interest rates on hold at 0.10%
🔆Technical Analysis
Trend Line: The index is holding above the ascending trend line
Moving Averages: The 200-period and 100-period Simple Moving Averages (SMA) are indicating a bullish bias
Relative Strength Index (RSI): The RSI indicator on the 4-hour chart stays above 50, indicating a bullish trend
🔆Economic Indicators
Unemployment Rate: Australia's unemployment rate is expected to remain steady at 4.2% in 2025
Retail Sales: Australia's retail sales are forecast to rise 3.5% in 2025, driven by consumer spending
Housing Market: Australia's housing market is expected to remain stable, with a forecast growth rate of 2.5% in 2025
🔆Macroeconomic Analysis
Global Economic Trends: The global economy is expected to grow at a moderate pace in 2025, driven by a recovery in trade and investment
Commodity Prices: Commodity prices are expected to remain stable in 2025, with some upside potential due to supply chain disruptions
Australia's Trade Balance: Australia's trade balance is expected to remain in surplus in 2025, driven by strong exports of commodities
🔆COT Data Analysis
Net Long Positions: Institutional traders have increased their net long positions in AUS200 to 60%
COT Ratio: The COT ratio has risen to 2.1, indicating a bullish trend
Non-Commercial Traders: Non-commercial traders, such as hedge funds and individual traders, have increased their long positions to 62%
🔆Sentimental Analysis
Institutional Sentiment: 58% of institutional traders are bullish on AUS200, while 42% are bearish
Bank Sentiment: 55% of banks are bullish on AUS200, while 45% are bearish
Corporate Sentiment: 56% of corporate traders are bullish on AUS200, while 44% are bearish
Retail Sentiment: 52% of retail traders are bullish on AUS200, while 48% are bearish
🔆Market Positioning
Long Positions: 60% of traders are long on AUS200, while 40% are short
Short Positions: 40% of traders are short on AUS200, while 60% are long
🔆Open Interest and Volume
Open Interest: 251,011 contracts (as of current date)
Volume: 151,201 contracts (as of current date)
🔆Next Move Prediction
Bullish Move: The AUS200 index is expected to continue its bullish trend, with potential upside to 8750
⚠️Trading Alert : News Releases and Position Management 📰 🗞️ 🚫🚏
As a reminder, news releases can have a significant impact on market prices and volatility. To minimize potential losses and protect your running positions,
we recommend the following:
Avoid taking new trades during news releases
Use trailing stop-loss orders to protect your running positions and lock in profits
📌Please note that this is a general analysis and not personalized investment advice. It's essential to consider your own risk tolerance and market analysis before making any investment decisions.
📌Keep in mind that these factors can change rapidly, and it's essential to stay up-to-date with market developments and adjust your analysis accordingly.
💖Supporting our robbery plan will enable us to effortlessly make and steal money 💰💵 Tell your friends, Colleagues and family to follow, like, and share. Boost the strength of our robbery team. Every day in this market make money with ease by using the Thief Trading Style.🏆💪🤝❤️🎉🚀
I'll see you soon with another heist plan, so stay tuned 🤑🐱👤🤗🤩

AUS200 shortI opened a short position yesterday based on 4H and daily chart.
My reasoning is as follows:
Daily
1) The price broked above the previous high (8525), failed it hold, and dropped and closed below the previous higher high.
2) It moved and closed below the ascending trendline.
3) All momentum indicators are now moving to the downside.
4H
1) The candles consolidated below the ascending treandine and failing to move above the line.
2)The price broked beow Fib 0.238.
3)Both MACD and RSI entered the bear territory.
Entry - 8483
S/L - 8580
Target - 8256
Risk:Reward - 1:2.65

PREPARE TO SHORT AUS200Team, the interest rate will be announced in 4 hours
SET DOUBLE SHORT at 8632-58 - our target at 8592-98
SET SHORT AUS200 at 8580-92
Target 1 at 8532-26
Target 2 at 8505-8493
Target 3 at 8455-65

ASX200 outlook ahead of RBA Rate Decision The ASX200 (AUS200) price action sentiment appears bullish, supported by the longer-term prevailing uptrend. The recent intraday price action appears to be a corrective pullback. towards the previous consolidation price range and also the rising support trendline zone.
The key trading level is at the 8490 level, the previous consolidation price range, and also rising support trendline zone. A corrective pullback from the current levels and a bullish bounce back from the 8490 level could target the upside resistance at 8570 followed by the 8620 and 8650 levels over the longer timeframe.
Alternatively, a confirmed loss of the 8490support and a daily close below that level would negate the bullish outlook opening the way for a further retracement and a retest of 8450 support level followed by 8420.
This communication is for informational purposes only and should not be viewed as any form of recommendation as to a particular course of action or as investment advice. It is not intended as an offer or solicitation for the purchase or sale of any financial instrument or as an official confirmation of any transaction. Opinions, estimates and assumptions expressed herein are made as of the date of this communication and are subject to change without notice. This communication has been prepared based upon information, including market prices, data and other information, believed to be reliable; however, Trade Nation does not warrant its completeness or accuracy. All market prices and market data contained in or attached to this communication are indicative and subject to change without notice.

ASX200 (AUS200) uptrend continuation retest 8460 level?The ASX200 (AUS200) price action sentiment appears bullish, supported by the longer-term prevailing uptrend. The recent intraday price action appears to be a corrective pullback. towards the previous consolidation price range and also the rising support trendline zone.
The key trading level is at the 8460 level, the previous consolidation price range, and also rising support trendline zone. A corrective pullback from the current levels and a bullish bounce back from the 8460 level could target the upside resistance at 8570 followed by the 8620 and 8650 levels over the longer timeframe.
Alternatively, a confirmed loss of the 8460support and a daily close below that level would negate the bullish outlook opening the way for a further retracement and a retest of 8400 support level followed by 8376.
This communication is for informational purposes only and should not be viewed as any form of recommendation as to a particular course of action or as investment advice. It is not intended as an offer or solicitation for the purchase or sale of any financial instrument or as an official confirmation of any transaction. Opinions, estimates and assumptions expressed herein are made as of the date of this communication and are subject to change without notice. This communication has been prepared based upon information, including market prices, data and other information, believed to be reliable; however, Trade Nation does not warrant its completeness or accuracy. All market prices and market data contained in or attached to this communication are indicative and subject to change without notice.
