F | Possible 3 Year Long Consolidation Over | LONGFord Motor Co. engages in the manufacture, distribution, and sale of automobiles. It operates through the following segments: Ford Blue, Ford Model E, Ford Pro, Ford Next, Ford Credit, and Corporate Other. The Ford Blue, Ford Model E, and Ford Pro segment includes the sale of Ford and Lincoln vehicles, service parts, and accessories, together with the associated costs to develop, manufacture, distribute, and service the vehicles, parts, and accessories. The Ford Next segment is involved in the expenses and investments for emerging business initiatives aimed at creating value for Ford in vehicle-adjacent market segments. The Ford Credit segment consists of the Ford Credit business on a consolidated basis, which is primarily vehicle-related financing and leasing activities. The Corporate Other segment refers to corporate governance expenses, past service pension and OPEB income and expense, interest income and gains and losses from cash, cash equivalents, and marketable securities, and foreign exchange derivatives gains, and losses associated with intercompany lending. The company was founded by Henry Ford on June 16, 1903 and is headquartered in Dearborn, MI.
Auto

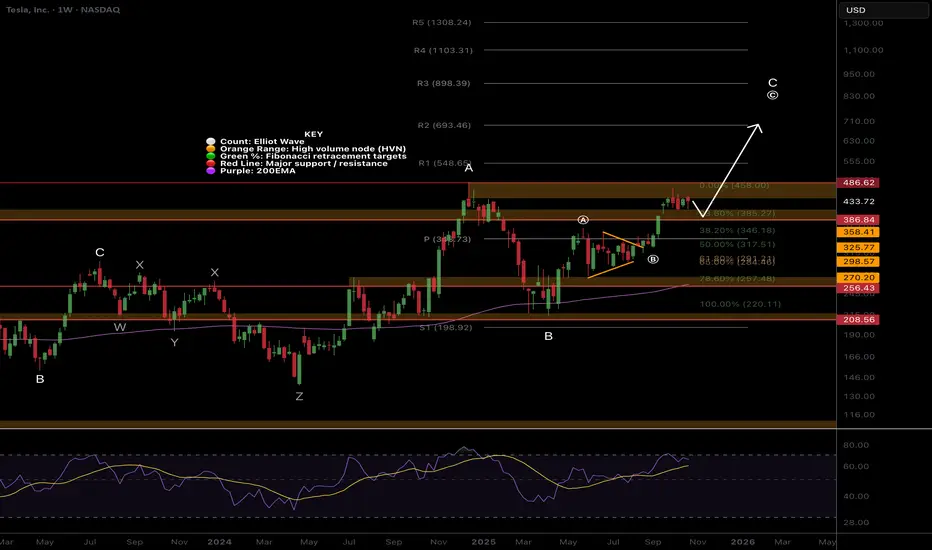
Tesla preparing for all time highs?NASDAQ:TSLA Price is ranging below all all-time high, well above the weekly pivot and 200EMA, which is bullish.
Wave © of C appears to be underway into price discovery with a target of $730, the R2 weekly pivot. This is because it has been printing a series of 3 wave structures. Wave B printed a triangle, which is a pattern found before a terminal move, reinforcing the Elliot wave count.
🎯 Terminal target for the business cycle could see prices as high as $730 based on Fibonaci extensions
📈 Weekly RSI is just below overbought so has room to grow
👉 Analysis is invalidated if we close back below wave (B), $280
Safe trading

GM | New All Time Highs Incoming Before the Drop | LONGGeneral Motors Co. engages in the designing, manufacturing, and selling of trucks, crossovers, cars, and automobile parts, and in providing software-enabled services and subscriptions. It operates through the following segments: GMNA, GMI, Cruise, and GM Financial. The company was founded by William C. Durant on September 16, 1908 and is headquartered in Detroit, MI.

TSLA, consolidation below ATH often leads to a breakout..Tesla sentiment was very negative in April as Trump and Elon argued online causing a lot of whipsaw volatility and scaring out investors. The bottom quickly followed.
Price is ranging below all time high. Price is above the weekly pivot and 200EMA which is bullish and has momentum.
Wave © of C appears to be underway into price discovery with a target of $693 the R2 weekly pivot. This is because it has been printing a series of 3 wave structures. Wave B printed a triangle which is a pattern found before a terminal move reinforcing the Elliot wave count.
🎯 Terminal target for the business cycle could see prices as high as $690 based on weekly pivots
📈 Weekly RSI is just below oversold with no divergence and can remain here for months as price keeps increasing.
👉 Analysis is invalidated if we close back below wave (B), $280

$TSLA higher to go!Price continues towards price discovery finding resistance at the previous all time High Volume Node. Price is above the weekly pivot and 200EMA which is bullish and has momentum.
Wave © of C appears to be underway into price discovery with a target of $693 the R2 weekly pivot. This is because it has been printing a series of 3 wave structures. Wave B printed a triangle which is a pattern found before a terminal move reinforcing the Elliot wave count.
RSI is not yet overbought.
Safe trading
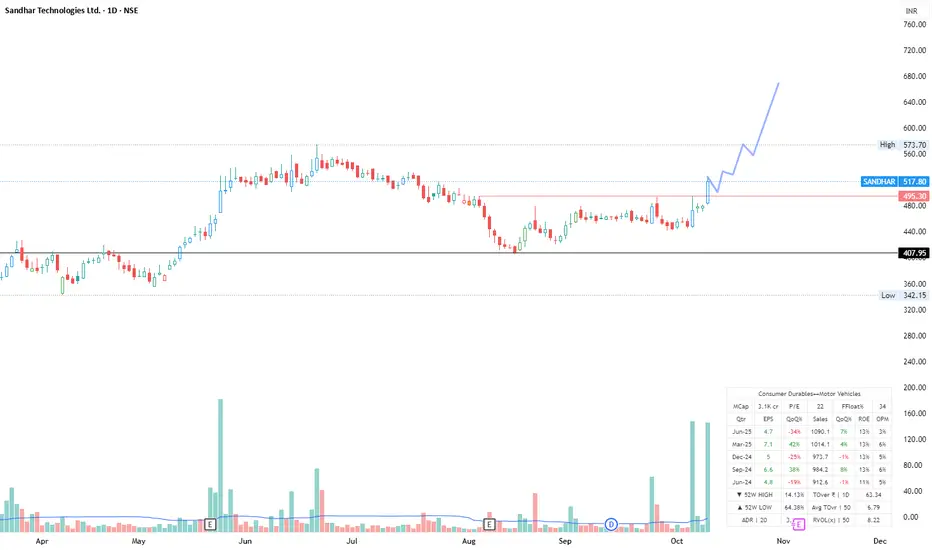
Sandhar Tech - Go LongSandhar Tech an Auto Spare part company gave a breakout with good volume potentially ready for another rally . May consolidate for few days and then it can give another breakout. SL will be 440 with an potential upside of of 680
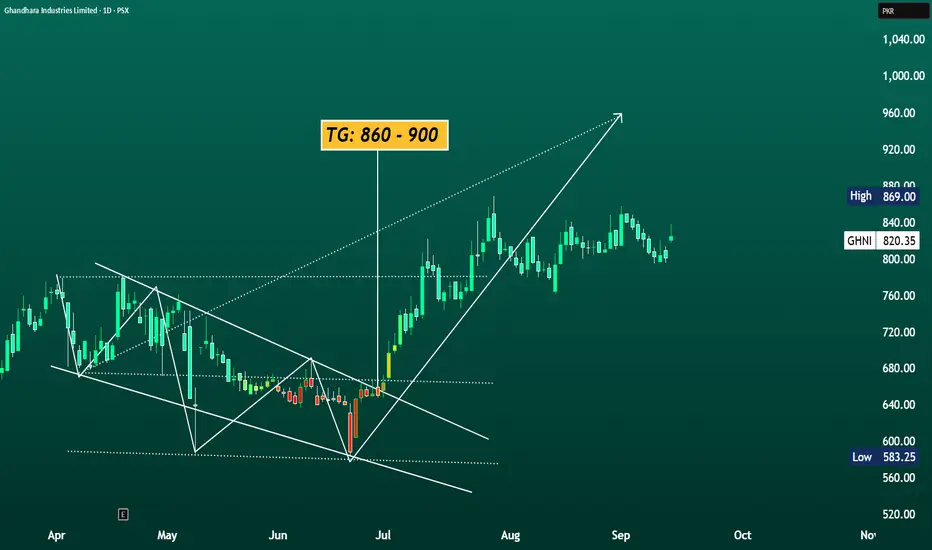
GHNI TARGETING: 900 ??#GHNI has been consolidating in a range and is now showing signs of strength with upside potential. The chart suggests a possible move towards the target zone: 860 – 900 if momentum sustains.
Chart Highlights:
✅ Current price: 821.11
✅ Consolidation breakout attempt in progress.
📌 Resistance: 841 - 869
📌 Support: 796 - 760 short-term, strong support near 745.
⚠️ Disclaimer:
This post is for educational purposes only and not financial advice. Trading/investing involves risks – always DYOR (Do Your Own Research) or consult a licensed financial advisor before making decisions.
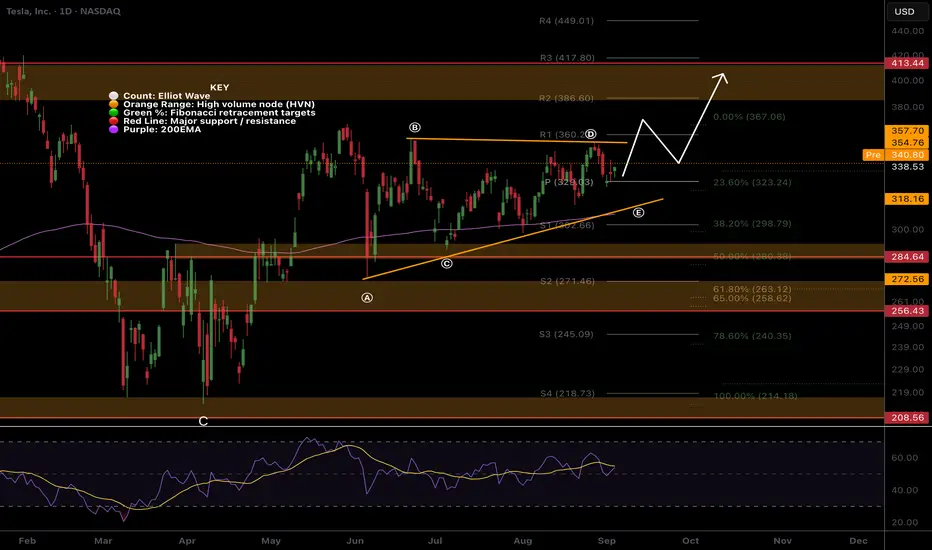
TSLA Creeping up from original triangle, but still in a larger tNASDAQ:TSLA continues to take the stairs of worry up to my trading signal target from the original triangle analysis, $386, but the pattern has morphed into what appears to be a barrier triangle now as price struggles at $360 with a series of higher lows.
RSI is comfortable at the EQ with room to grow while price remains above the daily pivot.
Analysis is invalidated below wave (C) $284
Safe trading
TESLA Bullish Wave C still underway...NASDAQ:TSLA is a tough count, the entire macro chart looks like a complex correction (wave 4?) with many series of 3 wave structures.
A triangle in wave B of the current wave appears complete, leading to a terminal thrust up with a target of the High Volume Node resistance at $410 followed by a poke above the swing high touching the R1 pivot at $548.
RSI remains at the EQ.
Analysis is invalidated below the wave B triangle.
Safe trading

$LKQ — LKQ Corporation (NASDAQ:LKQ) August 27, 2025.NASDAQ:LKQ #LKQ — LKQ Corporation (NASDAQ:LKQ) Investment Analysis Report | Consumer Cyclical | Auto Parts | USA | NASDAQ | August 27, 2025.
Executive Summary
LKQ Corporation (NASDAQ: LKQ), a leading provider of alternative and specialty automotive parts, has seen notable insider buying activity in late August 2025, underscoring potential undervaluation amid a sector-wide slowdown.
On August 27, 2025, Director Andrew C. Clarke purchased 5,000 shares at $31.95 per share (total value $159,773), increasing his holdings to 21,172 shares.
Concurrently, President and CEO Justin L. Jude acquired 5,686 shares at $31.50 per share (total value $178,574), boosting his stake to 286,446 shares. These open-market buys follow a pattern of executive confidence, contrasting with prior sales by former directors.
Technical indicators point to a high-probability rebound from oversold conditions, with the stock at $32.08 exhibiting a potential bottoming formation on both daily and weekly charts, supported by stabilizing RSI and volume upticks. Q2 2025 earnings revealed revenue of $3.6 billion (down 1.9% YoY) but a slight net income increase, with strategic divestitures like the $410 million sale of the Self Service segment (announced August 26, 2025) aimed at simplifying operations and strengthening the balance sheet.
The auto parts sector faces headwinds from U.S. tariffs and sluggish demand, with projected 2025 U.S. vehicle sales declining 4-7%, yet LKQ's focus on aftermarket parts positions it for resilience.
Replicating the insiders' average entry at ~$31.73 suggests 20-50% upside potential over 3-6 months, targeting $38-$48, driven by divestiture proceeds and potential margin expansion.
With Zacks Rank equivalent to Buy and institutional accumulation, we rate LKQ as a moderate-conviction long, recommending 1-3% allocation for value-oriented portfolios amid cyclical risks.
Company Profile
LKQ Corporation is a global distributor of vehicle products, including replacement parts, components, and systems used in the repair and maintenance of vehicles. Operating through segments like Wholesale-North America, Wholesale-Europe, and Specialty, LKQ serves collision and mechanical repair shops, dealerships, and individual consumers via an extensive network of salvage yards and warehouses.
The company emphasizes sustainability through recycled and remanufactured parts, capitalizing on the growing aftermarket demand.
Key financial metrics as of August 27, 2025:
• Market Capitalization: $8.25 billion
• Enterprise Value: $13.91 billion (approx.)
• Earnings Date: 10/23/2025
• Put Call Ration: 0.03
• Put Volume: 20.00
• Call Volume: 718.00
• Insider Ownership: 0.69%
• Institutional Ownership: 106.51%
LKQ's strategy includes bolt-on acquisitions and operational efficiencies, with recent divestitures streamlining focus on core wholesale operations in a $300 billion global auto parts market.
Charts:
• (1D)
• (5D)
Insider Trades:
LKQ Ownership:
SEC From 4:
www.sec.gov
www.sec.gov
Insider Trading Context
Insider purchases in cyclical sectors like auto parts often signal undervaluation and anticipated recovery, particularly when executed by board members and executives with operational oversight.
The August 27, 2025, buys by Director Andrew C. Clarke (5,000 shares at $31.95) and President/CEO Justin L. Jude (5,686 shares at $31.50) total over $338,000 in value, occurring near multi-month lows and post-Q2 earnings. Clarke's transaction marks his first buy in 2025, while Jude's adds to prior accumulations.
This activity contrasts with earlier proposed sales by former Director Dominick P. Zarcone (e.g., 15,000 shares at $39.87 in June 2025), shifting net insider sentiment to positive. Year-to-date, insiders have net bought ~18,386 shares, valued at ~$638,464, excluding grants. Such clustered executive buying, especially post-divestiture announcements, suggests insiders view the current price as attractive, potentially anticipating margin improvements from the $410 million Self Service sale proceeds, which will reduce debt and fund growth.
Historically, similar patterns in auto parts stocks yield 15-25% outperformance over six months.
➖➖➖
Technical Analysis
The daily chart for LKQ illustrates a bearish-to-neutral transition, with price declining from $45 highs in April 2025 to $32.08 amid sector pressures, but showing early reversal signs for a high-probability (70-80%) short-term bounce. A descending channel dominates, with lower highs/lows, but recent candles form a potential double bottom near $30.50-$31.50, supported by a hammer on August 27 with 1.73 million volume—20% above average—indicating buying interest.
Key indicators:
• Moving Averages: Price below 20-day SMA ($30.59), 50-day SMA ($34.25), and 200-day SMA ($38.21), confirming downtrend; however, the 20-day is flattening, and a crossover above could signal reversal.
• Relative Strength Index (RSI, 14-period): At 50.11 (neutral), up from oversold <30 in July, with bullish divergence (higher RSI lows vs. price lows).
• MACD: Line at -0.85, signal at -1.02; histogram narrowing positively, hinting at momentum shift.
• Volume Trends: Declining during downswings but spiking on green days (e.g., +1.9% on August 27), supporting accumulation.
• Candlestick Patterns: Recent doji and hammers suggest indecision/resolution; breakout above $34 (channel upper) targets $38.
• Support and Resistance: Support at $31.00 (recent low) and $29.50 (psychological). Resistance at $34.00 (50-day SMA), $36.00 (prior pivot), and $38.00 (200-day SMA).
The weekly chart reinforces a longer-term base, with RSI at 37.21 (oversold edge) and volume stabilizing.
Overall, the setup favors longs with 20-30% upside if $34 breaks, aligning with hedge fund plays on undervalued cyclicals.
News & Fundamental Drivers
Fundamentally, LKQ's Q2 2025 earnings (July 24, 2025) highlighted resilience: revenue $3.6 billion (down 1.9% YoY due to softer European demand), but net income rose slightly on cost controls, with EBITDA margins at 13.5%.
Analysts project FY2025 EPS at $3.45 (forward P/E 9.3), with revenue growth of 2-4% in H2 from inventory optimization.
Recent catalysts:
➖ August 26, 2025: Agreed to sell Self Service segment (Pick Your Part) for $410 million to Pacific Avenue Capital, simplifying structure and focusing on wholesale; expected close Q4 2025, proceeds to reduce debt.
➖ August 21, 2025: Appointed automotive leader John Mendel as Chairman, enhancing board expertise.
➖ August 7, 2025: To present at investor conference, potentially unveiling updated guidance.
Sector Outlook: Auto parts face 2025 headwinds from U.S. tariffs (potentially 10-25% on imports) and declining vehicle sales (4-7% drop in U.S.), but aftermarket demand remains steady amid aging fleets and EV transitions.
LKQ's recycled parts niche provides insulation, with analysts like Robert W. Baird maintaining Outperform at $42.
Hedge fund flows show net buys in Q2 2025 ($610M buys vs. $407M sells), with Vanguard and BlackRock increasing stakes
➖➖➖
Trade Setup & Forecast
Replicating the August 27 insider buys at an average entry of $31.73 (blending Clarke and Jude's prices) positions for asymmetric upside in a recovering auto parts play. Assuming catalysts like divestiture closure and margin gains materialize, we forecast:
Entry Price : $31.73
Potential Growth: 20-50% over 3-6 months, with 70% probability of 25%+ returns based on technical breakout and sector mean reversion.
Exit Targets:
➡️ Short-Term (Target 1): $38.00 (20% profit, +$6.27/share)
➡️ Mid-Term (Target 2): $42.00 (32% profit, +$10.27/share)
➡️ Long-Term (Target 3): $48.00 (51% profit, +$16.27/share)
This setup leverages insider timing, with expected catalysts driving re-rating to 12x forward P/E.
In summary, LKQ's recent insider purchases by Director Clarke and CEO Jude at ~$31.73, amid a strategic divestiture and stabilizing fundamentals, present a compelling value opportunity in a challenged but resilient auto parts sector. Technicals indicate a high-probability rebound with 20-50% upside to $38-$48 over 3-6 months, supported by cost efficiencies and potential tariff navigation. Risks are manageable given the balance sheet strength and insider alignment.
Recommendation : Strong Buy with 25-35% potential upside over the next 6 months; initiate positions at current levels with 1-3% allocation, scaling on dips below $32.
Disclaimer: This report is for informational purposes only and does not constitute investment advice. Past performance is not indicative of future results.

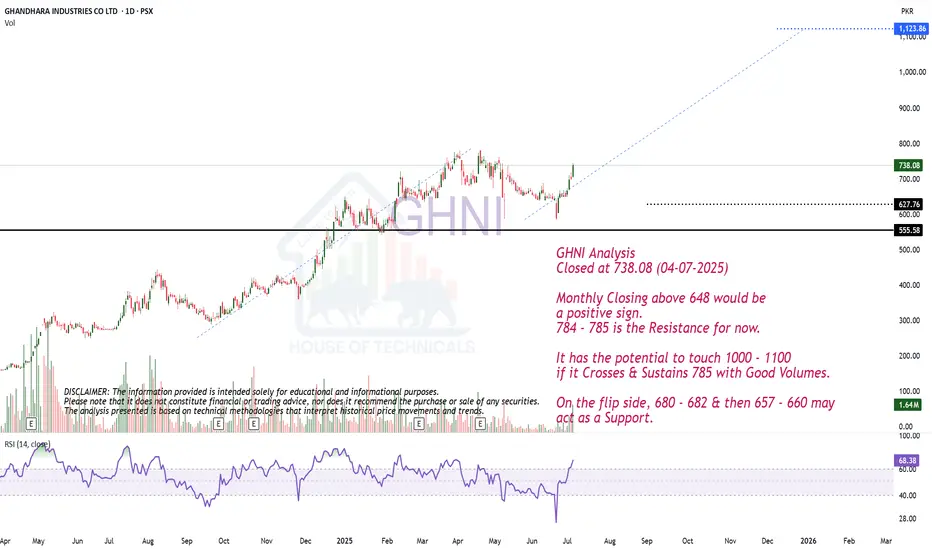
ABCD PatternGHNI Analysis
Closed at 738.08 (04-07-2025)
Monthly Closing above 648 would be
a positive sign.
784 - 785 is the Resistance for now.
It has the potential to touch 1000 - 1100
if it Crosses & Sustains 785 with Good Volumes.
On the flip side, 680 - 682 & then 657 - 660 may
act as a Support.
Play on Levels.GAL Analysis
Closed at 408.92 (03-07-2025)
Important Support is around 367 - 382
Resistance is around 433 and then around
450 - 455.
Crossing 460 may lead it towards 500+
However, breaking 365 may bring more
selling pressure towards 340.

Not BullishWhen Carvana finishes this completely manipulated bullrun, it will be devastating. Typically extended 5th waves will correct at a minimum back down to wave 2 of said 5th wave. That means $50.
The stock was in an expanding formation which it broke out from and then failed back into. Very bearish. That is also the same type of pattern that Bitcoin displayed years ago before a major bear market. I think the top is in here, but we'll see.
To get that crash down to $50, something will have to come out in the news most likely about Carvana's stock manipulation and the ghost companies they are using to inflate cash flows. That is purely just a theory though. Perhaps they are squeaky clean and it's totally justified that their stock rose as much as it has, but...I'm not in that camp.
Not to mention all the upper management basically sell their stocks every week. Tens of millions of dollars are being siphoned out by the board and upper management almost every single week. The CEO by himself is cleaning house almost every other day lately. www.sec.gov

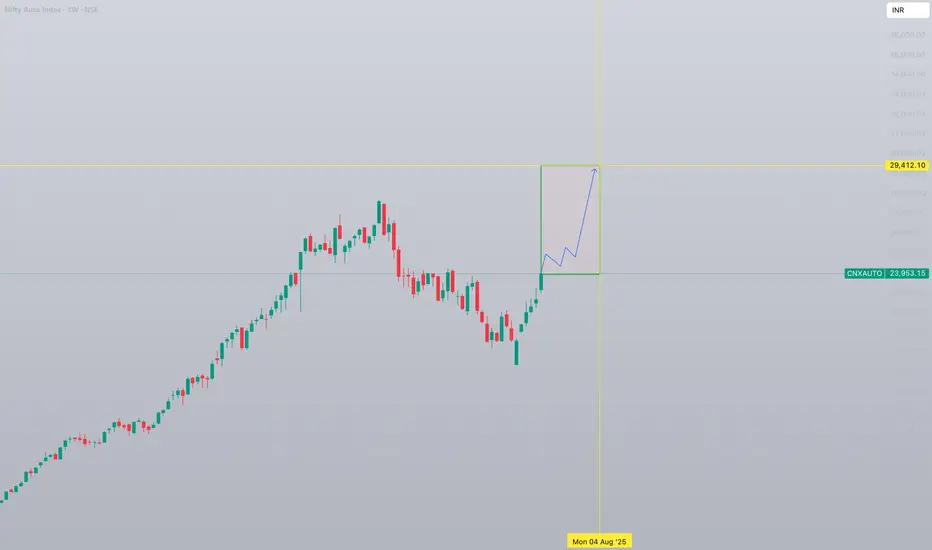
Nifty Auto Index 1W forecast until August 2025NSE Auto Index is in "discharge" mode. This will last until the level of 25000 followed by a sideways-cooldown movement.
Bullish structure will stay intact and the second bullrun will happen shortly.
Major correction/retest will happen after the breakout of previous all-time-high and setting a new ATH with a top at 29,500 in the beginning of August 2025.
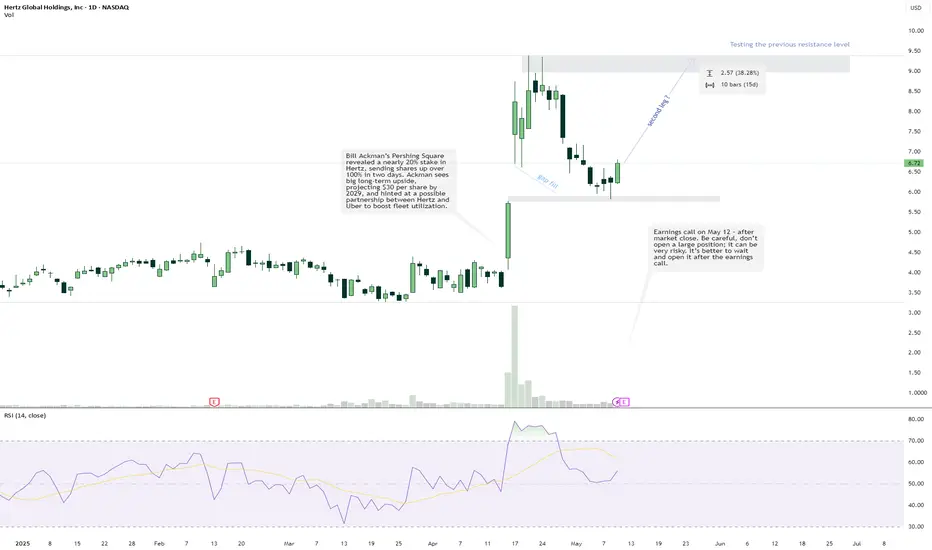
$HTZ Hertz - Second Leg UpMassive move after Ackman’s 20% stake news sent NASDAQ:HTZ flying over +100%. Price filled the gap and looks ready to retest the previous resistance zone near $9 (marked).
I’m staying cautious into May 12 earnings (after market). Historically, Hertz tends to fade post-earnings. Safer to wait for the dust to settle.
Potential setup:
Entry: Watch for a breakout + retest of $7.20–$7.50
First target: $9 zone
Risk level: Below $5.50 (invalidates setup)
Confidence: Medium (depends on post-earnings reaction)
RSI recovering from neutral, but no FOMO here. Patience wins. I’ll update if conditions change.
Weekly Closing above 290 - 291 is very positive.Weekly Closing above 290 - 291 is very positive.
Monthly Closing should not go below 263.
284 - 298 is actually a Very Strong Support.
Resistance as of now is around 340 and then 360.

Hidden Bullish Divergence on Shorter Time Frame.Check out the levels for HCAR of all time frames from Monthly, Weekly to Daily.
Hidden Bullish Divergence on Shorter Time Frame.

Porsche (PAH3): German Auto Industry under pressureLooking at Porsche on the monthly chart, we’re analysing its entire price history since becoming a publicly listed company in April 2001. After a massive rally to its peak at €160, the stock experienced a sharp decline back to its IPO levels. Since then, it has traded within a well-defined range between €94 (range high) and €35 (range low), with the mid-range around €65.
Each time the range low was reached, the price subsequently moved back toward the range high, demonstrating the typical characteristics of a range-bound market. Now that Porsche is back at the range low, coupled with the RSI at its second-lowest level ever, we see this as a strong opportunity to gain some exposure to the German automotive market.
Admittedly, the German auto industry is under pressure, with Porsche's deliveries to China down 29% year-over-year. Chinese EVs are currently outpacing German luxury cars in technology, making it difficult for Porsche to regain market share. However, this level represents one of the best opportunities for a swing trade.
If the range low is broken and prices drop to COVID-era levels, Porsche would face significant challenges, requiring major developments to recover. For now, we expect a move back toward the range high over time. While this is a long-term play given the monthly timeframe, it offers a promising swing trade setup.
Key Levels:
Range Low: €35
Mid-Range: €65

Is DIMO the next XYO?They are a small cap, $60M in circ, but 200M fully diluted. Its DePIN and focused on making all cars smart cars, but seems really similar to what xyo is doing and Dimo also already has like 150k cars participating in their project.
Really this is looking at playing a low cap riding the coattails of a trend. Its almost like DePIN could be to this run what defi was to the last crypto run. If you are not familiar with DePIN, it basically cuts out the middle man and lets users get paid incentives directly for their participation.
-------------------------------------------------
Decentralized Physical Infrastructure Networks (DePIN) is an emerging concept in blockchain and Web3 that integrates decentralized technologies with real-world physical infrastructure. The goal of DePIN is to enable decentralized ownership, coordination, and monetization of tangible, real-world assets and networks.
-------------------------------------------------
For example, sharing your gps data from your car, you could get paid directly, with BAT/Brave browser for example, you get advertising dollars that normally an advertiser would pay to an ad network that the user would never see any of the money and instead, the user gets payouts directly to their wallet for viewing advertisements.
DIMO happens to be directly related to sharing location details and similar metrics and getting paid for doing so, similar to XYO, they have more than just DePIN in common.
Anyway, its low cap low volume, be careful with this one, high risk, but also potential for decent reward. Look for a break out or accumulate along support lines.
Also note that BTC is struggling a little bit where its at right now and also has lost significant market domination recently, for the first time in the last 2 years. BTC pullbacks tend to affect the entire market, but we have seen that it seems many alts are bucking the down trend as traders look for somewhere to put trading dollars as the broad market pulls back.
DYOR, be vigilant.

LI AUTO EARNINGS CHART HALLOWEEN EDITIONRSI labeled
Trends labeled
this chart is more short term and I included a projection that you don't want to follow exactly as it's just to show an idea and allow me to check back.
Instead follow the price targets and main trend line which is purple.
Earnings sees a lot of stocks move a lot over a SHORT time, which makes a move that brings price down and quickly back up and can set it on the next projection, which ultimately would see it go down based on past things seen.
Fundamentals not included in this chart analysis
This is all ta with an aggressive approach towards earnings, and sometimes highly inaccurate.
Good luck traders
Make sure to view more charts than just this idea.
Per this idea to state it clearly, DROP then BIG up to close price gaps and possibly set a new high, which ultimately takes it down to a lower price and gives it a long term projection of bullish. Again, fundamentals not included.
The ??? is a zone where this chart is highly out of date and I have no clue where it should be or could be heading other than that, the projections extended out show the marked area where you might expect to see the "trends" meet up again and allow the entry and exit prices to actually fit within a reasonable time frame.
Pumpkin included because spooky day theme.
lol, hope all this helps you in your decision with this or at least gives you another view on earnings to consider.

Tesla (TSLA): Stuck in a Range after Robo Taxi rumors fizzledAfter being stopped out on our second entry in Tesla, it's time to take another look, although it has been quite uneventful since the big rise on the Robo Taxi rumors back in July. It was a classic “buy the rumor, sell the news” event, showcasing how markets tend to price in events well ahead of their occurrence. Musk's statement that Cybercab production could begin "before 2027" is also seen as highly questionable, given his history of missed deadlines.
Tesla recently got approval from local authorities near its gigafactory in Berlin to move forward with its three-stage expansion plan. Despite protests from locals, this approval allows the company to start building infrastructure for storage facilities, a battery cell test lab, and logistics areas. All of this will take place on land already owned by Tesla. Whether this expansion will be beneficial or problematic for the company remains to be seen in the coming months.
Currently, we still have our limit order from $177 running, and things are looking alright. To better illustrate the situation, we added a fresh chart of Tesla’s range, which clearly shows the situation. After reclaiming the range middle in July, Tesla briefly dipped below but rebounded perfectly from $183, a critical POC (Point of Control). Since July, Tesla hasn’t made any new higher highs, nor has it made lower lows, placing the stock in a tight range. If Tesla loses the range middle, we could see a drop to $183 or even $160. On the upside, breaking above the range high would be essential for further momentum.
It's crucial to focus on higher time frame levels and avoid getting caught up in short-term news or noise. We’ll continue to monitor Tesla’s key levels and update you if any significant movement occurs. 🤝

CVNA Carvana - Is it on your watchlist?CVNA Carvana is starting to move above the 200 day EMA 'watermark'. As interest rates level off and eventually come down, the consumer will have a green light to make big purchases again. CVNA shows a lot of opportunity (800%?) between current price and all-time highs. Why is Carvana not on your watchlist?

EICHER Motors is around Long term support Eicher Motors is around the medium term support !!
Stock has never broken support working from 2020
Log Chart support is working beautifully and has support around 3500-3600
On a Linear Chart stock has made 2 support and recently short term support working
Linear chart support is around 3480-3520 !!
Stock is Goof until support is intact !!
Thanks !!
Disclaimer : We are not SEBI registered analyst. Do your own research before taking any investment decision.
