Volkswagen stuck in reverse?Volkswagen - Short Term - We look to Sell at 145.76 (stop at 152.42)
The medium term bias remains bearish. Broken out of the channel formation to the downside. We have a Gap open at 145.76 from 19/08/2022 to 22/08/2022. Preferred trade is to sell into rallies.
Our profit targets will be 120.52 and 115.00
Resistance: 145.76 / 151.50 / 160.86
Support: 137.68 / 128.10 / 120.56
Disclaimer – Saxo Bank Group. Please be reminded – you alone are responsible for your trading – both gains and losses. There is a very high degree of risk involved in trading. The technical analysis, like any and all indicators, strategies, columns, articles and other features accessible on/though this site (including those from Signal Centre) are for informational purposes only and should not be construed as investment advice by you. Such technical analysis are believed to be obtained from sources believed to be reliable, but not warrant their respective completeness or accuracy, or warrant any results from the use of the information. Your use of the technical analysis, as would also your use of any and all mentioned indicators, strategies, columns, articles and all other features, is entirely at your own risk and it is your sole responsibility to evaluate the accuracy, completeness and usefulness (including suitability) of the information. You should assess the risk of any trade with your financial adviser and make your own independent decision(s) regarding any tradable products which may be the subject matter of the technical analysis or any of the said indicators, strategies, columns, articles and all other features.
Please also be reminded that if despite the above, any of the said technical analysis (or any of the said indicators, strategies, columns, articles and other features accessible on/through this site) is found to be advisory or a recommendation; and not merely informational in nature, the same is in any event provided with the intention of being for general circulation and availability only. As such it is not intended to and does not form part of any offer or recommendation directed at you specifically, or have any regard to the investment objectives, financial situation or needs of yourself or any other specific person. Before committing to a trade or investment therefore, please seek advice from a financial or other professional adviser regarding the suitability of the product for you and (where available) read the relevant product offer/description documents, including the risk disclosures. If you do not wish to seek such financial advice, please still exercise your mind and consider carefully whether the product is suitable for you because you alone remain responsible for your trading – both gains and losses.
Auto

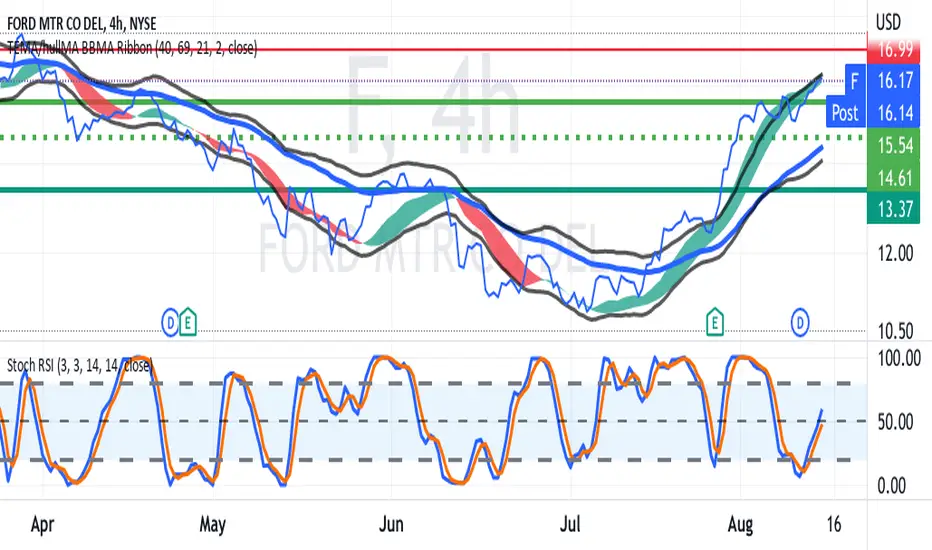
FORD Swing Trade after REVERSAL in JulyNYSE:F
F is trending up while TSLA heads down
US Legislation to support EV purchases with tax credits is helpful
GM's financial troubles are helpful.
Chart shows upgoing BB/EMA channels
and mid-range RSI with recent K/D crossover.
Both suggest a potential swing entry. Depend on unforeseen
changes in the automotive market or the market at large
and a recession versus continued uncertainty, F could
the uptrend for several months also made for the
opportunity to trade call options.
Trade often. Trade well !
Bajaj Auto BreakoutThe stock has broken out and retested, therefore may undergo a reversal rally. Trade is supported by Supports Nearby.
Risk Reward Ratio - 2:1
SL is placed below the support zone & the lower trendline. The target is placed near resistance.

More af-FORD-able?Ford - Short Term - We look to Buy at 12.42 (stop at 11.47)
Broken out of the channel formation to the upside. Price action looks to be forming a bottom. A higher correction is expected. Expect trading to remain mixed and volatile.
Our profit targets will be 14.45 and 16.00
Resistance: 13.28 / 13.96 / 14.46
Support: 12.42 / 11.78 / 10.61
Disclaimer – Saxo Bank Group. Please be reminded – you alone are responsible for your trading – both gains and losses. There is a very high degree of risk involved in trading. The technical analysis, like any and all indicators, strategies, columns, articles and other features accessible on/though this site (including those from Signal Centre) are for informational purposes only and should not be construed as investment advice by you. Such technical analysis are believed to be obtained from sources believed to be reliable, but not warrant their respective completeness or accuracy, or warrant any results from the use of the information. Your use of the technical analysis, as would also your use of any and all mentioned indicators, strategies, columns, articles and all other features, is entirely at your own risk and it is your sole responsibility to evaluate the accuracy, completeness and usefulness (including suitability) of the information. You should assess the risk of any trade with your financial adviser and make your own independent decision(s) regarding any tradable products which may be the subject matter of the technical analysis or any of the said indicators, strategies, columns, articles and all other features.
Please also be reminded that if despite the above, any of the said technical analysis (or any of the said indicators, strategies, columns, articles and other features accessible on/through this site) is found to be advisory or a recommendation; and not merely informational in nature, the same is in any event provided with the intention of being for general circulation and availability only. As such it is not intended to and does not form part of any offer or recommendation directed at you specifically, or have any regard to the investment objectives, financial situation or needs of yourself or any other specific person. Before committing to a trade or investment therefore, please seek advice from a financial or other professional adviser regarding the suitability of the product for you and (where available) read the relevant product offer/description documents, including the risk disclosures. If you do not wish to seek such financial advice, please still exercise your mind and consider carefully whether the product is suitable for you because you alone remain responsible for your trading – both gains and losses.

General Motors - Trouble brews in the auto industryThe prospect of a recession hints at hard times ahead for auto producers, including General Motor Company; over the past six months, this stock lost more than half of its value. Additionally, it continues to constitute new lows, confirming the presence of the downtrend. As a proxy to that, we are bearish on the title and expect worsening economic conditions to impact the auto industry very negatively in the short-term and medium-term future. Therefore, we would like to set the price target for GM to 30 USD and 29 USD.
Illustration 1.01
The picture above shows the weekly chart of General Motors Company. It also shows two simple moving averages: 20-week SMA (blue) and 50-week SMA (red). These two moving averages continue to confirm the medium/long term bearish trend.
Technical analysis - daily time frame
RSI is bearish. MACD and Stochastic are neutral/slightly bearish. DM+ and DM- are bearish. The ADX grows which hints at the increasing momentum. Overall, the daily time frame remains bearish.
Illustration 1.02
The weekly chart of GM stock shows the staggering loss of approximately 54% within the past 189 days.
Technical analysis - weekly time frame
RSI is due to pierce through 30 points, which will further bolster the bearish case for GM. Stochastic, MACD, DM+, DM- are all bearish. Overall, the weekly time frame remains bearish.
Please feel free to express your ideas and thoughts in the comment section.
DISCLAIMER: This analysis is not intended to encourage any buying or selling of any particular securities. Furthermore, it should not be a basis for taking any trade action by an individual investor. Therefore, your own due diligence is highly advised before entering a trade.

Trading Idea - #AUTO1My trading idea for Auto1 Group - Buy/LONG
Target: EUR 9.00 (+28% profit)
The number of vehicles sold at Auto1 has increased, even if the forecast was slightly missed.
Gross profit per vehicle (GPU) in the private customer segment is close to the target of €1000, which is surprisingly strong. The overall valuation of the share is positive after the latest reports.
The latest news indicates a stronger focus towards profitability rather than growth. On the chart, a formation of a bottom can be observed. A good entry point for optimistic investors.

Auto finance price analysis Auto finance price analysis
price is at break out or break down point with a week it must break out or break down watch the chart for the possible outcomes.
not a financial advice.
A

AUTOFARM to $30,000+ IN NEXT BULLMARKETI will explain what Autofarm is, and why I believe this token will go to $30,000 or higher in price.
Autofarm (AUTO) is one of the most under-rated tokens in crypto. I believe that tokens that serve a purpose will be around in the future, while garbage tokens that have no utility will die out in this bear market - just like previous bear markets.
AutoFarm is a yield farming aggregator running on both Binance Smart Chain (BSC) and many other smart chain protocols. It has a circulating supply of 34963 tokens, and a max supply of 80,683. This means there will never be more than 80,683 tokens in existence.
You know what other token was yield aggregator token with a similar circulation supply? YFI (Yearn Finance)! And that almost hit a price of $100,000 per token in the last bull market.
However, Autofarm is better and different that Yearn Finance! What makes Autofarm better is a couple of things:
- It is already the absolute best TOP Yield Aggregator on the following chains:
GNO, HECO, OASIS, OKEXCHAIN, BOBA, VELAS
- It supports other chains as well, including:
MATIC, CRONOS, BSC, AVAX, FTM, AURORA, MOVR, CELO, ONE.
- It is a deflationary token. Meaning the supply of Autofarm decreases over time! More and more tokens are burned often. With supply going lower, there will eventually be more demand. Currently, 2436 Auto tokens have been burned forever.
- The market cap of Autofarm is only $10,000,000! That's basically nothing
- YFI is not a deflationary token, doesn't support as many chains, and the dev also left the project.
Defi is the future, and we all know that such protocols are in demand and will continue to be in demand. This token has already been listed on major exchanges like Binance, CoinEx and Cryptocom - making it very easy for anyone to buy
Once the bull market is back, we expect the entire crypto market cap to get to atleast 6 trillion dollars in the next big bull run. Defi and Yield Aggregator's end up doing great in bull markets.
By the time we get to the next bull market (2025), more Autofarm tokens will be burned from the supply, vault fees are used to perform market buy-backs of AUTO and burnt forever.
In 18 months, 2436 tokens were burned. So using that figure, we estimate that in 30 months (Early 2025), about 5000 more tokens will be burned
We estimate that roughly about 30,000 of these tokens will be in circulation come 2025.
This means that the price of each token will increase in value.
We have made calculations as to how high this token can go using the market cap. Remember, the figures below only show a supply of 30,000 by 2025:
Market cap of 10m, price per token = $333
Market cap of 100m, price per token = $3,333
Market cap of 1b, price per token = $33,333
Market cap of 10b, price per token = $333,333
The all time high for Auto was almost $14,000 per token. And this was also back when there was more supply in circulation. In time, more and more of these tokens will continue being burned. This means that in 1 decade, we could see this reach a much higher price.
Autofarm has been audited by 3 different auditors, including Certik. And also has a github page. To me, having multiple audits + a github page is always a good thing when it comes to evaluating tokens
I mentioned earlier that my target for this is $30,000 in 2025. This would require a market cap just shy of 1 billion dollars at a supply of 30,000. Yearn Finance easily surpassed 1 billion market cap, and almost reached a 3 billion market cap.
I believe this is a strong project and it is a steal at the current price. I also believe we will see the price drop as we go deeper in the bear market, which should make this a nice coin to dollar cost average. I believe there is a good chance that AUTO gets below $100 in the upcoming months, and a very low chance it gets to $50. Should also likely get a couple bounces in small bull phases from now till halving, possibly to $600.
BINANCE:AUTOUSDT BINANCE:AUTOUSD BINANCE:AUTOBUSD COINEX:AUTOUSDT GATEIO:AUTOUSDT
ALong

AUTO HUGE VOLUMEHuge volume, bullish divergence on Relative Strengh Index, Squeeze and Directional Movement Index going upwards. Moon time...
ALong

Minda Corp BreakoutThe stock has broken out and retested, therefore may undergo a reversal rally. Trade is supported by Supports Nearby.
Risk Reward Ratio - 2:1
SL is placed below the support zone & the lower trendline. The target is placed near resistance.

AutoFarm AUTOUSDT - Best buying opportunity! + Wedge + Rectangle- We have a huge falling wedge on the daily chart, which can lead to a massive breakout!
- Also we can see a bullish rectangle pattern currently forming on the chart.
- You can buy breakout above the rectangle + wedge trendline (above 550 USDT).
- Due to my Elliott Wave count, we have a completed Impulse wave (1-2-3-4-5).
ALong

Be ready for BBBIIIIIGGGGGGGG TTTARRGETBe ready for big target in Maruti Eliot wave analysis is done. If we consider the 2nd wave is completed then be ready for 3rd wave which is the longest in wave analysis. Be ready for big target in Maruti Eliot wave analysis is done. If we consider the 2nd wave is completed then be ready for 3rd wave which is the longest in wave analysis. Be ready for big target in Maruti Eliot wave analysis is done. If we consider the 2nd wave is completed then be ready for 3rd wave which is the longest in wave analysis. Be ready for big target in Maruti Eliot wave analysis is done. If we consider the 2nd wave is completed then be ready for 3rd wave which is the longest in wave analysis. Be ready for big target in Maruti Eliot wave analysis is done. If we consider the 2nd wave is completed then be ready for 3rd wave which is the longest in wave analysis. Be ready for big target in Maruti Eliot wave analysis is done. If we consider the 2nd wave is completed then be ready for 3rd wave which is the longest in wave analysis.

TSLA SHORT to $678 - Around March 23rd?Tsla trends are looking like a drop is coming in the next few weeks. With the news and the bounce back from the news, I wouldn't be surprised to see more downside in the future.
The good news, is RSI on the D and 4h charts are on the high side, the W and M are on the low side, so we may see some major support take over and lead the price up and over $1000 again before we see anther decent drop.
If it does bounce off $678, maybe $673 on the low side, and starts to confirm $700, we might see that move to the upside.
I'm thinking short on Monday or Tuesday of next week, and see how low it can go, I'd look to enter around that $674-$679 price, and ride the wave up to $707 or so, and see if we hold $700, which could allow for a push up to $902.

Auto Industry Stock. Ford, VW, BMW, Toyota, Honda, and TESLA?In this video, I do a quick breakdown of a few major automotive stocks. I wanted to mention their Earnings per share (eps), P/E Ratio, and dividend percentage. Ford is at a longer-term PE ratio low right now. Watch the video for more details. I get into Toyota, Ford, Honda, Tesla, BMW, and VW (Volkswagen).

#BAJAJ AUTO
#BAJAJ AUTO trading 3400 formed bullish patern,
today trading lower level from our retracement level,
we can buy around 3370-3390 and tgt for 3450,
posistional tgt 34528 and
follow SL 3327 closing basis.

Bajaj Auto is bearishNSE:BAJAJ_AUTO Bajaj Auto price formed a triangle and it is time to stay bearish for short term

Auto vs Tether Volume Breakout (215%+ Potential Profits)Auto vs Tether Volume Breakout (215%+ Potential Profits)
AUTOUSDT managed to come out its low and challenge EMA50 yesterday on strong volume.
This is an early move, meaning that it needs confirmation but the high volume and bullish indicators are good signals.
We can easily see AUTOUSDT growing in the days and weeks to come.
Conditions for change
The blue square is support. Below this level the above analysis is invalidated.
Good Friday.
Namaste.
ALong

Swing trading opportunities ahead of the BudgetThe markets witnessed a correction ahead of the budget and RIL's Q3 earnings release. Here are some stocks and sectors that are there on our radar. Many of these opportunities in our watchlist depend on how the market action progresses over the coming week. What's your watchlist looking like? The complete list:
Monthly chart, sectors:
Auto.
Bank Nifty
Media
PSE
PSU Bank
Weekly chart, sectors:
Nifty
Auto
FMCG
Infra
IT.
Media
Weekly chart, stocks:
Bajaj Auto.
Britannia
HDFC Bank
Hero Motors
Infosys.
Maruti
Godrej CP.
IRCTC
Nazara
Nucleus
Sharda Crop
Compiled with @AVENUESOFINVESTMENT

$F finally making it's run.Hello Traders,
I notice the potential gap-up back at around Nov 20th, and it looks like the volume finally started coming in. I know it's not a flashy name, but if Ford can break above 21.45ish, we could see a significant additional run. About 3 more points.
Good luck.
Cheers,
Mike

🆓Auto (AUTO) Jan-1 #AUTO $AUTO
.
📈RED PLAN
♻️Condition : If 1-Day closes ABOVE 600$ zone
🔴Buy : 600
🔴Sell : 750 - 900 - 1050 - 1200
📈BLUE PLAN
♻️Condition : If 1-Day closes BELOW 600$ zone
🔵Sell : 600
🔵Buy : 500
❓Details
🚫Stoploss for Long : 10%
🚫Stoploss for Short : 5%
📈Red Arrow : Main Direction as RED PLAN
📉Blue Arrow : Back-Up Direction as BLUE PLAN
🟩Green zone : Support zone as BUY section
🟥Red zone : Resistance zone as SELL section
ALong

General MotorsLooks like a double top was confirmed here. I would love to see a W pattern form now for a better price. With the fear of the new COVID variant, potential rate hikes next year, and high CPI reports, some investors may be dropping this stock at the moment which is understandable to some degree. I can see how investors may fear that there may be less car sales next year due to mainly not as much driving if the variant gets worse as well as the interest hike having an affect on vehicle financing. However, this company has proven its ability to weather the storm when COVID introduced itself to our soil. This is still America's car as well as Ford respectfully. Since 2018, assets has outshined liabilities, total equity has been increasing steadily, cash from operating activities have been stable, they have been taking on some new debt but not as much as they have between 2017 -2018, and although they are cashflow negative, it has been increasing since 2015 (-11.27B down to -3.86B). They have also been doing a decent amount of work in the investment area. They've recently announced plans for VAC (Germany materials company) to build a plant in the U.S. that will manufacture permanent magnets for the electric motors used in the GMC HUMMER EV, Cadillac LYRIQ, Chevrolet Silverado EV and more than a dozen other models using GM’s Ultium Platform. They've partnered with MP Materials the formation of a strategic collaboration to develop a fully integrated U.S. supply chain for rare earth magnets. They've announced plans to invest more than $51 million to install state-of-the-art equipment at its Bedford, Indiana aluminum die casting foundry to support the manufacture of drive unit castings for the upcoming Chevrolet Silverado EV and other current casting applications. They've also announced plans to form with a joint venture with POSCO chemicals through which the parties will construct a factory in North America to process critical battery materials for GM's Ultium electric vehicle platform. They've done all of this in December. Let's see what happens! Nothing like a Chevy and an slice of Apple Pie!
Not Advice!
"It's not about being right more than it is about being smarter than your last trade!"
Akimüle oluyorDip bulan indikatörüm al vermiş ayrıca marketcap ı düşük olduğu için potansiyeli olan bir coin ama almak için en iyi bölgenin yeşil alan olduğunu düşünüyorum YTD
ALong

🆓Auto (AUTO) Dec-6 #AUTO $AUTO
.
📈RED PLAN
♻️Condition : If 1-Day closes ABOVE 750$ zone
🔴Buy : 750
🔴Sell : 900 - 1050 - 1200 - 1500
📈BLUE PLAN
♻️Condition : If 1-Day closes BELOW 750$ zone
🔵Sell : 750
🔵Buy : 650
❓Details
🚫Stoploss for Long : 10%
🚫Stoploss for Short : 5%
📈Red Arrow : Main Direction as RED PLAN
📉Blue Arrow : Back-Up Direction as BLUE PLAN
🟩Green zone : Support zone as BUY section
🟥Red zone : Resistance zone as SELL section
ALong
