SMH (Chips)I think over the next 2 months the chip sector under performs minimum and most likely has a 10+% correction
Monthly chart..
Rsi is 80+ usually when this happens on the monthly time frame chips under perform for the next 12-18months.
Add to the RSI is factor is the tag of its 17yr trendline resistance
Switching up to the weekly time frame and you can see that last week we finish with a shooting star reversal candle here outside the bollingerband.
I highlighted the last 3 times this happened to show what comes next
Zooming into the daily and things get even nastier starting with the reversal candle from Jan 29th.
Next there is a rising wedge
And lastly the RSI divergence is flashing red
So what I think comes next is a sell down to 370 price action or 50sma.
Then a small dead cat bounce before going for 336 gap close
I don't want to clutter this with too much information but I think Certain chip stocks will take the brunt of this selling based on their monthly position
1. NASDAQ:MU micron
2. NYSE:TSM
3. NASDAQ:AMD
4. NASDAQ:AVGO
These 4 chip stocks I think will sell the most percentage wise and likely underperform this year .
Based on 10+ years of price action History says to sell up here and don't buy back until the monthly 50sma is tested.
AVGO

Broadcom: New Target Zone!The recent sell-off in Broadcom prompted us to refine the ongoing magenta wave (2) with a more detailed substructure and mark a new green Target Zone between $312.17 and $290.60. We expect the low of the subordinate turquoise wave B in this price range, after which the subsequent wave C should complete the aforementioned wave (2) at higher levels—yet still below the resistance at $424.10. The green zone is suitable for long entries to take advantage of the increases in wave C. A stop 1% below the lower edge of the zone can provide protection against our alternative scenario: We see a 33% chance that AVGO has already completed the magenta wave alt.(2) and therefore may fall through our green zone. Even in the primary scenario, we anticipate declines below $290.60, but only after the regular wave (2) has formed a new peak.

On the NecklineI thought AVGO already broke through the neckline this morning, but now it's looking like we are right on it, depending on how you draw it. I think we're on it though.
AVGO has been extraordinarily weak, as far as Mag7 go.
META, MSFT, AAPL, also very weak.
I'm not buying puts on this currently, but a clear break of that neckline is compelling. Downside exposure is at least 10-15%.

AVGO - Heading for a discountAVGO - the sector is cooling down a bit. Probably we'll see a big chunk of profit taking in 2026.
If we see a pop here , we can get a better short entry zone around 376-400 zone.
If we dont see a pop, if it continues slide down, we've to chase it.
- Big volume gap below
- Pullback to 200DMA
- Pull back to previous high / can act as support
Target 1- 300
Target 3 - 250
Stop loss - 410 (trail it)

Direxion Semiconductor 3x Bull | SOXL | Long at $30.00So many semiconductor companies... which one to choose? Enter AMEX:SOXL - not for the faint of heart. Losses and gains triple compared to most semiconductor ETFs, so stay away if high-risk plays aren't your thing. The top three holdings are NASDAQ:AMD , NASDAQ:AVGO , and NASDAQ:NVDA - two of which are at all-time highs...
I wouldn't be shocked if AMEX:SOXL enters the low $20's to test the base of my historical simple moving average area, but I don't think we are done hearing about AI and the semi demand. There are large gaps to fill above and below the current price and we are at the 50/50 stage (i.e. historical simple moving average zone) for a price move up or down.
My bet is up, especially with the new presidential administration. If politicians start dumping semis, I'm out. Thus, at $30.00 AMEX:SOXL is in a personal buy zone.
Target #1 = $35
Target #2 = $40
Target #3 = $50
Target #4 = $60

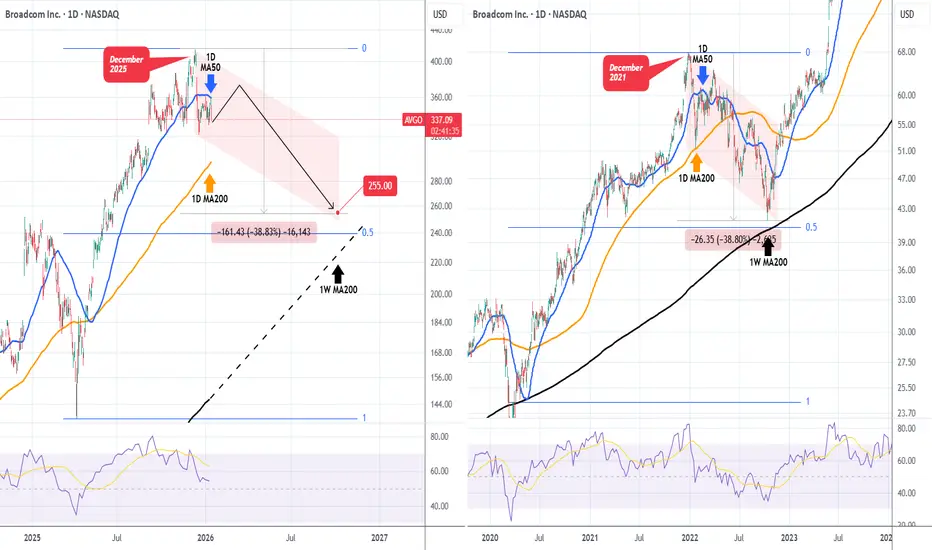
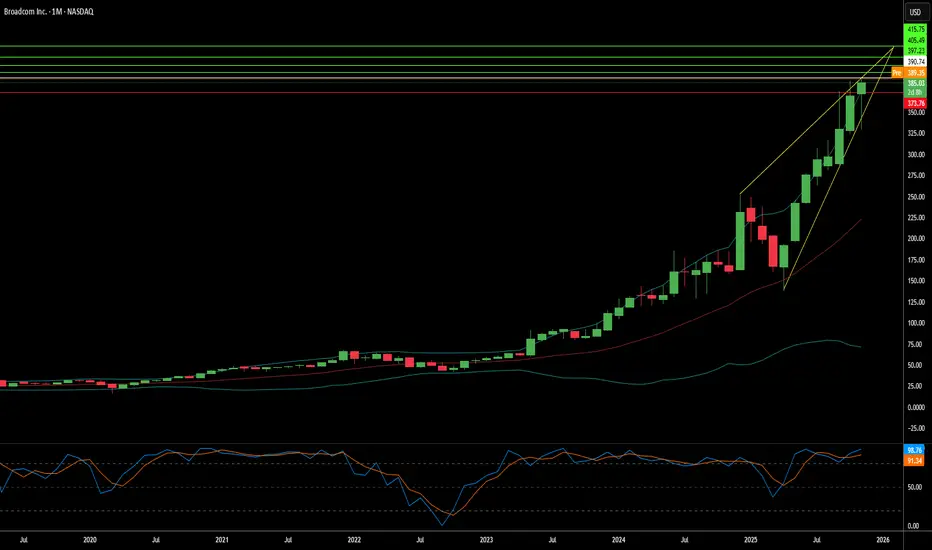
BROADCOM under its 1D MA50, targeting $255.Broadcom Inc. (AVGO) is already 1 month into its new Bear Cycle as following its December 10 2025 All Time High (ATH), it has dropped below its 1D MA50 (blue trend-line), being unable to break above it again yesterday on its 2nd test in the last 2 weeks.
This is almost identical to the 2022 Bear Cycle, which also started after the December 2021 High. Even their 1W RSI sequences are not all that different. Technically, the price is now aiming at the 1D MA200 (orange trend-line) but the long-term target is the 1W MA200 (black trend-line), which is where the 2022 Cycle bottomed after a -38.80% total decline, almost reaching the 0.5 Fibonacci retracement level from the 1W MA200.
As a result, it is highly likely to see a symmetrical Bear Cycle, targeting $255 by late 2026.
---
** Please LIKE 👍, FOLLOW ✅, SHARE 🙌 and COMMENT ✍ if you enjoy this idea! Also share your ideas and charts in the comments section below! This is best way to keep it relevant, support us, keep the content here free and allow the idea to reach as many people as possible. **
---
💸💸💸💸💸💸
👇 👇 👇 👇 👇 👇
$AVGO Wants More What it dew Yall! Happy New Year! Its Up and Stuck lol. I'm so excited for Life, this will be a wonderful trading year! Let's Kick off the 1st TA for NASDAQ:AVGO on the 1 HR time frame.
(8/14/21 EMA's are used)
-Price has rejected at the 0 level once; however, the anchor is the 0 so it’s kinda like a rejection twice.
-The EMA were stacked for a down bias however they are now flipping indicator buying pressure picking up.
-If price can close above the 0.618 zone before the EOD that’ll look better: buyers gaining control
S/L is at the 0. I look for candles to close below this area not just wick through them. I study these types of entries so I'm always taking a small risk and entering around the .0382 zone (for calls). The R:R is a chef kiss.
This is not financial advice, educational purposes only.
Happy Trading Alerts Set!

AVGO next moveWhite fib from 2024 hit all targets,Yellow fib for 2025.
Green box is an accumulation once exceeds 2024 last target 335 i see a distribution under 414 which is 3rd target for 2025 and form a disjoint channel
Also i see a strong selling area 360-370 last friday was a rejection.
MACD went to the negative zone could lead to area 309-240.
If selling area keep controlled by bears then can't hold for longer.
it's healthy for next target area 518-583

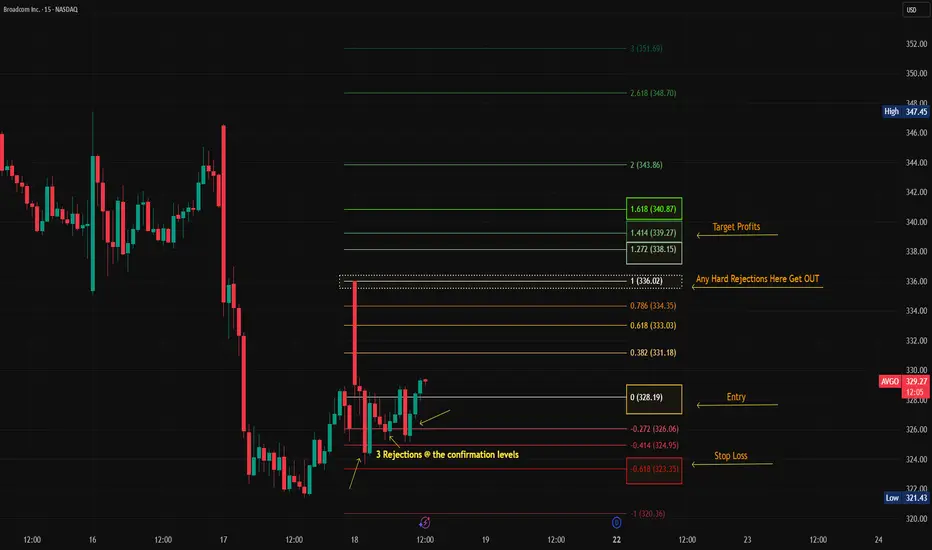
$AVGO there it Go, Go, GONASDAQ:AVGO Pull back candle stopped out 3 times @ the confirmation levels: -0.272 &-0.414. Which leads me to believe that it wants to test the upper Fibs. If price rejects hard at the Level 1 then ill reconsider the target profit levels.
Happy Trading, Alerts Set!
Broadcom - The short of the century!⏰Broadcom ( NASDAQ:AVGO ) is reversing right now:
🔎Analysis summary:
Broadcom is just insane. After another retest of the very steep support trendline, we just witnessed a crazy rally of +200%. But at this exact moment, Broadcom is totally overextended and retesting major resistance. A healthy correction is starting today.
📝Levels to watch:
$400 and $300
SwingTraderPhil
SwingTrading.Simplified. | Investing.Simplified. | #LONGTERMVISION

$AVGO [Broadcom Inc.]The compounder NASDAQ:AVGO has declined almsot 20% from ATHs. The stock is trading around $325 as we speak, currently testing the 100 SMA, if it breaks below, a gap could be filled around $310:$300.
Keys:
A disparity between the trailing P/E of 71 and the anticipated forward 24x suggests that the company is expecting a massive earnings boom.
PEG of 0.69 is suggesting an undervalued stock price to its growth.
A fortress balance sheet with a profit margin of 36.20% & gross margin of 64,71% & EPS next y of 38,21%

Is AVGO’s drop over yet?Oracle AVGO — Price Analysis
Chart A (Daily):
Price had been oscillating within an 80-day channel, and after failing to reach the channel’s upper boundary due to repeated divergences, it finally broke below the bullish channel with two strong, high-volume daily candles—the highest selling volume seen on this chart in the past 68 days—and closed below the channel.
Chart B (4H):
This structure is also visible on the 4-hour chart as a wedge pattern, where price initially experienced a fake breakout to the upside and has now broken the lower boundary of the wedge.
Outlook:
This corrective move could potentially continue at least to the gap zone highlighted on the chart, which is a significant gap, and possibly extend further to the support zone at the lower end of the extended channel. Once price reaches these areas, we should watch for potential reactions.
Note: This analysis will be updated as the situation develops.
Follow me on TradingView for more analyses and live stock trades.
NASDAQ:AVGO

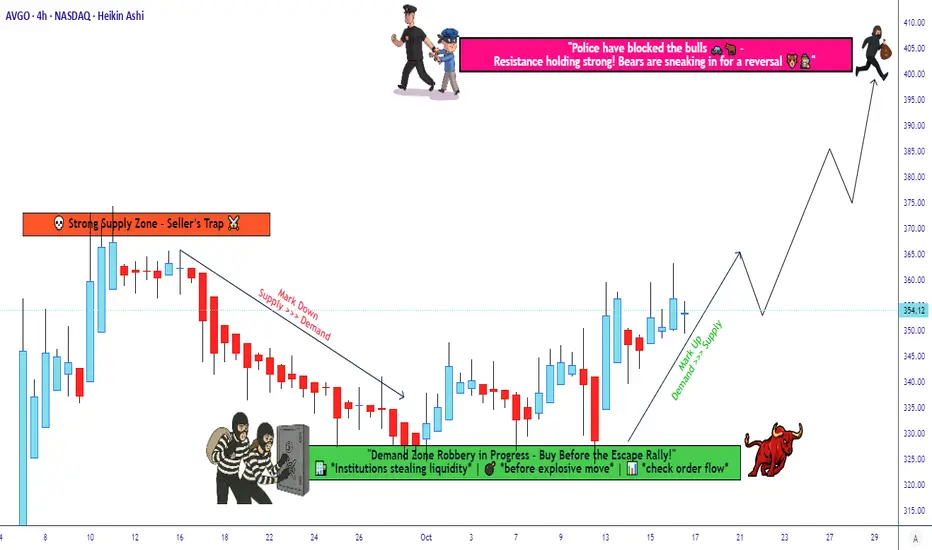
Broadcom Technical Setup - Systematic Entry Approach🎯 AVGO: The Great Heist Setup | Layered Entry Strategy 💰
📊 Asset Overview
Broadcom Inc. (AVGO) - The semiconductor kingpin that's been printing money like a Vegas casino! 🎰
🎭 The Heist Plan: BULLISH Setup
Strategy Style: The "Thief Method" - Layered Limit Orders (Ocean's Eleven style but legal! 😎)
🚪 ENTRY ZONE: The Multi-Layer Approach
This ain't your grandma's single entry point! We're going full stealth mode with multiple limit buy orders spread across the zone like a well-planned heist:
Suggested Entry Layers:
💵 Layer 1: $330
💵 Layer 2: $340
💵 Layer 3: $345
💵 Layer 4: $350
💵 Layer 5: $355
OR feel free to enter at ANY current price level if you're feeling bold! 🎲
Pro Tip: You can add more layers based on your capital and risk appetite. More layers = Better average price = Smoother ride! 🎢
🛑 STOP LOSS: The Emergency Exit
Thief's Escape Hatch: $320
⚠️ RISK DISCLAIMER: Dear Thief OG's (Ladies & Gentlemen of Fortune), this is MY stop loss level for MY strategy. You're the boss of your own money! Set your SL based on YOUR risk tolerance. Make money, take money - at your own risk! 🎲
🎯 TARGET: The Vault Unlocks Here!
POLICE BARRICADE ZONE (Strong Resistance Alert! 🚨): $400
This level is where we expect:
💪 Strong resistance
📈 Overbought conditions brewing
Bull traps potentially forming
Strategy: Escape with your bags of cash before the sirens go off! 🚔💨
⚠️ PROFIT DISCLAIMER: Again, Thief OG's - this is MY target, not financial advice! Take profits whenever YOUR plan says so. Your money, your rules, your responsibility! 💯
🔗 Related Pairs to Watch (Correlation Play)
Keep your eyes on these accomplices in the semiconductor/tech heist:
NASDAQ:NVDA (NVIDIA) - The GPU mastermind, moves often correlate with AVGO
NASDAQ:AMD (Advanced Micro Devices) - Another chip champ in the gang
NYSE:TSM (Taiwan Semiconductor) - The supplier kingpin
NASDAQ:QCOM (Qualcomm) - Wireless chip crew member
NASDAQ:SMH (VanEck Semiconductor ETF) - The whole gang in one basket
Key Correlation: When semiconductor sector heats up, AVGO typically rides the wave. Watch NASDAQ:SMH for sector-wide momentum! 📡
🎪 Why This Setup Works (Technical Edge)
✅ Layered entries reduce timing risk
✅ Multiple support zones below current price
✅ Clear risk/reward structure
✅ Room to run toward resistance at $400
✅ Semiconductor sector showing strength
🎬 Final Words from Your Friendly Neighborhood Thief
This is the "Thief Strategy" - a layered, calculated approach to catching moves in AVGO. It's all about spreading your risk, averaging your entry, and having a clear exit plan whether things go right (🎯 $400) or wrong (🛑 $320).
Remember: The best thieves always have an escape plan! 🏃💨
Trade smart, not hard! And always remember: Past performance doesn't guarantee future results, but a solid plan beats panic every time! 🧠💪
✨ If you find value in my analysis, a 👍 and 🚀 boost is much appreciated — it helps me share more setups with the community!
#AVGO #Broadcom #SwingTrading #DayTrading #TradingStrategy #StockMarket #TechnicalAnalysis #LayeredEntry #ThiefStrategy #Semiconductors #TechStocks #RiskManagement #TradingIdeas #StockTrading #BullishSetup #TradingView #MarketAnalysis #PriceAction #SupportAndResistance
AVGO: mid-term trend structure If price is to hold above 209-198 area of support, next resistance zones are: 287-303 and 320-330-360.
Macro trend structure also assumes higher targets for the uptrend since 2022 bottom (Monthly):
Thank you for your attention!

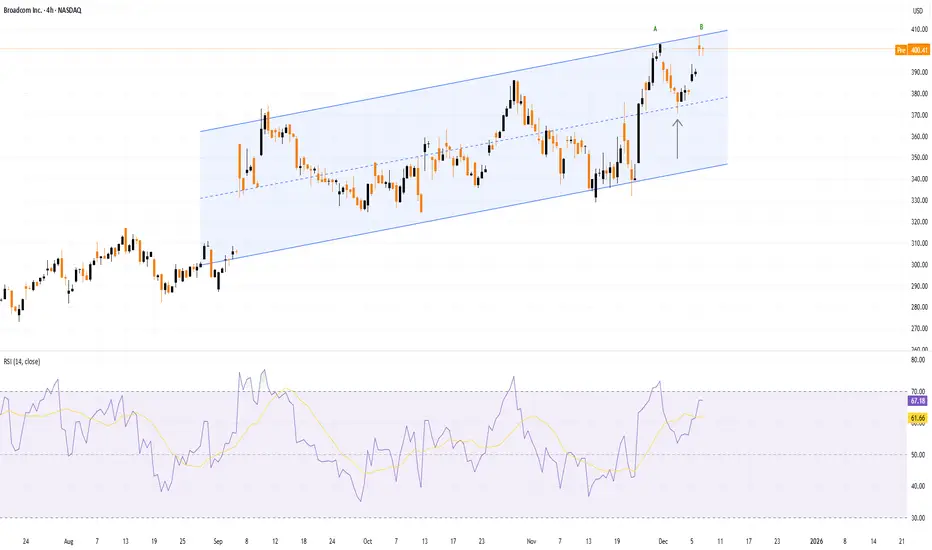
Broadcom (AVGO) Shares Hit a Record Ahead of EarningsBroadcom (AVGO) Shares Hit a Record Ahead of Earnings
Broadcom (AVGO) shares reached an all-time high ahead of the company’s quarterly results, due this Thursday, supported by strong fundamental drivers:
→ Partnership with Microsoft: Media reports suggest Broadcom is in talks with Microsoft to develop custom AI chips.
→ Analyst optimism: UBS called Broadcom a “top investment” in the AI sector, citing explosive demand for hardware, and raised its price target to $472.
→ Shift in strategy: Market participants believe the company is refocusing on its own chips to win AI hardware market share from Nvidia.
We highlighted additional bullish drivers in our 14 October analysis.
Technical Analysis of AVGO Shares
Following a bullish gap on 4 September, price movements have formed an upward channel (shown in blue).
From a bullish perspective:
→ the channel median is acting as support (indicated by the arrow);
→ the wide bullish candle on 24 November signals strong buying pressure;
→ the share is outperforming equity indices.
From a bearish perspective:
→ the AVGO share price is currently near the upper boundary of the channel;
→ the psychological $400 level is showing signs of resistance;
→ at peak B the price rose only slightly above the previous peak A before pulling back – a sign of a potential bull trap.
It is possible that in the coming days, AVGO may show signs of consolidation near the upper channel boundary, while the earnings release could trigger a volatility spike and a large gap, given the market’s elevated expectations.
This article represents the opinion of the Companies operating under the FXOpen brand only. It is not to be construed as an offer, solicitation, or recommendation with respect to products and services provided by the Companies operating under the FXOpen brand, nor is it to be considered financial advice.
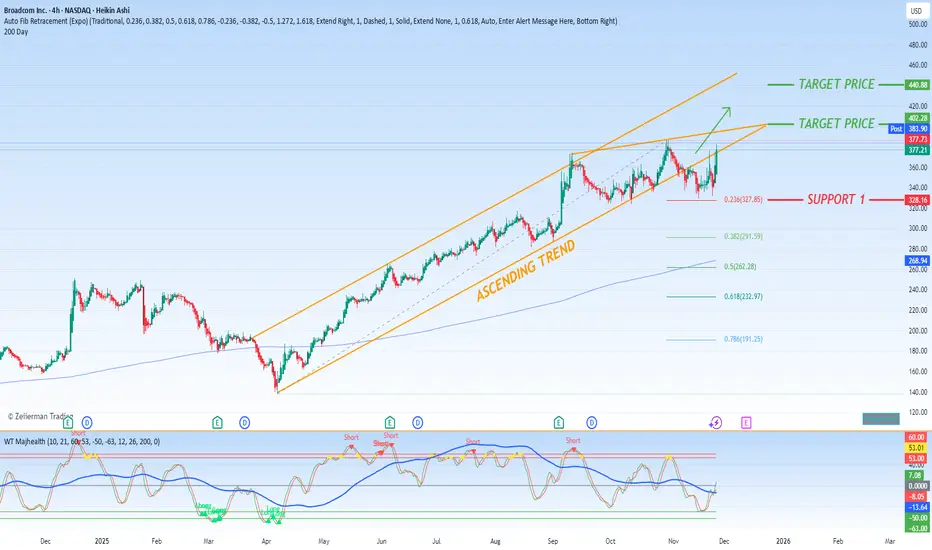
Broadcom Rides the AI Wave, Fueling Nasdaq's AscentSemiconductor titan Broadcom (NASDAQ: AVGO) emerged as a key catalyst driving the Nasdaq Composite significantly higher during a robust trading session for the technology sector. This bullish momentum was fueled by a confluence of positive developments within the artificial intelligence ecosystem, directly benefiting Broadcom's strategic positioning.
The optimism was ignited over the weekend by affirming analyst commentary regarding Alphabet (Google)'s advancements in AI. As a critical supplier of custom networking and AI accelerator chips for Google's data centers, Broadcom stands as a direct beneficiary of the search giant's accelerated investments. This sentiment was further amplified by e-commerce and cloud behemoth Amazon (NASDAQ: AMZN), which unveiled ambitious new plans to commit tens of billions of dollars toward AI infrastructure. Given Broadcom's established role as a supplier for custom silicon solutions, this announcement signals a powerful, forward-looking demand driver for its semiconductor business.
While a segment of the market maintains a prudent long-term perspective, cautiously watching for any potential saturation or deceleration in the torrent of AI capital expenditure, the immediate reaction to concrete, large-scale investment announcements remains overwhelmingly positive. These deals serve as tangible validation of Broadcom's growth trajectory and its entrenched role in the foundational infrastructure of the AI revolution.
Technical Perspective and Price Outlook
From a chart analysis standpoint, Broadcom's technical setup presents a compelling case for continued strength. The stock is demonstrating remarkable resilience, consolidating above a key Fibonacci support level. Specifically, the 0.236 Fibonacci retracement level at approximately $327.85 has acted as a reliable springboard, confirming a strong base of buyer interest at that price point.
This robust foundation, underpinned by powerful fundamental tailwinds, provides a confident outlook for the stock's upward trajectory. Our analysis projects a strong and positive target zone between $400 and $440. Given the potent combination of sector-wide momentum and the company's firm-specific catalysts, we anticipate a high probability that AVGO will challenge and test this target range in the foreseeable future. The confluence of strong fundamentals and a bullish technical structure makes Broadcom a standout contender for continued outperformance.
AVGO — [2D] WEEK 49 TREND REPORT | 12/04/2025AVGO — WEEK 49 TREND REPORT | 12/04/2025
Ticker: NASDAQ:AVGO
Timeframe: 2D
This is a reactive structural classification of AVGO based on the weekly chart as of this timestamp. Price conditions are evaluated as they stand — nothing here is predictive or forward-assumptive.
⸻
1) Current Trend Condition [ Numbers to Watch ]
Current Price @ 381
• Trend Duration : +228 Days ( Bullish )
• Weekly Trend Reversal Level ( Bearish ) @ 363.53
• Weekly Trend Reversal Level ( Bearish Confirmation ) @ 322
• Pullback Support @ 320
• Correction Support @ 255
⸻
2) Structure Health
• Retracement Phase:
Uptrend (operating above 78.6%)
• Position Status:
Healthy (price above both structural layers)
⸻
3) Temperature :
Warming Phase
⸻
4) Momentum :
Bullish
⸻
Author’s Note
UPWARD STRUCTURAL ALIGNMENT
This mark reflects a point where market behavior supported the continuation of the existing upward direction. It does not imply forecasting or targets — it simply notes where strength became observable within the current trend. Its meaning holds only while price continues to respect the broader structural levels that define the trend.
⸻
Methodology Overview
This classification framework evaluates directional conditions using internal trend-interpretation logic that references price behavior relative to its structural layers. These relationships are used to identify when price movement aligns with the framework’s criteria for directional phases, transition points, or regime shifts. Visual elements or structural labels reflect these internal interpretations, rather than explicit trading signals or preset indicator crossovers. This framework is observational only and does not imply future outcomes.

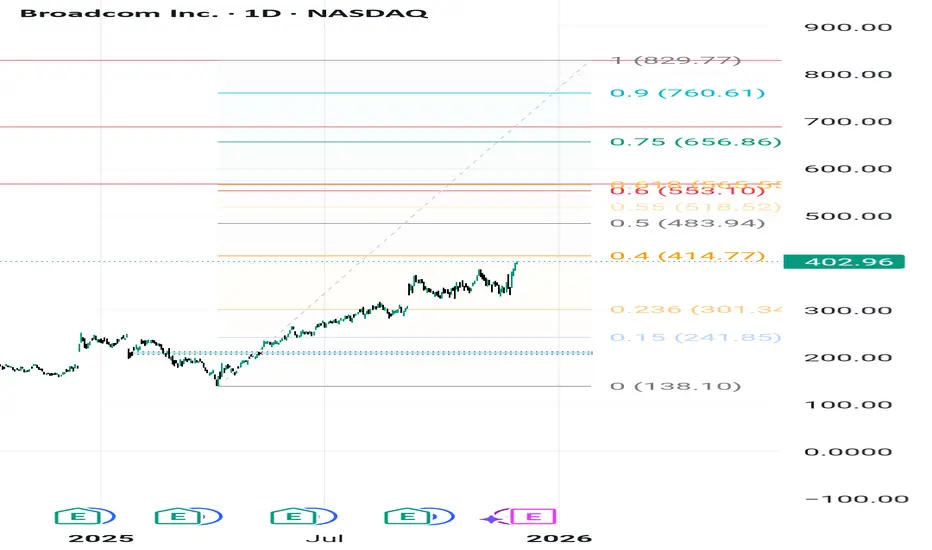
AVGO: Path to $829.77 – Navigating Critical Fibonacci Zones1. Overall Thesis and Price Structure
Broadcom Inc. (AVGO) exhibits a strong underlying bullish trend, fundamentally driven by demand for its AI chips and the successful integration of VMware. The technical objective targets a final high of $829.77. However, the path requires breaking through significant resistance levels defined by the Fibonacci structure. The current price is \mathbf{\$402.96}, maintaining the bullish momentum.
2. Crucial Resistance and Volatility Points
The analysis identifies two critical intermediate targets. The first and most significant hurdle is at $567.10, which aligns closely with the \mathbf{0.618} Fibonacci Golden Ratio. This zone is expected to trigger major volatility, profit-taking, and consolidation. The price action at $567.10 is the key test for trend continuity. Should the price break this level decisively, the next primary resistance target is $688.63, paving the way for the ultimate goal.
3. Key Support and Trend Invalidation
The long-term structural support, or the "Invalidation Point" for the bullish scenario, is the Key Zone at \mathbf{\$206.00}. As long as AVGO trades above this level, the multi-year uptrend remains valid. In the short term, the stock needs to overcome immediate resistance near $414.77 to gather momentum and continue its push towards the intermediate Fibonacci targets.
GOOGL Stock Forming a BIG Pattern — Key Levels You MUST Watch!In this video, I break down a clear chart pattern forming on GOOGL (Alphabet) stock, using detailed technical analysis.
You’ll see exactly how the pattern developed, what levels matter right now, and where the stock could move next.
🔍 What’s Covered in This Analysis:
GOOGL’s current chart structure
Clear pattern formation (triangle / channel / flag / wedge — based on your chart)
Key support & resistance zones
Breakout / breakdown levels
Trend strength and momentum
Short-term price targets
Medium-term technical outlook
Risk levels & invalidation points
📈 Why This Matters
Alphabet (GOOGL) is showing a highly tradable technical setup, and understanding this chart pattern can help you spot the next big move before it happens.
Perfect for:
Day traders
Swing traders
Long-term technical investors
Anyone following large-cap tech stocks

Is Silicon's Silent Giant Rewriting the Rules of AI?Broadcom has emerged as a critical, yet understated, architect of the artificial intelligence revolution. While consumer-facing AI applications dominate headlines, Broadcom operates in the infrastructure layer, designing custom chips, controlling networking technology, and managing enterprise cloud platforms. The company maintains a 75% market share in custom AI accelerators, partnering exclusively with Google on their Tensor Processing Units (TPUs) and recently securing a major deal with OpenAI. This positioning as the "arms dealer" of AI has propelled Broadcom to a $1.78 trillion valuation, making it one of the world's most valuable semiconductor companies.
The company's strategy rests on three pillars: custom silicon dominance through its XPU platform, private cloud control via the VMware acquisition, and aggressive financial engineering. Broadcom's technical expertise in critical areas like SerDes technology and advanced chip packaging creates formidable barriers to competition. Their Ironwood TPU v7, designed for Google, delivers exceptional performance through innovations in liquid cooling, massive HBM3e memory capacity, and high-speed optical interconnects that allow thousands of chips to function as a unified system. This vertical integration from silicon design to enterprise software creates a diversified revenue model resistant to market volatility.
However, Broadcom faces significant risks. The company's dependence on Taiwan Semiconductor Manufacturing Company (TSMC) for production creates geopolitical vulnerability, particularly given rising tensions in the Taiwan Strait. U.S.-China trade restrictions have compressed certain markets, though sanctions have also consolidated demand among compliant vendors. Additionally, Broadcom carries over $70 billion in debt from the VMware acquisition, requiring aggressive deleveraging despite strong cash flows. The company's controversial shift to subscription-based pricing for VMware, while financially successful, has generated customer friction.
Looking ahead, Broadcom appears well-positioned for the continued AI infrastructure buildout through 2030. The shift toward inference workloads and "agentic" AI systems favors application-specific integrated circuits (ASICs) over general-purpose GPUs Broadcom's core strength. The company's patent portfolio provides both offensive licensing revenue and defensive protection for partners. Under CEO Hock Tan's disciplined leadership, Broadcom has demonstrated ruthless operational efficiency, focusing exclusively on the highest-value enterprise customers while divesting non-core assets. As AI deployment accelerates and enterprises embrace private cloud architectures, Broadcom's unique position spanning custom silicon, networking infrastructure, and virtualization software establishes it as an essential, if largely invisible, enabler of the AI era.
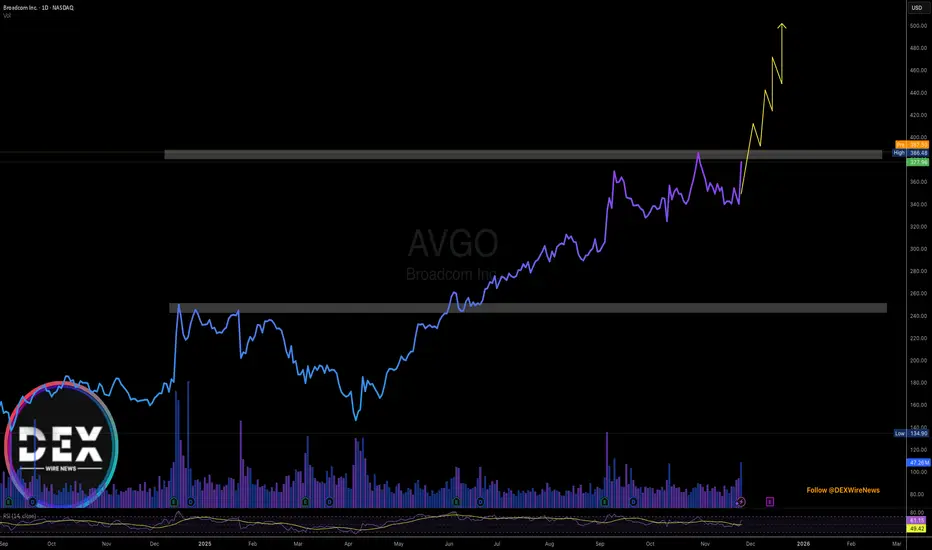
Breaking: Broadcom Inc. (AVGO) Surged 11% Yesterday Eyeing $500 Broadcom Inc. (NASDAQ; NASDAQ:AVGO ) shares saw a noteworthy uptick of 11% in extended market trading further extending the gains to todays premarket session up by 2.34%.
Should the stock break the ceiling of the $388 resistant zone, coupled with the RSI at 61, a bullish move to the $500 resistant is feasible and possibly $700 before the year runs out.
Similarly, failure to pull that stunt from NASDAQ:AVGO might resort to a move to the $250 support point.
With earnings slated for December 11th, 2025, In 2024, Broadcom's revenue was $51.57 billion, an increase of 43.99% compared to the previous year's $35.82 billion. Earnings were $5.90 billion, a decrease of -58.14%.
Analyst Summary
According to 28 analysts, the average rating for AVGO stock is "Strong Buy." The 12-month stock price target is $353.86, which is a decrease of -6.38% from the latest price.
About AVGO
Broadcom Inc. designs, develops, and supplies various semiconductor devices and infrastructure software solutions worldwide. The company operates in two segments, Semiconductor Solutions and Infrastructure Software. It provides Ethernet switching and routing custom silicon solutions, optical and copper physical layer devices, and fiber optic transmitter and receiver components; set-top box system-on-chips (SoCs), data over cable service interface specifications cable modem and networking infrastructure.
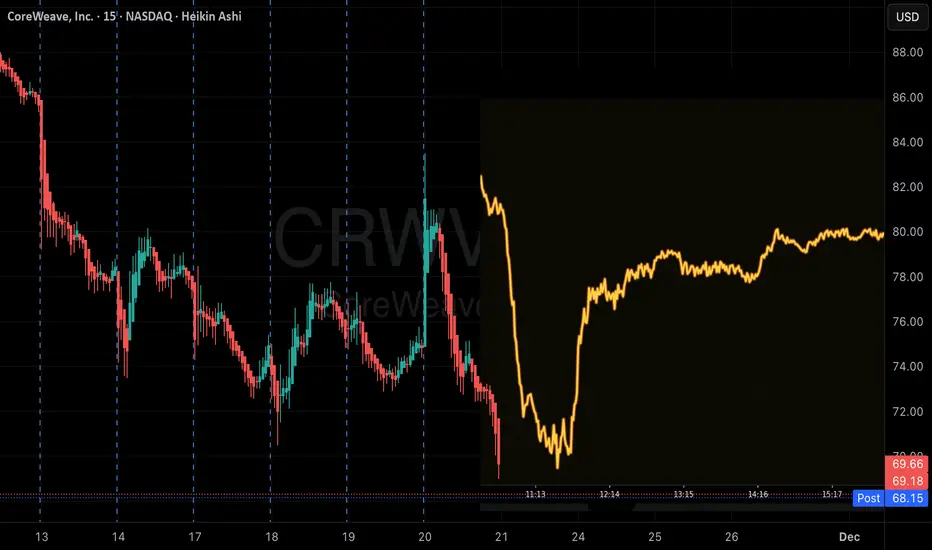
QuantSignals V3 AVGO | High-Probability Bear PlayAVGO QuantSignals Katy 1M Prediction | 2025-11-20
Current Price: $371.19
Final Prediction: $363.96 (-1.95%)
30min Target: $368.47 (-0.73%)
Trend: BEARISH
Confidence: 73%
Volatility: 36.5%
📊 Trade Signal:
Direction: PUT
Entry: $371.19
Target: $365.41
Stop Loss: $376.76
Expected Move: -1.95%
Analysis Summary:
Katy AI predicts a moderate bearish trend over the next month.
Technical indicators and options flow suggest downside potential.
Short-term target ($368.47) may see minor pullback before continued decline.
Trade Setup:
Expiry: 1 Month
Position Size: Moderate, manage risk due to volatility
Risk Level: MODERATE-HIGH
Notes:
Monitor for reversals near $365.41 support.
Stop loss at $376.76 protects against unexpected upward moves.
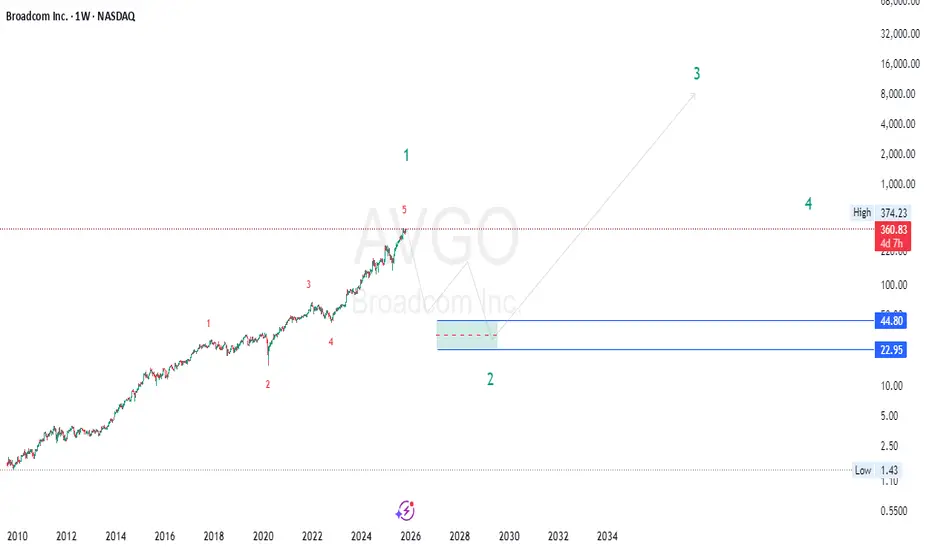
AVGO (Broadcom) Crash Alert | The Biggest Drop Is Just Starting “ AVGO (Broadcom ) is on the brink of a massive correction, with charts pointing toward a potential plunge into the $45–$23 zone — a brutal reset that could shake the entire semiconductor sector before the next bull cycle begins. ⚠️📉”
🔥 Summary:
Broadcom (AVGO) might be entering a massive corrective phase after a historic rally. The charts suggest the bull run is pausing and a bear market retracement is about to unfold — potentially one of the biggest corrections in years. While long-term fundamentals remain strong, smart money could be preparing to buy much lower after this shakeout. ⚠️📉
🌊 Elliott Wave Breakdown
According to wave theory, AVGO has likely completed a full 5-wave impulse — marking the end of Cycle Wave 1 .
Now, the market is preparing for Cycle Wave 2 , a deep and time-consuming correction.
The expected retracement zone lies between $45–$23 , which corresponds with the 0.618–0.786 Fibonacci retracement of the entire 2010–2025 rally.
Wave 2s often create fear and disbelief, shaking out late buyers before the next mega rally (Wave 3).
In other words: this is not the end of the bull , but the start of a much-needed reset .
📉 Price Action & Market Structure
AVGO’s weekly structure shows clear exhaustion at the top — long wicks, slowing momentum, and divergence between price and volume.
The market structure shift (MSS) is forming:
Break of trendline support 🟠
Lower highs forming 🔻
Liquidity still sitting under 2022–2023 consolidation zones
All this signals that distribution is underway. Once liquidity under key swing lows gets tapped, a larger bearish trend can unfold.
🧠 Smart Money Concept (SMC) View
Smart Money is likely offloading at these premium prices.
Expect the following sequence:
💥 Liquidity grab above current highs (final trap)
⬇️ Break of structure confirming the downtrend
📉 Repricing toward discount zone ($45–$23)
🧱 Reaccumulation by institutions for the next macro leg
The bearish reprice phase may last several quarters or even years, but this is where smart money prepares for the next cycle , not retail FOMO.
💰 Fundamentals Meet Reality
Despite Broadcom’s strong fundamentals — AI infrastructure, chip dominance, software expansion — valuations have far outrun earnings .
A macro reset (higher rates, earnings compression, slowing AI hype) could drive a fundamental correction to align price with real growth.
Even great companies need bear markets to reload and revalue before resuming exponential growth.
🔮 The Big Picture
✅ Long-term bull trend is intact — but paused .
⚠️ Short-to-medium term: bear market correction is expected to start soon .
🎯 Key accumulation zone: $45–$23 (deep discount territory).
🚀 Post-correction, the next supercycle (Wave 3) could begin — targeting multi-thousand-dollar levels.
🦅 Summary Insight
“Smart money sells strength, not weakness. They’ll buy when fear peaks.”
AVGO’s parabolic bull wave has likely topped , and a multi-year corrective wave is next.
This is not the end — it’s the reset before a generational buying opportunity.
Brace for turbulence before the skies clear. 🌪️📉➡️🌤️🚀
“ Traders , this could be the setup of the decade. AVGO (Broadcom) is flashing every warning sign of a massive correction — our models point to the $45–$23 zone as the next major demand area. Don’t chase the top when smart money is preparing to buy the bottom. 📉💰
How deep do you think this correction goes? Drop your targets below 👇 and let’s see who catches the real reversal!”
— Team FIBCOS
#AVGO #Broadcom #StockMarket #BearMarket #Correction #WaveTheory #SmartMoney #ElliottWave #TechnicalAnalysis #TradingView #Fibcos #PriceAction #Investing #MarketCrash #StockAlert #Wave2 #MarketUpdate #ChartAnalysis #BearishSetup #TradeSmart