Boeing (BA) Share Price Could Reach 2025 HighsBoeing (BA) Share Price Could Reach 2025 Highs
As the Boeing (BA) stock chart indicates, the price rose by 3.5% yesterday, while the S&P 500 index (US SPX 500 mini on FXOpen) gained only 0.4%. Boeing’s stronger performance reflects optimism driven by news (and market rumours) reported in the media suggesting that:
→ Korean Air has purchased more than 100 aircraft during the newly elected South Korean president’s visit to the White House;
→ Boeing is negotiating the sale of 500 aircraft to China;
→ the Trump administration may acquire stakes in companies linked to the defence sector (Palantir, Boeing, Lockheed Martin).
Technical Analysis of BA Stock Chart
BA’s price fluctuations have formed an upward channel (shown in blue). However, at the end of July, the rally encountered resistance around the $235 level:
→ following a volatility spike at the end of July (triggered by the quarterly earnings release), the price retreated towards the lower boundary of the channel;
→ in mid-August, the price turned downwards again from this level.
At the same time, we can observe a sequence of higher lows (1-2-3), emphasising that the lower boundary of the channel is acting as key support, setting the pace for BA’s growth trajectory in 2025.
It is worth noting that the stock’s oscillation between support (the lower boundary) and resistance around $235 is creating bullish patterns such as an Ascending Triangle and a Cup and Handle.
Should reports of a potential Boeing share purchase by the US government be confirmed, the BA stock price could advance to new annual highs. In such a scenario, several factors could be important:
→ the price may subsequently consolidate around the channel’s median;
→ historically, the $250–260 zone has acted as significant resistance during 2021–2023;
→ the $235 level may switch roles to become support, similar to the way $218 previously did.
This article represents the opinion of the Companies operating under the FXOpen brand only. It is not to be construed as an offer, solicitation, or recommendation with respect to products and services provided by the Companies operating under the FXOpen brand, nor is it to be considered financial advice.
Baanalysis

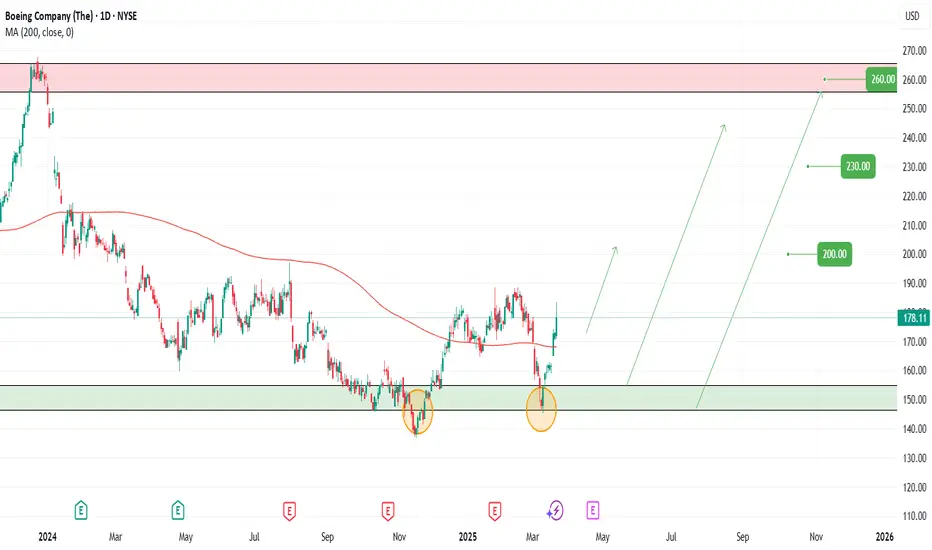
BA (Boeing Co.) – Trade Setup Alert🚀✈️ A major new defense contract is on the horizon — and if confirmed, it could skyrocket BA’s valuation to new heights. This could be the catalyst that propels the stock far beyond its current range.
Boeing is showing renewed strength with a bullish setup developing. With multiple entry points and solid upside targets, this trade offers compelling potential for swing traders and long-term investors alike.
📌 Entry Points:
1️⃣ Market Price
2️⃣ $162
3️⃣ $147
🎯 Profit Targets:
✅ $200
✅ $230
✅ $260
⚠️ Disclaimer: This is not financial advice. All trading involves risk. Please do your own research or consult a licensed financial advisor before making investment decisions.
Boeing: More RoomBoeing recently climbed higher, and we still grant the magenta wave slightly more room on the upside. However, this corrective upward movement should come to an end below the resistance at $197.20 and transition into the sell-off phase of the same-colored wave . This movement, in turn, should complete the overarching turquoise wave 2 while remaining above the support at $137.03. Afterward, the price should surge beyond the resistance at $267.54, allowing the larger magenta wave (1) to conclude. On the other hand, we see a 30% chance that Boeing will form a fresh low below the $137.03 mark during the green wave alt. .

Boeing: Long Opportunities!As expected, Boeing has recently moved down into our green Target Zone between $146.35 and $113.35. Within this price range, we anticipate the low of the green wave . Once this low is established, we expect the stock to resume its upward trajectory, as the subsequent green wave should have significant potential, targeting levels well above the resistance at $267.54. Our Target Zone can thus serve as an entry point for long positions. To manage risk, traders could place a stop-loss 1% below the lower boundary of the Zone.

BA Price headed to monthly resistanceDifficult chart to do the analysis. However, at a high timeframe like monthly, it is a bit easier. It seems there is a big monthly resistance sitting just 15% above the current price. That resistance is a zone 238-243.
There is higher probability that if price moves higher from here, it will stall in that range and probably face a rejection there for a pullback. In case of a pullback, the price will find support at the marked monthly support.

BOEING ANALYSISBoeing is in an interesting position here setting up for a nice break of the downtrend into a long if this all plays out.
We expect the downtrend to break and as soon as a close above the resistance is made we can long until the target!
Always be patient and wait for confirmation, Happy Trading!

BA aka Boeing IdeaG'day Guys
Boeing been in the market for sometime and until now still consistently produce and improve. That the reason this stocks keep consistent.
After sudden drop during the MAX case, but consistency, responsibility and demand keep this stocks build up.
From my perspective this stocks stable stock. Here my analysis on this pair. Expecting another push high before do some correction on their stock. I am expecting this company going to do some
restructuring to ensure their sustainability and competitive.
That the reason this pair is gonna creating a correction on this current stocks performance.
Let's discuss and comment about it.. Cheers
