PNC Financial Services 1Y Chart Review - Limited Room for GrowthToday you can review the technical analysis idea on a 1Y linear scale chart for PNC Financial Services (PNC).
It seems there is some action going on here with PNC with potential for some additional growth. RSI is over 70 and potential for retracement coming up soon.
If you enjoy my ideas, feel free to like it and drop in a comment. I love reading your comments below.
Disclosure: This is just my opinion and not any type of financial advice. I enjoy charting and discussing technical analysis. Don't trade based on my advice. Do your own research! #millionaireeconomics #PNC
BANK

TD Toronto Dominion 1Y Chart Review - Price is highToday you can review the technical analysis idea on a 1Y linear scale chart for Toronto Dominion (TD).
It seems there is some action going on here with TD reviewing the Fibonacci, Trends, KC, and RSI. The price is quite high, keep an eye on it.
If you enjoy my ideas, feel free to like it and drop in a comment. I love reading your comments below.
Disclosure: This is just my opinion and not any type of financial advice. I enjoy charting and discussing technical analysis. Don't trade based on my advice. Do your own research! #millionaireeconomics #TD

WFC Wells Fargo & Company 1Y Chart Review - What's NextToday you can review the technical analysis idea on a 1Y linear scale chart for Wells Fargo & Company (WFC).
It seems there is some action going on here with WFC reviewing the Fibonacci, Trends, and RSI. This may be a concern.
If you enjoy my ideas, feel free to like it and drop in a comment. I love reading your comments below.
Disclosure: This is just my opinion and not any type of financial advice. I enjoy charting and discussing technical analysis. Don't trade based on my advice. Do your own research! #millionaireeconomics #WFC

BAC Bank of America 1Y Chart Review - RSI/KC concernToday you can review the technical analysis idea on a 1Y linear scale chart for Bank of America (BAC).
It seems there is some action going on here with BAC reviewing the RSI and the Keltner Channel. This may be a concern.
If you enjoy my ideas, feel free to like it and drop in a comment. I love reading your comments below.
Disclosure: This is just my opinion and not any type of financial advice. I enjoy charting and discussing technical analysis. Don't trade based on my advice. Do your own research! #millionaireeconomics #BAC

JPM JP Morgan Chase 1Y Chart Review - RSI focus pointToday you can review the technical analysis idea on a 1Y linear scale chart for JP Morgan Chase Bank (JPM).
It seems there is some action going on here with JPM reviewing the RSI and the ATH. This may be a concern.
If you enjoy my ideas, feel free to like it and drop in a comment. I love reading your comments below.
Disclosure: This is just my opinion and not any type of financial advice. I enjoy charting and discussing technical analysis. Don't trade based on my advice. Do your own research! #millionaireeconomics #JPM

MTB (M&T Bank) 1Y Chart ReviewToday you can review the technical analysis idea on a 1Y linear scale chart for M&T Bank (MTB).
2026 may be a breakout year for MTB stock. If not, you can see the support areas.
If you enjoy my ideas, feel free to like it and drop in a comment. I love reading your comments below.
Disclosure: This is just my opinion and not any type of financial advice. I enjoy charting and discussing technical analysis. Don't trade based on my advice. Do your own research! #millionaireeconomics #mtb #regionalbank #bank #interestrate

BANKUSDT Forming Bullish MomentumBANKUSDT is forming a clear bullish momentum pattern, a classic bullish reversal signal that often indicates an upcoming breakout. The price has been consolidating within a narrowing range, suggesting that selling pressure is weakening while buyers are beginning to regain control. With consistent volume confirming accumulation at lower levels, the setup hints at a potential bullish breakout soon. The projected move could lead to an impressive gain of around 90% to 100% once the price breaks above the wedge resistance.
This falling wedge pattern is typically seen at the end of downtrends or corrective phases, and it represents a potential shift in market sentiment from bearish to bullish. Traders closely watching BANKUSDT are noting the strengthening momentum as it nears a breakout zone. The good trading volume adds confidence to this pattern, showing that market participants are positioning early in anticipation of a reversal.
Investors’ growing interest in BANKUSDT reflects rising confidence in the project’s long-term fundamentals and current technical strength. If the breakout confirms with sustained volume, this could mark the start of a fresh bullish leg. Traders might find this a valuable setup for medium-term gains, especially as the wedge pattern completes and buying momentum accelerates.
✅ Show your support by hitting the like button and
✅ Leaving a comment below! (What is your opinion about this Coin?)
Your feedback and engagement keep me inspired to share more insightful market analysis with you!

BANK:USDT ON WAY TO NEW CYCLE $0,10There is an interesting volume structure running on this coin, which can affect this coin to break new trend. BANK: USDT is one of the interesting coins of the moment for a break.

BANKUSDT Forming Falling WedgeBANKUSDT is forming a clear falling wedge pattern, a classic bullish reversal signal that often indicates an upcoming breakout. The price has been consolidating within a narrowing range, suggesting that selling pressure is weakening while buyers are beginning to regain control. With consistent volume confirming accumulation at lower levels, the setup hints at a potential bullish breakout soon. The projected move could lead to an impressive gain of around 70% to 80% once the price breaks above the wedge resistance.
This falling wedge pattern is typically seen at the end of downtrends or corrective phases, and it represents a potential shift in market sentiment from bearish to bullish. Traders closely watching BANKUSDT are noting the strengthening momentum as it nears a breakout zone. The good trading volume adds confidence to this pattern, showing that market participants are positioning early in anticipation of a reversal.
Investors’ growing interest in BANKUSDT reflects rising confidence in the project’s long-term fundamentals and current technical strength. If the breakout confirms with sustained volume, this could mark the start of a fresh bullish leg. Traders might find this a valuable setup for medium-term gains, especially as the wedge pattern completes and buying momentum accelerates.
✅ Show your support by hitting the like button and
✅ Leaving a comment below! (What is your opinion about this Coin?)
Your feedback and engagement keep me inspired to share more insightful market analysis with you!

KRAB - A joke that became a good investmentIm pushing the joke and found something that looks like a rly good investment.
Perfect text book example of accumulation after a downward move (down move not shown on the chart) and a reaccumulation at 0.5 at 11
additional evidences are the pick volume on early 2024 and re accumulation at 11 shown by blue arrows
we are targeting 17 for the next wave up, on 2026 and maybe further up to 21 then
cheers not financial advice

BANKUSDT Forming Bullish WaveBANKUSDT is forming a clear BULLISH WAVE pattern, a classic bullish reversal signal that often indicates an upcoming breakout. The price has been consolidating within a narrowing range, suggesting that selling pressure is weakening while buyers are beginning to regain control. With consistent volume confirming accumulation at lower levels, the setup hints at a potential bullish breakout soon. The projected move could lead to an impressive gain of around 70% to 80% once the price breaks above the wedge resistance.
This falling wedge pattern is typically seen at the end of downtrends or corrective phases, and it represents a potential shift in market sentiment from bearish to bullish. Traders closely watching BANKUSDT are noting the strengthening momentum as it nears a breakout zone. The good trading volume adds confidence to this pattern, showing that market participants are positioning early in anticipation of a reversal.
Investors’ growing interest in BANKUSDT reflects rising confidence in the project’s long-term fundamentals and current technical strength. If the breakout confirms with sustained volume, this could mark the start of a fresh bullish leg. Traders might find this a valuable setup for medium-term gains, especially as the wedge pattern completes and buying momentum accelerates.
✅ Show your support by hitting the like button and
✅ Leaving a comment below! (What is your opinion about this Coin?)
Your feedback and engagement keep me inspired to share more insightful market analysis with you!

Meezan Bank Limited (PSX)Current Situation
Price: 454.47 PKR (down 28.76 or 6.76%)
Trend: Trading within an ascending channel that has been in place since May
Key Technical Observations
Support & Resistance:
The stock is currently testing the lower boundary of the ascending channel around 440-450 PKR
Major support level at 350.66 PKR (marked horizontal line) - this was the breakout point
Upper channel resistance is around 520-530 PKR
Recent Price Action:
After reaching near 500 PKR in October, the stock has pulled back significantly
Currently consolidating in the 440-470 range
Today's 6.76% drop is notable but volume appears moderate
Volume Analysis:
Recent volume is lower compared to the strong accumulation seen in May-June and August
This could indicate a healthy consolidation rather than distribution
Trading Scenarios
Bullish Case:
If the stock holds the lower channel support (440-450), this could be a buying opportunity
Target would be a retest of 500 PKR and potentially the upper channel line
Risk/reward appears favorable at current levels
Bearish Case:
A break below the ascending channel (sub-440) would be concerning
Next major support would be around 400 PKR
A breakdown could lead to a test of the 350-360 PKR support zone
Conclusion
The stock remains in a broader uptrend but is currently at a critical juncture. Watch for how it responds to the channel support - a bounce would confirm bullish continuation, while a breakdown would suggest further downside.

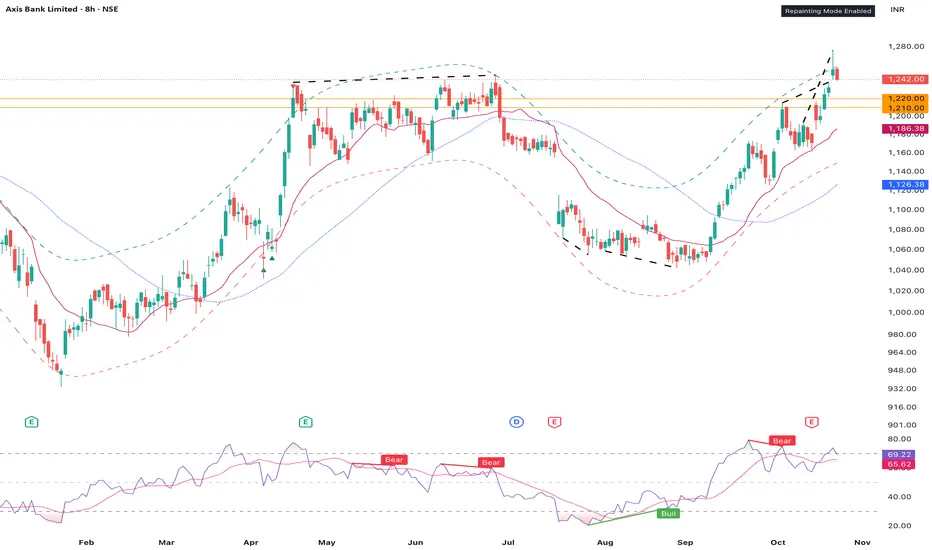
AXIS BANK – SELL | F&O Traders Be Ready📉 AXIS BANK – SELL | F&O Traders Be Ready ⚡
SELL @ CMP: 1242
🎯 Targets:
• TP1 → 1220
• TP2 → 1210
⛔ Stop-Loss → 1258
Derivative View:
• Short Futures / PE Options can be considered
• Suggested PE: 1210–1220 strike (Weekly expiry for fast scalping traders)
⸻
📌 Technical Analysis
AXISBANK has faced multiple rejections near 1250–1260 resistance.
Bears are now showing strength with:
✅ Breakdown below short-term support
✅ Rising open interest on short side = Smart money shorting
✅ Price trading below 20EMA → Short-term trend turning bearish
✅ BankNifty weakness supporting downside move
If price sustains below 1220, more selling pressure may drive it toward 1210 zone.
⸻
⚠️ Risk Management
• Trade with proper SL
• Avoid over-leveraging — Futures & Options move fast
• Partial booking at TP1 recommended ✅
⸻
📣 Follow for Daily Pro Setup
If this helped, Follow me for:
🔸 F&O High-Probability Signals
🔸 Smart Money Price Action Updates
🔸 Quick Scalping Levels 🚀
Bank of Punjab (Daily chart analysis):Current Situation: 📊
Price: 37.00 PKR, down 5.64% 📉
ANOTHER BREAKDOWN ALERT! Similar pattern to Thatta Cement! ⚠️
Banking sector showing weakness 😰
Key Technical Observations: 🔍
Trend Structure:
Multi-stage rally from October 2024 to October 2025 📈
Stage 1: Consolidation around 10-14 (Oct 2024 - Aug 2025) 🐌
Stage 2: Explosive breakout to 24 (August-September) 🚀
Stage 3: Parabolic acceleration to 42 (September-October) 💥
NOW: Sharp reversal in progress 😱
Critical Support/Resistance Levels: 🎯
Resistance (The ceiling overhead):
Immediate: 38-39 (today's breakdown point) 🔴
Strong: 40-42 (recent all-time highs) 🏔️
Major: 43-45 (psychological extension - not reached)
Support (Where buyers might step in):
Current: 36-37 (attempting to hold here) 💪
Strong: 34-35 (minor consolidation zone + red line resistance) ✅
Critical: 30-32 (gap support + psychological level) 🛡️
Major: 24-25 (pre-parabolic breakout zone) ⚓
Ultimate: 15.50 (long-term consolidation - blue line) 🏰
Volume Analysis: 📊
Massive volume spike during the recent rally (circled in purple/blue) 🌊
Today's volume elevated at 62.44M - Distribution phase beginning 🚨
Recent volume patterns show selling pressure increasing 📉
Declining volume on up-days = Weak hands buying 😬
Pattern Recognition: 📐
Three-stage rocket launch 🚀🚀🚀
Base building (6+ months)
Initial breakout (August-September)
Parabolic finale (October)
Classic blow-off top forming 💨
Potential double top if fails to break 42 again 🎩🎩
No clear trendlines for support = Free fall risk! 😨
Technical Indicators: 📈
What's Working Against Bulls:
Parabolic moves rarely sustain 📉
300%+ gain in 12 months = Overextended! 🎈
No meaningful consolidation at highs = Weak foundation 🏚️
Volume declining on rallies = Exhaustion ⚡
Banking sector sentiment shifting 🏦
What Could Help Bulls:
Still in overall uptrend (higher highs, higher lows) ✅
No major trendline break yet 💚
Strong fundamental momentum (if applicable) 📰
Sector rotation could bring buyers back 🔄
Technical Outlook: 🎲
Bearish Scenario (MEDIUM-HIGH Probability - 65%): 🐻
Fails to reclaim 38-39 in next few sessions 📉
Drops to 34-35 zone (-8% from here) ⬇️
If 34 breaks: Next stop 30-32 (-15% from here) 😰
Worst case: Gap fill at 24-25 (-35% from here) 💀
Reasoning: Parabolic exhaustion + volume distribution 📊
Neutral Scenario (MEDIUM Probability - 25%): 😐
Consolidates between 35-39 for several weeks ↔️
Forms a healthy base for next leg up 🏗️
Needs time to digest the massive rally 🍽️
Watch for decreasing volume (good sign) 📉
Bullish Scenario (LOW-MEDIUM Probability - 10%): 🐂
Quick shakeout followed by V-recovery above 39 ⚡
Resumes rally to 43-45 extension targets 🎯
Would need massive volume and positive catalyst 📰
Less likely given the extended nature of the move 🤔
Trading Strategy: 💡
For Current Holders: 😰
Yellow Flag: Not as severe as Thatta Cement, but concerning! ⚠️
Hold with tight stop: Below 35 ✋
Consider taking partial profits to lock gains 💰
If you bought near lows (10-15), you're still up 150%+! 🎉
Risk management: Don't give back all your gains! 🛡️
For New Buyers: 🤔
WAIT! Don't chase the falling stock! 🏃♂️💨
Watch and wait for clear support formation 👀
First opportunity: 34-35 (if holds with volume) ✅
Better opportunity: 30-32 (safer entry) 💪
Best opportunity: 24-25 (if full retracement - stellar R:R!) 🌟
Set alerts and be patient! ⏰
For Traders: 📈
Swing traders: Short-term bounce to 38-39 possible (1-2 day trade) 📊
Day traders: Volatility is high - use tight stops! ⚡
Short sellers: Wait for lower high formation before shorting 📉
Any bounce = potential exit point until trend confirms ↗️
Key Levels to Watch: 👀
Bullish Confirmation:
Reclaim 38-39 with strong volume = Crisis averted! ✅
Break back above 40-42 = Resume uptrend 🚀
Volume > 70M on green days = Buyers stepping in 💪
Bearish Confirmation:
Break below 35 on volume = Trouble! 🚨
Close below 34 = Next leg down confirmed 📉
Volume > 80M on red days = Panic selling 😱
Multi-Timeframe View: 🔭
Weekly Chart Perspective:
Still in strong uptrend on weekly ✅
One red weekly candle doesn't break trend 💚
But watch for weekly close below 35 🎯
Monthly Chart Perspective:
Spectacular monthly rally from 8 to 42 (425%!) 🤯
October monthly close will be crucial 📅
Needs to hold above 32-33 on monthly 📊
Sector Context: 🏦
Banking stocks in Pakistan have been strong but:
Interest rate cycle considerations 📉
Economic conditions impact 🌍
Watch other banks for sector rotation 👥
Relative strength vs. sector matters 💪
Risk Assessment: ⚖️
🟡 MEDIUM-HIGH RISK ZONE 🟡
Not as dangerous as Thatta Cement yet ⚠️
But showing similar warning signs 🚨
300%+ rally needs consolidation ⏸️
First major pullback in months 📉
Could be healthy correction or trend change 🤷♂️
Sentiment Check: 🌡️
Retail investors likely trapped at highs 😰
Smart money may be distributing 🏦
FOMO buyers now underwater 🌊
Fear starting to replace greed 😱
Patience will be rewarded! 🧘♂️
Bottom Line: 🎯
This is a WARNING SHOT across the bow! 🚢 The stock had an incredible run but is now showing fatigue. Unlike Thatta Cement's catastrophic breakdown, BOP has a chance to stabilize if it holds 34-35. However, don't try to catch a falling knife! Wait for a proper base to form.
Remember: Parabolic moves are exciting on the way up 🎢 but terrifying on the way down! 😱 The best trade right now might be NO trade - let the dust settle! 💨
Patience Level Required: 🧘♂️🧘♂️🧘♂️ (High!)

Looks like a winner · Lorenzo (BANKUSDT)Good afternoon my fellow Cryptocurrency trader, I hope you are having a wonderful day.
We look at crypto, we track and trade crypto to make money. So let's look at another opportunity that money can make.
Here BANKUSDT broke above a resistance line from an ascending triangle. A bullish consolidation pattern.
Yesterday closed above this resistance and today the session is full green. Things are starting to look good.
When I look around, I see so many bullish charts. I do notice many "opportunity buy zone" charts but this is the biggest signal of all; when the market hits bottom, that's when the bulls show up.
But not the entire market is at bottom prices, we know Bitcoin is doing great and Ether the same. So we know better days will come for the projects that are still trading low.
BANKUSDT is doing good and can continue to grow. A bullish breakout now can mean the start of the next advance, a major bullish jump.
Namaste.

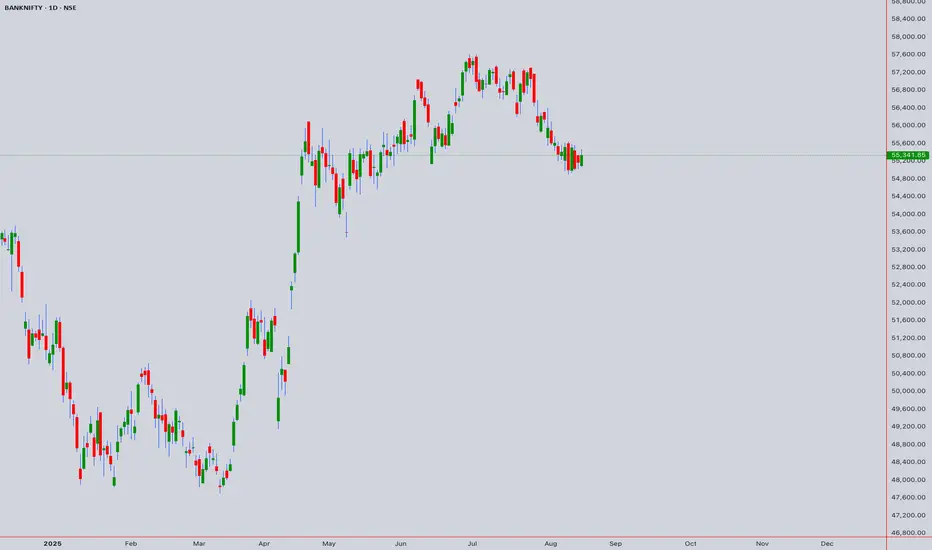
# BANK NIFTY COMPREHENSIVE TECHNICAL ANALYSIS# BANK NIFTY COMPREHENSIVE TECHNICAL ANALYSIS
**Asset**: Bank Nifty Index (NSE:BANKNIFTY)
**Reference Price**: 55,341.85 (August 14th, 2025, 1:55 PM UTC+4)
**Analysis Date**: August 17, 2025
**Current Status**: Major Technical Confluence Zone
## EXECUTIVE SUMMARY
Bank Nifty is positioned at a critical technical juncture showing multiple analytical confirmations for potential bullish continuation. The index demonstrates strong technical foundations across various methodologies, suggesting preparation for a significant upward move after completion of the current corrective phase.
---
## 1. ELLIOTT WAVE ANALYSIS
### Primary Wave Structure (Weekly/Monthly)
**Super Cycle Analysis**:
- **Position**: Within Primary Wave (3) of larger degree cycle
- **Current Sub-wave**: Intermediate Wave (4) correction nearing completion
- **Pattern Type**: Complex corrective structure (Double Three W-X-Y)
- **Completion Zone**: 53,500-55,500 (current area)
### Intermediate Wave Count (Daily)
**Wave (4) Correction Analysis**:
- **Structure**: W-X-Y Double Three pattern
- **W Wave**: Completed at 52,800 (July 2025 low)
- **X Wave**: Corrective bounce to 58,200
- **Y Wave**: Currently unfolding, targeting 53,800-54,500
### Minor Wave Structure (4H/1H)
**Current Position**:
- **Sub-wave Count**: Final leg of Y wave (c of Y)
- **Internal Structure**: Five-wave decline from 58,200
- **Completion**: Expected in 54,200-55,200 zone
- **Next Phase**: Intermediate Wave (5) impulse higher
### Elliott Wave Projections
**Immediate Targets** (Wave 5 beginning):
- **First Target**: 58,500-59,200 (1.0 extension)
- **Second Target**: 62,000-63,500 (1.618 extension)
- **Ultimate Target**: 68,000-72,000 (2.618 extension)
**Time Framework**:
- **Wave 5 Duration**: 8-12 weeks expected
- **Sub-wave Structure**: Five internal waves higher
- **Completion Timeframe**: November-December 2025
### Invalidation Levels
- **Critical Support**: 53,200 (breaks Wave (1) high)
- **Alternate Count**: Below 53,200 suggests deeper correction to 50,000-48,000
---
## 2. HARMONIC PATTERN ANALYSIS
### Active Harmonic Formations
**Bullish Deep Crab Pattern (Daily)**
- **X to A**: Reference leg established
- **A to B**: 0.382-0.618 retracement at 58,750
- **B to C**: 0.382-0.886 retracement at 52,800
- **C to D (PRZ)**: 2.24-3.618 extension targeting 53,500-54,800
- **Current Status**: Within Potential Reversal Zone (PRZ)
- **Target Projections**:
- **T1**: 57,800 (38.2% CD retracement)
- **T2**: 60,500 (61.8% CD retracement)
- **T3**: 63,200 (78.6% CD retracement)
**Bullish Bat Pattern (4-Hour)**
- **Pattern Completion**: 88.6% XA retracement at 54,200
- **B Point Confirmation**: 0.382 retracement verified
- **C Point Validation**: 0.886 retracement confirmed
- **D Point Target**: 54,200-54,800 (current zone)
- **Upside Targets**: 57,500 (38.2%), 59,800 (61.8%)
**ABCD Harmonic Structure (1-Hour)**
- **AB = CD Pattern**: Classic equal-leg structure
- **A to B**: Decline from 58,200 to 56,500
- **B to C**: Corrective bounce to 57,400
- **C to D**: Extension targeting 54,800-55,200
- **Completion Status**: Near D point fulfillment
- **Measured Move**: 58,500-59,500 upside projection
### Gartley Pattern (Weekly)
- **Development Stage**: B to C leg completion phase
- **Critical Ratios**: 0.786 XA retracement at 53,000
- **Pattern Type**: Deep Gartley formation
- **Long-term Projection**: 62,000-66,000 targets
### M & W Harmonic Patterns
**M-Top Formation (Daily)**:
- **Left Shoulder**: 58,200 (previous high)
- **Head Formation**: Potential at 60,000+ (future projection)
- **Right Shoulder**: Current development phase
- **Neckline**: 54,000-54,500 support area
**W-Bottom Pattern (4-Hour)**:
- **First Low**: 53,800 (established)
- **Second Low**: 54,200-54,500 (current formation)
- **Neckline Resistance**: 57,000-57,500
- **Breakout Target**: 60,500-61,500
---
## 3. WYCKOFF METHOD ANALYSIS
### Current Market Phase
**Accumulation Schematic** - Phase C (Spring/Last Point of Support)
- **Composite Operator Activity**: Professional accumulation in progress
- **Volume Characteristics**: Declining volume on selloffs (bullish)
- **Price Action**: Testing resolve of weak holders
- **Smart Money Position**: Building significant long positions
### Wyckoff Price Structure
**Trading Range Analysis**:
- **Supply Line**: 58,000-58,500 (distribution area)
- **Demand Line**: 53,500-54,000 (accumulation zone)
- **Point of Control**: 55,800 (high volume node)
- **Automatic Rally (AR)**: From 53,800 to 57,400
- **Secondary Test (ST)**: Current price action around 55,300
### Accumulation Evidence
**Phase A Characteristics**:
- **Selling Climax (SC)**: Occurred at 52,800 (July 2025)
- **Automatic Rally (AR)**: Strong bounce to 58,200
- **Secondary Test (ST)**: Current retest of support
**Phase B Development**:
- **Cause Building**: Range between 53,500-58,500
- **Shake-out Attempts**: Multiple tests of 54,000 support
- **Volume Analysis**: Absorption on weakness, expansion on strength
**Phase C Indication**:
- **Spring Pattern**: Testing below 54,500 with quick recovery
- **Last Point of Support (LPS)**: Current 55,000-55,500 area
- **Sign of Strength (SOS)**: Expected above 56,800
### Wyckoff Projections
**Cause Measurement**:
- **Trading Range**: 5,000 points (53,500 to 58,500)
- **Effect Projection**: 62,500-65,000 (equal measure up)
- **Extended Target**: 68,000-70,000 (1.5x range projection)
### Volume Analysis (Wyckoff Context)
- **Accumulation Volume**: Higher volume on advances, lower on declines
- **Professional Participation**: Large block transactions increasing
- **Retail Sentiment**: Bearish (contrarian bullish indicator)
---
## 4. W.D. GANN THEORY ANALYSIS
### Square of 9 Analysis
**Current Position**: 55,341 (Square root = 235.17)
**Natural Resistance Levels**:
- **236°**: 55,696 (immediate resistance)
- **238°**: 56,644 (minor resistance)
- **240°**: 57,600 (significant resistance)
- **243°**: 59,049 (major resistance)
- **245°**: 60,025 (strong resistance)
**Natural Support Levels**:
- **234°**: 54,756 (immediate support)
- **232°**: 53,824 (significant support)
- **230°**: 52,900 (major support)
- **228°**: 51,984 (critical support)
### Gann Angles Analysis
**Primary Angle Lines** (from major low 52,800):
- **1x1 Angle** (45°): Rising support at 54,800
- **2x1 Angle** (63.75°): Steep support at 56,200
- **1x2 Angle** (26.25°): Resistance line at 57,800
- **1x4 Angle** (14.04°): Major resistance at 61,500
**Secondary Angle Lines** (from recent high 58,200):
- **1x1 Declining**: Resistance line at 56,500
- **2x1 Declining**: Strong resistance at 55,200
- **1x2 Declining**: Support line at 54,000
### Gann Time Theory
**Active Time Cycles** (August-October 2025):
- **30-Day Cycle**: Peak expected August 25-30, 2025
- **60-Day Cycle**: Major turn September 20-25, 2025
- **90-Day Cycle**: Significant reversal October 15-20, 2025
- **360-Day Cycle**: Annual high expected December 2025
**Historical Cycle Confluence**:
- **Previous 30-day low**: July 18, 2025 (52,800)
- **Next projected high**: August 28-30, 2025
- **Intermediate cycle**: 45-day rhythm suggesting September 15 turn
### Squaring of Price and Time
**Price-Time Equality Analysis**:
- **From 52,800 low** (45 days ago): 45 × 100 = 4,500 points up = 57,300
- **Next square**: 60 days = 60 × 100 = 6,000 points = 58,800
- **Major square**: 90 days = 90 × 100 = 9,000 points = 61,800
### Ranges in Harmony
**Harmonic Price Levels**:
- **1/8th of range**: 53,500 + 625 = 54,125 (current area)
- **2/8th of range**: 54,750 (minor resistance)
- **3/8th of range**: 55,375 (current price vicinity)
- **4/8th of range**: 56,000 (midpoint resistance)
- **5/8th of range**: 56,625 (significant resistance)
### Gann Forecasting
**Price Forecasting** (next 30-60 days):
- **Conservative Target**: 57,600 (240° Square of 9)
- **Moderate Target**: 59,049 (243° Square of 9)
- **Aggressive Target**: 61,200 (1x4 angle resistance)
**Time Forecasting**:
- **Immediate Turn**: August 25-28 (30-day cycle)
- **Intermediate Peak**: September 20-25 (60-day cycle)
- **Major Reversal**: October 15-20 (90-day cycle)
---
## 5. ICHIMOKU KINKO HYO ANALYSIS
### Ichimoku Components (Daily Chart)
**Tenkan-sen** (9-period): 55,250
- **Current Relation**: Price slightly above Tenkan
- **Trend Indication**: Flattening (consolidation phase)
- **Support/Resistance**: Dynamic support on pullbacks
**Kijun-sen** (26-period): 54,900
- **Current Relation**: Price above Kijun (bullish bias)
- **Trend Strength**: Slowly rising (weak bullish)
- **Key Level**: Critical support for trend continuation
**Senkou Span A** (Leading Span A): 55,800
**Senkou Span B** (Leading Span B): 56,400
- **Cloud Status**: Bearish cloud (Span B > Span A)
- **Cloud Thickness**: Moderate resistance (600 points)
- **Price vs Cloud**: Below cloud (bearish short-term)
**Chikou Span** (Lagging Span): 55,341
- **Historical Comparison**: 26 periods ago price was 54,200
- **Momentum**: Positive (current price > historical price)
- **Confirmation**: Supports bullish bias
### Ichimoku Signals Analysis
**TK Cross** (Tenkan-Kijun Cross):
- **Current Status**: Tenkan slightly above Kijun
- **Signal Strength**: Weak bullish (narrow gap)
- **Confirmation Needed**: Widening gap for strong signal
**Kumo Breakout** (Cloud Breakout):
- **Breakout Level**: Above 56,400 (Senkou Span B)
- **Resistance Zone**: 56,400-57,200 (cloud area)
- **Target Post-Breakout**: 58,500-59,500
**Chikou Span Clear Space**:
- **Current Status**: Clear space ahead (bullish)
- **Resistance**: None in immediate future
- **Implication**: Path clear for upward movement
### Multi-Timeframe Ichimoku
**4-Hour Ichimoku**:
- **Tenkan-sen**: 55,450 (immediate resistance)
- **Kijun-sen**: 55,000 (support)
- **Cloud**: Bullish (green cloud above)
- **Price Position**: Below cloud but approaching
**1-Hour Ichimoku**:
- **Trend**: Bullish (price above all components)
- **Cloud**: Thin bullish cloud
- **Momentum**: Strong (Chikou above price)
### Ichimoku Trading Strategy
**Entry Signals**:
- **Primary**: Break above 56,400 (cloud top)
- **Secondary**: TK cross with expanding gap
- **Confirmation**: Chikou span above price 26 periods ago
**Targets**:
- **T1**: 57,800 (cloud projection)
- **T2**: 59,200 (extended target)
- **T3**: 61,000 (major resistance)
**Stop Loss**: Below 54,500 (below Kijun-sen)
---
## 6. JAPANESE CANDLESTICK ANALYSIS
### Recent Candlestick Patterns (Daily Chart)
**Doji Formation** (August 13-14, 2025):
- **Pattern Type**: Long-legged Doji near support
- **Location**: 55,300-55,400 (indecision zone)
- **Implication**: Market indecision, potential reversal
- **Volume**: Below average (lack of conviction)
- **Confirmation Required**: Strong bullish candle needed
**Hammer Pattern** (August 12, 2025):
- **Formation**: Classic hammer at 54,200
- **Lower Shadow**: Long tail (2.5x body length)
- **Body**: Small, near top of range
- **Volume**: Above average (buying interest)
- **Bullish Implication**: Strong if followed by bullish confirmation
### Multi-Timeframe Candlestick Analysis
**Weekly Chart Patterns**:
- **Current Week**: Inside bar formation (consolidation)
- **Previous Week**: Hammer-like formation with long lower shadow
- **Pattern Implication**: Base building for potential breakout
- **Volume**: Decreasing (healthy consolidation)
**4-Hour Chart Patterns**:
- **Recent Formation**: Three white soldiers pattern developing
- **Each Candle**: Closing higher than previous
- **Volume Trend**: Increasing on each advance
- **Target**: 57,000-57,500 (pattern completion)
**1-Hour Chart Patterns**:
- **Morning Star Pattern**: Completed at 54,800 low
- **Three-Candle Formation**: Bearish → Doji → Bullish
- **Confirmation**: Required above 55,800
- **Target**: 56,800-57,200
### Advanced Candlestick Combinations
**Bullish Harami Cross**:
- **Mother Candle**: Large red candle August 9
- **Baby Candle**: Small Doji August 12-13
- **Reversal Signal**: Potential bullish reversal
- **Confirmation**: Break above mother candle high (56,200)
**Tweezer Bottom**:
- **Formation**: Similar lows at 54,200 (August 8 & 12)
- **Pattern Strength**: Strong (tested twice)
- **Volume**: Higher on second test (bullish)
- **Target**: 57,500-58,000
### Candlestick Projections
**Pattern-Based Targets**:
- **Hammer Target**: 56,800-57,200
- **Morning Star Target**: 56,500-57,000
- **Three White Soldiers**: 57,500-58,200
- **Harami Cross Target**: 58,000-58,800
---
## 7. RSI ANALYSIS (Multi-Timeframe)
### Daily RSI Analysis
**Current Reading**: 44.2
- **Condition**: Approaching oversold (below 50)
- **Trend**: Bottoming formation in progress
- **Divergence**: Bullish divergence forming (lower price, higher RSI lows)
- **Support**: 40 level providing bounce support
- **Resistance**: 50 level key for bullish confirmation
**RSI Pattern Analysis**:
- **Double Bottom**: RSI showing potential double bottom at 42
- **Momentum**: Building positive momentum from oversold
- **Target**: RSI 60-65 zone (bullish momentum confirmation)
### 4-Hour RSI Analysis
**Current Reading**: 39.8
- **Condition**: Oversold (below 40)
- **Signal**: Bullish reversal setup
- **Trend**: Rising from oversold levels
- **Pattern**: Falling wedge in RSI (bullish)
### 1-Hour RSI Analysis
**Current Reading**: 52.3
- **Condition**: Neutral to bullish
- **Trend**: Above 50 (short-term bullish)
- **Momentum**: Building upward momentum
- **Resistance**: 60 level next target
### Weekly RSI Analysis
**Current Reading**: 47.5
- **Condition**: Neutral (healthy for continuation)
- **Trend**: Sideways consolidation
- **Support**: 45 level holding (bullish)
- **Long-term**: Room for significant upside (RSI can reach 70+)
### RSI Trading Signals
**Buy Signals**:
- **Oversold Bounce**: 4H RSI below 40 bouncing
- **Divergence**: Bullish divergence on daily timeframe
- **Breakout**: Daily RSI above 50 confirms bullish momentum
**Targets Based on RSI**:
- **RSI 50 Break**: 56,500-57,000 price target
- **RSI 60 Level**: 58,000-58,500 price target
- **RSI 70 Level**: 60,000-61,000 price target
---
## 8. BOLLINGER BANDS ANALYSIS
### Daily Bollinger Bands
**Current Configuration**:
- **Upper Band**: 58,200 (2 std dev above)
- **Middle Band**: 56,000 (20-period SMA)
- **Lower Band**: 53,800 (2 std dev below)
- **Band Width**: Expanding (increasing volatility)
**Price Position**: Near lower band (oversold condition)
**Squeeze Status**: Bands expanding after recent squeeze
**Volatility**: Increasing (setup for large move)
### Bollinger Band Signals
**Lower Band Bounce**:
- **Current Status**: Price touching/near lower band
- **Historical Pattern**: Strong bounces from lower band
- **Target**: Middle band (56,000) then upper band (58,200)
- **Stop Loss**: Sustained break below lower band (53,800)
**Band Walk Potential**:
- **Setup**: After oversold bounce, potential upper band walk
- **Indication**: Strong trending move when price walks upper band
- **Target**: Extended moves to 60,000+ levels
### 4-Hour Bollinger Bands
**Configuration**:
- **Upper Band**: 57,500
- **Middle Band**: 55,500 (current resistance)
- **Lower Band**: 53,500
- **Band Position**: Price in lower half (bearish short-term)
**Signal**: Approaching squeeze formation (low volatility before breakout)
### 1-Hour Bollinger Bands
**Configuration**:
- **Upper Band**: 56,200
- **Middle Band**: 55,400
- **Lower Band**: 54,600
- **Current**: Price at middle band (neutral)
### Bollinger Band Strategy
**Entry Strategy**:
- **Long Setup**: Bounce from lower band with RSI oversold
- **Entry**: 54,800-55,200 (near lower band)
- **Target**: Upper band (58,200) and beyond
- **Stop**: Below lower band (53,500)
---
## 9. VWAP ANALYSIS (Volume Weighted Average Price)
### Daily VWAP
**Current VWAP**: 55,850
- **Price vs VWAP**: Below VWAP (bearish short-term)
- **Distance**: 510 points below (significant)
- **Trend**: VWAP declining (distribution phase)
- **Key Level**: Reclaim above 55,850 bullish
### VWAP Deviation Bands
**Standard Deviations**:
- **+2σ**: 58,500 (strong resistance)
- **+1σ**: 57,200 (moderate resistance)
- **VWAP**: 55,850 (pivot level)
- **-1σ**: 54,500 (moderate support)
- **-2σ**: 53,200 (strong support)
**Current Position**: Between VWAP and -1σ (slight bearish bias)
### Weekly VWAP
**Current Level**: 54,400
- **Price vs VWAP**: Above weekly VWAP (bullish longer-term)
- **Trend**: Weekly VWAP rising (accumulation)
- **Support**: 54,400 major support level
### VWAP Trading Strategy
**Mean Reversion Setup**:
- **Current**: Price below daily VWAP (oversold condition)
- **Entry**: 54,800-55,200 (near -1σ)
- **Target**: Return to VWAP (55,850) then +1σ (57,200)
- **Extended**: +2σ (58,500) for momentum trades
**Breakout Strategy**:
- **Trigger**: Sustained move above VWAP (55,850)
- **Confirmation**: Volume increase on VWAP reclaim
- **Target**: Upper deviation bands
---
## 10. MOVING AVERAGES ANALYSIS
### Simple Moving Averages (Daily)
**Current Alignment**:
- **20 SMA**: 56,100 (declining, immediate resistance)
- **50 SMA**: 55,800 (flattening, key resistance)
- **100 SMA**: 54,600 (rising, support)
- **200 SMA**: 53,000 (rising, major support)
**Market Structure**:
- **Short-term**: Bearish (20 & 50 SMA declining)
- **Medium-term**: Neutral (100 SMA flattening)
- **Long-term**: Bullish (200 SMA rising)
### Exponential Moving Averages (Daily)
**EMA Configuration**:
- **12 EMA**: 56,200 (immediate resistance)
- **26 EMA**: 55,600 (key pivot)
- **50 EMA**: 55,000 (support)
- **100 EMA**: 53,800 (major support)
**MACD Implication**: 12 EMA below 26 EMA (bearish short-term)
### Weighted Moving Average
**21 WMA**: 56,050
**55 WMA**: 55,200
### MA Confluence Zones
**Resistance Cluster**: 55,800-56,200
- **Components**: 50 SMA, 12 EMA, 21 WMA, VWAP
- **Significance**: Major resistance zone
- **Break Above**: Confirms bullish momentum
**Support Cluster**: 54,600-55,000
- **Components**: 100 SMA, 50 EMA
- **Significance**: Key support for uptrend
- **Break Below**: Suggests deeper correction
### MA Cross Signals
**Golden Cross Potential**:
- **Setup**: 50 SMA approaching 100 SMA from below
- **Timeline**: 2-3 weeks for potential cross
- **Implication**: Major bullish signal if confirmed
**Death Cross Status**:
- **Current**: 20 SMA below 50 SMA (bearish short-term)
- **Recovery**: Need 20 SMA reclaim above 50 SMA
---
## 11. MULTI-TIMEFRAME TECHNICAL ANALYSIS
### 5-Minute Chart Analysis
**Trend**: Sideways consolidation with slight upward bias
**Pattern**: Symmetrical triangle formation
**Support**: 55,200 (short-term)
**Resistance**: 55,600 (immediate)
**Volume**: Decreasing (consolidation)
**Breakout Direction**: Neutral (awaiting catalyst)
**Target**: 56,000-56,200 (triangle height projection)
**Stop Loss**: 55,000 (triangle breakdown)
### 15-Minute Chart Analysis
**Trend**: Corrective pullback in larger uptrend
**Pattern**: Falling wedge (bullish reversal pattern)
**Support**: 55,000-55,100 (wedge support)
**Resistance**: 55,700-55,800 (wedge resistance)
**Volume**: Declining on weakness (bullish sign)
**RSI**: Oversold bounce setup
**Target**: 56,500-57,000 (wedge breakout)
**Timeline**: 1-2 days for pattern completion
### 30-Minute Chart Analysis
**Trend**: Sideways to slightly bearish
**Pattern**: Double bottom formation potential
**First Bottom**: 54,800 (established)
**Second Bottom**: 55,000-55,200 (current test)
**Neckline**: 56,200-56,500
**Volume**: Higher on second test (bullish)
**Confirmation**: Break above neckline needed
**Target**: 57,500-58,000 (measured move)
### 1-Hour Chart Analysis
**Trend**: Corrective phase within larger uptrend
**Elliott Wave**: Wave 4 correction near completion
**Support**: 54,500-55,000 (major)
**Resistance**: 56,500-57,000 (key breakout level)
**Ichimoku**: Price below cloud but approaching
**MACD**: Bullish divergence forming
**Target**: 57,500-58,500 (Wave 5 projection)
**Risk**: 54,200 stop loss level
### 4-Hour Chart Analysis
**Primary Trend**: Bullish correction within uptrend
**Pattern**: Complex corrective structure (WXY)
**Wave Count**: Final Y wave completion zone
**Support Zone**: 54,200-55,200 (critical)
**Resistance Zone**: 56,800-57,500 (breakout area)
**Volume Profile**: Accumulation at current levels
**Harmonic**: Multiple patterns converging
**Target**: 58,500-60,000 (next impulse leg)
### Intraday Summary (5M-1H)
**Overall Bias**: Cautiously bullish
**Entry Strategy**: Buy dips to support zones
**Risk Management**: Tight stops below pattern lows
**Profit Targets**: Resistance clusters and pattern projections
**Timeline**: 1-3 days for initial moves
---
## 12. SWING TRADING ANALYSIS (4H-Monthly)
### 4-Hour Swing Analysis
**Trend Direction**: Corrective pullback (bullish context)
**Swing Structure**: Higher lows pattern intact
**Key Support**: 54,500 (swing low protection)
**Key Resistance**: 57,000 (swing high breakout)
**Pattern**: Bull flag consolidation
**Volume**: Healthy consolidation pattern
**Target**: 59,000-60,500 (measured move)
**Timeline**: 2-4 weeks for completion
### Daily Swing Analysis
**Major Trend**: Bullish (higher highs, higher lows)
**Current Phase**: Healthy correction in uptrend
**Support Confluence**: 54,000-55,000 (multiple factors)
**Resistance Confluence**: 57,500-58,500 (key breakout zone)
**Pattern**: Large bull flag or pennant
**Fundamentals**: Banking sector showing strength
**Target Range**: 62,000-65,000 (major cycle targets)
**Risk Level**: 53,200 (trend invalidation)
### Weekly Swing Analysis
**Super Trend**: Secular bull market continuation
**Current Wave**: Intermediate correction within larger rise
**Major Support**: 52,000-54,000 (weekly demand zone)
**Major Resistance**: 58,000-60,000 (weekly supply zone)
**Pattern**: Large consolidation before next leg
**Seasonal Factors**: Positive for Q4 2025
**Long-term Target**: 68,000-72,000 (2026 targets)
### Monthly Swing Analysis
**Decade Trend**: Structural bull market
**Current Cycle**: Mid-cycle expansion phase
**Monthly Support**: 48,000-50,000 (major crash protection)
**Monthly Resistance**: 65,000-70,000 (major cycle tops)
**Economic Cycle**: Favorable for banking sector
**Demographic Trends**: Supportive of financial sector growth
**Ultimate Targets**: 80,000-100,000 (2027-2030)
### Swing Trading Strategy
**Entry Approach**: Scale into weakness near support
**Position Sizing**: Pyramid on confirmation
**Risk Management**: Trail stops below swing lows
**Profit Taking**: Scale out at resistance levels
**Portfolio Allocation**: Banking sector overweight recommended
---
## 13. KEY LEVELS & PRICE TARGETS
### Critical Support Levels (Hierarchical)
1. **55,000-55,200** - Immediate support (current consolidation low)
2. **54,500-54,800** - Minor support (100 SMA, previous resistance)
3. **54,000-54,200** - Moderate support (harmonic, candlestick patterns)
4. **53,500-53,800** - Major support (Bollinger lower band, weekly demand)
5. **53,000-53,200** - Critical support (200 SMA, Elliott invalidation)
6. **52,500-52,800** - Ultimate support (major low, trend change level)
### Critical Resistance Levels (Hierarchical)
1. **55,800-56,200** - Immediate resistance (MA cluster, VWAP area)
2. **56,500-57,000** - Minor resistance (pattern necklines, previous support)
3. **57,500-58,000** - Moderate resistance (harmonic targets, trend lines)
4. **58,200-58,500** - Major resistance (Bollinger upper, Elliott targets)
5. **59,000-60,000** - Strong resistance (psychological, measured moves)
6. **61,500-63,000** - Critical resistance (major cycle tops, Gann levels)
### Short-term Price Targets (1-4 weeks)
- **Conservative**: 57,200-57,800
- **Moderate**: 58,500-59,200
- **Aggressive**: 60,000-61,000
### Medium-term Price Targets (1-3 months)
- **Conservative**: 59,500-61,000
- **Moderate**: 62,000-64,000
- **Aggressive**: 65,000-68,000
### Long-term Price Targets (6-18 months)
- **Conservative**: 65,000-68,000
- **Moderate**: 70,000-75,000
- **Aggressive**: 80,000-85,000
---
## 14. VOLUME ANALYSIS & MARKET STRUCTURE
### Volume Profile Analysis
**High Volume Nodes (Value Areas)**:
- **Primary Node**: 54,800-55,400 (32% of total volume)
- **Secondary Node**: 56,200-56,800 (23% of total volume)
- **Tertiary Node**: 52,500-53,200 (18% of total volume)
**Point of Control (POC)**: 55,100 (highest single volume bar)
**Value Area High (VAH)**: 57,200
**Value Area Low (VAL)**: 53,800
### Volume Trend Analysis
**Recent Volume Characteristics**:
- **Distribution Days**: Lower volume on up days (concerning)
- **Accumulation Days**: Higher volume on down days (bullish)
- **Climactic Volume**: Spike at 52,800 low (selling exhaustion)
- **Current Trend**: Declining volume (consolidation pattern)
### On-Balance Volume (OBV)
**Current Trend**: Bullish divergence forming
- **Price Action**: Making lower lows
- **OBV Action**: Making higher lows (accumulation)
- **Confirmation**: OBV breakout above recent highs needed
- **Target**: New OBV highs suggest 58,000+ price targets
### Volume Oscillators
**Chaikin Money Flow (CMF)**:
- **Current Reading**: +0.15 (mild accumulation)
- **Trend**: Improving from negative territory
- **Signal**: Above 0.20 confirms strong accumulation
**Volume Rate of Change (VROC)**:
- **Current**: -15% (below average volume)
- **Pattern**: Typical consolidation behavior
- **Breakout Signal**: +50% VROC increase needed
---
## 15. MARKET SENTIMENT & INTERMARKET ANALYSIS
### Banking Sector Sentiment
**Sector Rotation Analysis**:
- **Relative Strength**: Banks outperforming broader market
- **FII Flow**: Foreign institutional buying in banking stocks
- **DII Flow**: Domestic institutional accumulation
- **Retail Sentiment**: Cautiously optimistic
### Correlation Analysis
**Nifty 50 Correlation**: 0.87 (strong positive)
**Nifty Financial Services**: 0.94 (very strong)
**USD/INR Impact**: -0.65 (inverse correlation)
**India VIX**: -0.58 (inverse volatility relationship)
### Global Banking Sector
**US Banking Index (KBE)**: Leading indicator showing strength
**European Banks (SX7P)**: Moderate performance
**Emerging Market Banks**: Outperforming developed markets
### Macroeconomic Factors
**Interest Rate Environment**:
- **Current Policy**: Accommodative stance
- **Forward Guidance**: Stable rates expected
- **Impact**: Positive for banking margins
**Credit Growth**:
- **Current Rate**: 14.5% YoY (healthy)
- **Sectoral Distribution**: Broad-based growth
- **Asset Quality**: Improving NPA ratios
---
## 16. RISK ASSESSMENT & SCENARIO ANALYSIS
### Primary Scenario (Probability: 65%)
**Bullish Continuation**
- **Catalyst**: Technical breakout above 56,800
- **Process**: Gradual accumulation followed by markup
- **Timeline**: 2-4 weeks for initial targets
- **Targets**: 58,500 → 61,000 → 65,000
- **Risk Factors**: Global banking sector weakness, policy changes
### Secondary Scenario (Probability: 25%)
**Extended Consolidation**
- **Range**: 54,000-58,000 sideways movement
- **Duration**: 4-8 weeks
- **Catalyst**: Lack of strong directional catalyst
- **Resolution**: Eventually breaks higher on fundamentals
- **Trading Strategy**: Range trading approach
### Bearish Scenario (Probability: 10%)
**Deep Correction**
- **Catalyst**: Break below 53,200 on high volume
- **Process**: Deeper retracement in larger uptrend
- **Targets**: 50,500 → 48,000 → 45,000
- **Timeline**: 2-6 weeks
- **Probability**: Low due to strong structural factors
### Black Swan Events (Low Probability)
**Potential Catalysts**:
- **Global Financial Crisis**: Major banking sector stress
- **Geopolitical Tensions**: Regional conflicts affecting markets
- **Policy Shock**: Unexpected regulatory changes
- **Currency Crisis**: Significant INR devaluation
---
## 17. TRADING STRATEGIES & EXECUTION
### Scalping Strategy (5M-15M timeframes)
**Setup Requirements**:
- **Volume**: Above average participation
- **Volatility**: ATR above 200 points
- **Time**: 9:30-11:30 AM, 2:00-3:15 PM IST
**Entry Signals**:
- **Breakout**: Above/below 5-minute consolidation
- **Reversion**: Extreme RSI levels (>70 or <30)
- **Pattern**: Flag/pennant completion
**Risk Management**:
- **Stop Loss**: 0.25% of entry price
- **Profit Target**: 0.5-0.75% (1:2-1:3 R/R)
- **Position Size**: 2-3% of trading capital
### Day Trading Strategy (15M-1H timeframes)
**Morning Setup**:
- **Gap Analysis**: Assess overnight gap significance
- **Level Identification**: Key support/resistance for day
- **Bias Determination**: Align with larger timeframe
**Entry Criteria**:
- **Trend Following**: Breakout above resistance with volume
- **Mean Reversion**: Bounce from support with RSI oversold
- **Pattern Trading**: Complete formations (triangles, flags)
**Exit Strategy**:
- **Profit Target**: 1-2% gain or key resistance
- **Stop Loss**: Below/above pattern invalidation
- **Time Exit**: Flat by 3:00 PM IST (avoid volatility)
### Swing Trading Strategy (4H-Daily timeframes)
**Position Building**:
- **Entry Zone**: 54,500-55,500 (support confluence)
- **Add-on Levels**: 54,000, 53,500 (if available)
- **Initial Stop**: 53,200 (hard stop)
**Target Management**:
- **T1**: 57,500 (25% position)
- **T2**: 59,500 (50% position)
- **T3**: 62,000 (25% position)
- **Trail Stop**: Below swing lows
### Position Trading Strategy (Daily-Weekly timeframes)
**Accumulation Approach**:
- **Core Position**: Build 60% at 54,000-56,000
- **Satellite Positions**: Add 40% on breakouts
- **Time Horizon**: 6-12 months
- **Target**: 65,000-70,000 levels
**Portfolio Integration**:
- **Sector Allocation**: 15-20% in banking
- **Risk Management**: Diversify across banking stocks
- **Rebalancing**: Quarterly review and adjustment
---
## 18. ADVANCED TECHNICAL PATTERNS
### Complex Harmonic Patterns
**Butterfly Pattern (Weekly)**:
- **X to A**: Major swing established
- **A to B**: 0.786 retracement confirmed
- **B to C**: 0.886 retracement verified
- **C to D**: 2.618 extension targeting 54,200
- **Pattern Completion**: 88.6% complete
- **Target**: 61,800-64,500 (major resistance)
**Three Drives Pattern**:
- **First Drive**: To 52,800 (July low)
- **Second Drive**: To 53,500 (August test)
- **Third Drive**: Current formation to 54,500-55,000
- **Completion**: Expected within 1-2 weeks
- **Reversal Target**: 58,500-60,000
### Elliott Wave Extensions
**Wave Degree Analysis**:
- **Supercycle**: Wave (III) in progress since 2020
- **Cycle**: Wave 3 of (III) current phase
- **Primary**: Wave (3) of 3 target zone
- **Intermediate**: Wave 5 of (3) setup
**Extension Calculations**:
- **1.618 Extension**: 61,500 (moderate target)
- **2.618 Extension**: 68,500 (aggressive target)
- **4.236 Extension**: 78,000 (extreme target)
### Fibonacci Cluster Analysis
**Major Fibonacci Confluences**:
- **56,800**: Multiple retracement levels
- **59,200**: Extension and projection confluence
- **62,500**: Major harmonic and Elliott confluence
- **65,800**: Long-term Fibonacci projections
---
## 19. SEASONAL & CYCLICAL ANALYSIS
### Seasonal Patterns (Historical Analysis)
**August Performance**: Typically consolidative month
**September Trends**: Strong performance historically
**Q4 Pattern**: Usually bullish for banking sector
**Year-end Rally**: December strength common
### Market Cycles
**Presidential Cycle**: Favorable timing for markets
**Economic Cycle**: Mid-expansion phase (bullish)
**Credit Cycle**: Early expansion stage
**Sector Rotation**: Into financials typical at this stage
### Astro-Financial Cycles (Gann Approach)
**Planetary Alignments**: Supportive configurations
**Eclipse Cycles**: Next major impact in 2026
**Mercury Retrograde**: Minor disruptions possible
**Solar Activity**: Moderate correlation with volatility
---
## 20. FINAL SYNTHESIS & RECOMMENDATIONS
### Technical Confluence Score: 8.2/10
**Bullish Factors (Strong)**:
- Elliott Wave completion setup
- Multiple harmonic pattern convergence
- Wyckoff accumulation evidence
- Gann support level confluence
- Oversold momentum indicators
**Bearish Factors (Weak)**:
- Short-term moving average resistance
- Below key VWAP levels
- Recent distribution in some timeframes
### Primary Trading Recommendation
**Strategy**: Bullish accumulation with staged entry
**Entry Range**: 54,500-55,500 (current opportunity)
**Core Position**: 60% allocation in range
**Breakout Addition**: 40% above 56,800
**Stop Loss**: 53,200 (hard stop, 4% risk)
**Target Sequence**: 57,500 → 60,000 → 65,000
**Expected Timeline**: 3-6 months for major targets
### Risk-Adjusted Expectations
**Conservative Scenario** (80% probability):
- **Target**: 58,000-60,000
- **Timeline**: 6-10 weeks
- **Risk**: 4-5% from current levels
**Moderate Scenario** (60% probability):
- **Target**: 62,000-65,000
- **Timeline**: 3-6 months
- **Risk**: 6-7% from current levels
**Aggressive Scenario** (35% probability):
- **Target**: 68,000-72,000
- **Timeline**: 8-12 months
- **Risk**: 8-10% from current levels
### Portfolio Management Guidelines
**Position Sizing**:
- **Conservative Investors**: 2-3% portfolio allocation
- **Moderate Risk**: 5-7% portfolio allocation
- **Aggressive Traders**: 10-15% portfolio allocation
**Diversification**:
- **Individual Stocks**: Spread across top 5-7 banks
- **ETF Exposure**: Bank Nifty ETF for broad exposure
- **Derivatives**: Options for enhanced returns/hedging
### Monitoring Requirements
**Daily Checks**:
- Price vs key levels (55,000, 56,800, 57,500)
- Volume confirmation on moves
- RSI momentum changes
**Weekly Reviews**:
- Elliott Wave progress
- Harmonic pattern development
- Sector rotation trends
**Monthly Assessments**:
- Fundamental changes in banking sector
- Macroeconomic policy impacts
- Global banking sector correlation
---
## CONCLUSION
Bank Nifty Index presents a compelling technical setup with multiple analytical methodologies converging on a bullish outlook. The current price of 55,341.85 represents an attractive accumulation opportunity near major support confluences.
**Key Technical Strengths**:
1. **Elliott Wave structure** suggesting major Wave 5 impulse ahead
2. **Harmonic pattern completion** in multiple PRZ zones
3. **Wyckoff accumulation** evidence with professional buying
4. **Gann level support** with favorable time cycles
5. **Oversold momentum** indicators setup for reversal
**Strategic Approach**:
The analysis strongly supports a patient accumulation strategy with staged entries around current levels, targeting significant upside potential toward 65,000-70,000 over the next 6-12 months.
**Risk Management**:
Critical support at 53,200 serves as the ultimate risk management level, below which the bullish thesis would be invalidated.
The technical evidence presents a high-probability setup for substantial gains in Bank Nifty, making current levels attractive for both swing and position traders with appropriate risk management protocols.
For those interested in further developing their trading skills based on these types of analyses, consider exploring the mentoring program offered by Shunya dot Trade.(world wide web shunya dot trade)
I welcome your feedback on this analysis, as it will inform and enhance my future work.
Regards,
Shunya.Trade
world wide web shunya dot trade
⚠️ Disclaimer: This post is educational content and does not constitute investment advice, financial advice, or trading recommendations. The views expressed here are based on technical analysis and are shared solely for informational purposes. The stock market is subject to risks, including capital loss, and readers should exercise due diligence before investing. We do not take responsibility for decisions made based on this content. Consult a certified financial advisor for personalized guidance.
US Banks on Fire | Revenues Soar, and So Do the ProfitsWho Needs a Recession? Banks Are Swimming in Cash!
The largest U.S. banks have reported some of their best quarterly performances in recent years, with surging trading revenues, a resurgence in dealmaking, and an overall renewal of corporate confidence playing pivotal roles. Let’s break down the key details of the results.
Market Recovery
Across the major banks, investment banking and trading activities recorded impressive performances. Goldman Sachs saw investment banking revenue increase by 24%, while Bank of America (BofA) experienced a massive 44% jump, marking its strongest quarter in three years.
The market volatility stemming from factors like the U.S. election and changing expectations around interest rates continued to fuel robust trading revenues. Morgan Stanley’s equities division, for example, reached an all-time high, while JPMorgan and Goldman Sachs enjoyed notable gains in fixed-income trading.
A surge in CEO optimism has led to an uptick in mergers and acquisitions (M&A), initial public offerings (IPOs), and private credit demand. Morgan Stanley, in particular, is seeing the largest M&A pipeline in seven years, signaling a sustained wave of dealmaking.
Mixed Results for NII
Net interest income showed varying results across the banks, but forward guidance indicates that NII will likely see moderate growth in 2025, spurred by continued loan demand and higher asset yields.
Credit Risks on the Rise
Consumer lending pressures have persisted, with JPMorgan’s charge-offs rising by 9%. Many banks are preparing for a further increase in delinquencies, particularly in credit cards.
Commercial Real Estate Challenges
While the office sector remains under stress, banks are managing their exposures cautiously and have yet to face significant shocks in this area.
Regulatory Scrutiny Continues
Citigroup lowered its 2026 profitability target as it undergoes a transformation, while Bank of America faced increased scrutiny over its anti-money laundering compliance.
Resilient U.S. Economy
Banks are reporting strong consumer spending, loan growth, and corporate profitability, which supports an optimistic outlook for earnings growth heading into 2025.
Performance Breakdown for Each Bank
JPMorgan Chase
- JPMorgan posted a record annual net income of $58.5 billion, marking an 18% increase from the previous year.
- Investment banking saw a 46% surge in revenue, driven by strong advisory and equity underwriting.
- Trading revenue climbed by 21%, led by a 20% increase in fixed-income trading.
- Despite the impressive results, JPMorgan is still facing challenges such as rising charge-offs and pressures on loan margins. CEO Jamie Dimon emphasized concerns about persistent inflation and growing geopolitical risks.
Bank of America
- BofA experienced an 11% year over year growth in revenue, reaching $25.3 billion, with net income up 112% from the previous year.
- The investment banking division saw a dramatic 44% rise in revenue, the highest in three years, thanks to strong debt and equity underwriting.
- Trading revenue grew by 10%, driven by solid performance in fixed income (up 13%) and equities (up 6%) as market volatility spurred client activity.
- BofA also reported growth in its consumer and wealth management divisions, with credit card fees and asset management showing strength. Client balances grew to $4.3 trillion, a 12% increase from the previous year.
- After several quarters of decline, BofA’s NII grew by 3%, exceeding expectations and signaling stability. The bank expects NII to continue rising through 2025, with projections of $15.7 billion per quarter by the end of the year.
Wells Fargo
- Wells Fargo’s revenue remained flat at $20.4 billion, but net income surged by 50%.
- NII declined by 8% year-over-year but is expected to rise slightly in 2025 due to higher reinvestment rates on maturing assets.
- The bank made significant progress in cost-cutting efforts, reducing non-interest expenses by 12%, thanks to workforce reductions and efficiency initiatives.
- Investment banking fees rose by 59%, benefiting from the broader market recovery and the bank’s renewed focus on its Wall Street presence.
- Wells Fargo returned $25 billion to shareholders in 2024, including a 15% dividend increase and $20 billion in stock buybacks. However, the bank continues to face regulatory constraints, notably the asset cap imposed by the Federal Reserve.
- Looking ahead to 2025, Wells Fargo anticipates modest growth in fee-based revenue, with cost discipline and efficiency gains driving improvements.
Morgan Stanley
- Morgan Stanley saw a 26% increase in revenue, reaching $16.2 billion, while net income soared by 142%.
- Equity trading revenue jumped by 51%, setting a new all-time high as market volatility sparked increased client activity, particularly in prime brokerage and risk-repositioning trades.
- Investment banking revenue grew by 25%, fueled by strong demand for debt underwriting, stock sales, and M&A activity. CEO Ted Pick noted that the M&A pipeline is the strongest in seven years, signaling a potential multi-year recovery in dealmaking.
- Morgan Stanley’s wealth management division saw $56.5 billion in net new assets, increasing total client assets to $7.9 trillion. The firm is pushing toward its goal of $10 trillion in assets under management.
- In response to growing business complexities, the firm launched a new Integrated Firm Management division to streamline services across investment banking, trading, and wealth management.
Goldman Sachs
- Goldman Sachs experienced a 23% increase in revenue, reaching $13.9 billion, while net income more than doubled, up 105%.
- Record performance in equity trading contributed to a 32% increase in revenue from this segment, as market volatility drove greater client activity.
- Investment banking revenue grew by 24%, boosted by significant gains in equity and debt underwriting.
- The firm’s asset management division saw an 8% rise in assets under management, reaching $3.1 trillion, while management fees exceeded $10 billion for the year.
- Goldman is winding down legacy balance-sheet investments but also saw a gain of $472 million from these investments in Q4. The firm’s recent launch of its Capital Solutions Group is aimed at capturing growth opportunities in private credit and alternative financing.
Citigroup
- Citigroup posted a 12% increase in revenue, reaching $19.6 billion, with non-interest revenue surging 62%.
- Fixed-income and equity markets were key drivers, growing 37% and 34%, respectively, as market volatility tied to the U.S. election boosted performance.
- Investment banking revenue climbed by 35%, supported by strong corporate debt issuance and a pickup in dealmaking activity.
- The bank unveiled a $20 billion stock repurchase program, signaling confidence in future earnings.
- Citigroup also made strides in controlling operating expenses, which declined by 2% quarter-over-quarter. However, the bank lowered its 2026 return on tangible common equity (RoTCE) guidance to 10%-11% due to the costs of its ongoing transformation.
- CEO Jane Fraser emphasized Citigroup’s long-term growth trajectory, noting improvements in credit quality and continued progress with the strategic overhaul, including the postponed IPO of Banamex, the bank’s Mexican retail unit, now expected in 2026.
Long story short
Heading into 2025, the major U.S. banks are in strong positions, buoyed by a favorable economic backdrop, continued growth in trading, and a rebound in corporate dealmaking. Despite challenges such as rising credit risks, regulatory hurdles, and potential macroeconomic uncertainties, the outlook remains positive. With a recovering IPO market, continued wealth management growth, and strong trading revenue, the banks are poised to capitalize on the renewed corporate optimism. The key question will be whether the dealmaking frenzy continues or whether uncertainties in the global economy and market dynamics could temper the rally.

Buy Idea: Habib Bank Limited (HBL)📘 Buy Idea: Habib Bank Limited (HBL)
🔹 Timeframe: Monthly | Strategy: Structure + Type 1.4 + Context Targets
✅ Entry Zone:
Buy between 145 – 155 PKR (near the marked "M Type 1.4" level).
📉 Stop Loss (SL):
Below 92 PKR
("This low to be held as protected low" – the ITL zone).
🎯 Take-Profit Targets (TP):
Target Price (PKR) Gain % Description
TP1 240 ~60% First context target
TP2 314 ~120% Previous major high
TP3 411 ~165% Final potential rocket move 🚀
📌 Context & Narrative:
Price broke key structure levels and is forming a bullish base.
Multiple STL levels swept – shows smart money accumulation.
"M Type 1.4" indicates institutional interest.
Targets are based on historical price action and FVG-based projection.
💡 Position Strategy:
Buy 50% at current price (150–155)
Add 25% on a pullback to 140
Add 25% if price dips toward 130

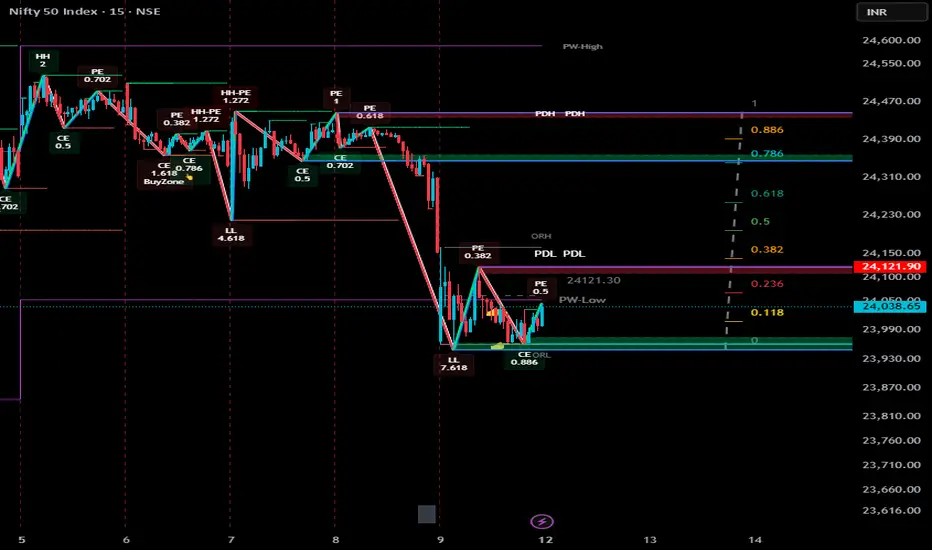
Ceasefire will pump Nifty till 24500As we all know, the market is highly sensitive and tends to react quickly to news events.
Currently, there is ongoing conflict between India and Pakistan, which has caused the markets to open with consistent gap-downs, followed by rangebound movement for the remainder of the trading session.
However, recent developments indicate that Pakistan has realized it cannot continue the conflict without risking severe consequences, including potential erasure from the global map. As a result, they are now showing readiness for a ceasefire.
Given the market's sensitive nature, we can expect a positive reaction to this news.
A strong gap-up opening is likely in the coming sessions.
Technically, the market has the potential to rally towards the 0.886 Fibonacci level, which corresponds to the 2400–2500 zone.
Traders should remain cautious but optimistic, and closely monitor key levels for confirmation of the trend.
#Nifty
BANK / USDT Long Trade Setup – Big Breakout Watch!🚀 BANK Breakout Alert – 100%+ Potential Incoming?! 👀🔥
Hey Traders! If you're all about high-conviction plays and real alpha, smash that 👍 and tap Follow for more setups that actually deliver! 💹💯
BSE:BANK has broken out of a massive symmetrical triangle on the 1H chart — signaling a potential continuation move after a long consolidation! ⚡📈
📌 Entry Zone: $0.0372 – $0.0390 (current breakout area)
🎯 Targets:
• Target 1 → $0.0450
• Target 2 → $0.0520
• Target 3 → $0.0600
Target 4 → $0.0720
Target 5 → $0.0820
🛡 Stop Loss (SL): $0.0350 (below breakout support)
🔑 Why this setup matters:
✅ Clean breakout after long consolidation
✅ Strong bullish volume on breakout
✅ Previous breakout gave +114% move!
⚠️ Always manage your risk — breakouts can retest!
💬 What’s your target on BSE:BANK ? Drop your thoughts below! 👇👇👇

Nasdaq Bank Index 2025 Edition — Let's Make Sh#t Great Again.President Donald Trump's aggressive tariff policies, we at @PandorraResearch Team characterize as a term "Tariff Bazooka", have significantly destabilized the Nasdaq Bank Index NASDAQ:BANK , reflecting broader financial sector vulnerabilities and investor anxiety.
These tariffs, including a 25% levy on imports from Canada and Mexico, a 20% duty on Chinese goods, and proposed reciprocal tariffs, — have triggered cascading multi effects on banking stocks through several paths.
Market Volatility and Investor Flight
The Nasdaq Bank Index, which tracks major U.S. financial institutions, has been disproportionately impacted by tariff-driven uncertainty:
Sharp Equity Declines. Since Trump announced reciprocal tariffs in February 2025, the Nasdaq Composite NASDAQ:IXIC dropped over 10% from its December 2024 peak, erasing $1 trillion in tech-sector value. Banking stocks, sensitive to macroeconomic shifts, mirrored this downturn as investors fled equities for safer assets.
Risk-Off Sentiment. Bonds rallied as tariffs sparked fears of stagflation—a combination of stagnant growth and rising inflation—prompting a 30-basis-point drop in 10-year Treasury yields. This flight to safety squeezed bank profitability, as narrower yield curves reduce net interest margins.
Economic Contagion Mechanisms
Interest Rate Pressures.
Tariffs have raised input costs for businesses, contributing to inflationary pressures. The Federal Reserve now faces a dilemma: tolerate higher inflation or hike rates to curb it. Either scenario harms banks. Elevated rates could suppress loan demand and increase default risks, while delayed rate cuts prolong financial tightening.
Trade Retaliation and Sectoral Risks.
Canada, Mexico, and China have retaliated with tariffs on $155 billion (Canada) and unspecified billions (China, Mexico) of U.S. goods. For banks, this raises exposure to sectors like agriculture, manufacturing, and automotive - industries heavily reliant on cross-border trade. Loan defaults could surge if protected industries fail to offset higher costs.
Global Financial System Strain.
Trump’s tariffs risk fragmenting the rules-based trading system, undermining the stability that banks depend on for international transactions. The EU and other regions may retaliate by restricting U.S. financial services, directly impacting revenue streams for Wall Street firms.
Sector-Specific Impacts
Tech-Finance Nexus. Many Nasdaq-listed banks have significant exposure to tech firms, which face disrupted supply chains due to tariffs on Chinese components. This dual pressure — higher operational costs for clients and reduced tech-sector valuations — weakens banks’ asset quality.
Consumer Credit Risks. Tariffs on everyday goods (e.g., 25% on Mexican produce, 10% on Canadian energy) could elevate household expenses, straining consumer creditworthiness and increasing delinquency rates for retail banks.
Projected Outcomes
Economists estimate Trump’s tariffs could reduce U.S. GDP growth by 1.5 percentage points in 2025, with a stagflationary shock amplifying equity sell-offs. For the Nasdaq Bank Index, this implies prolonged volatility, compressed earnings, and potential credit rating downgrades as macroeconomic headwinds intensify.
Technical challenge
The main technical graph of Nasdaq Bank Index NASDAQ:BANK indicates on further Bearish trend in development, since major supports (nearly 5-month flat bottom and 52-weeks SMA) have been recently broken.
Conclusion
In conclusion, Trump’s tariff strategy has acted as a destabilizing force for financial markets, with the Nasdaq Bank Index serving as a barometer for sector-wide risks. By exacerbating economic uncertainty, inflation, and trade fragmentation, these policies have eroded investor confidence and heightened systemic vulnerabilities in the banking sector.
--
Best 'sh#t hits the fan' wishes,
@PandorraResearch Team 😎

$SOFI is poised to reach the $20 range following its correctionNASDAQ:SOFI 's price began 2025 at $15.40. Today, it traded at $15.56, marking a 1% increase since the start of the year. The forecasted price for SoFi at the end of 2025 is $41.23, representing a year-over-year change of +168%. The expected rise from today to year-end is +165%.
By mid-2025, the price is projected to reach $20-$29.56.
Strong Growth Prospects: NASDAQ:SOFI has shown significant growth in revenue and profitability. The company reported a 35.8% year-over-year revenue growth and a 45% net profit margin in 20241.
Positive Market Trends: Analysts are optimistic about NASDAQ:SOFI 's future performance, with some projecting a 72% upside potential, targeting a $25 share price.
Diverse Financial Services: NASDAQ:SOFI offers a wide range of financial services, including lending, investing, and banking, which helps diversify its revenue streams and reduce risk.
Member Growth: The company has been experiencing robust member growth, which is a positive indicator of its expanding customer base and market reach.
Buy NASDAQ:SOFI now and let's get wealthy!

Swedbank Just Did Something It Hasn't Done in 18 Years!Hi all,
A few weeks ago, at the Estonian finance conference, I pointed out that Swedbank needs a Monthly candle close above a historically significant level to confirm further upside into "open waters".
Before I dive deeper - if someone still claims that "price has no history" or "price doesn't repeat itself," just show them Swedbank’s chart. Back in 2007, Swedbank attempted to break the 215–228 SEK level for the first time. The result? A complete failure. Sellers took control and smashed the price down.
Fast forward 7–10 years: “Let’s try again a few more times!” Still nothing. The level remained unbreakable, draining all momentum. Over the past 18 years, this zone has been tested 7–9 times, and every single attempt ended in failure.
Now, today, things are changed. Today, we have that Monthly close, and the price has now entered a potential buying zone. Technically, Swedbank is ready - optimal zone 215 to 237 SEK!
Do your homework; this is just my opinion and my analysis!
Do not forget to "Boost" the idea - all the best,
Vaido
