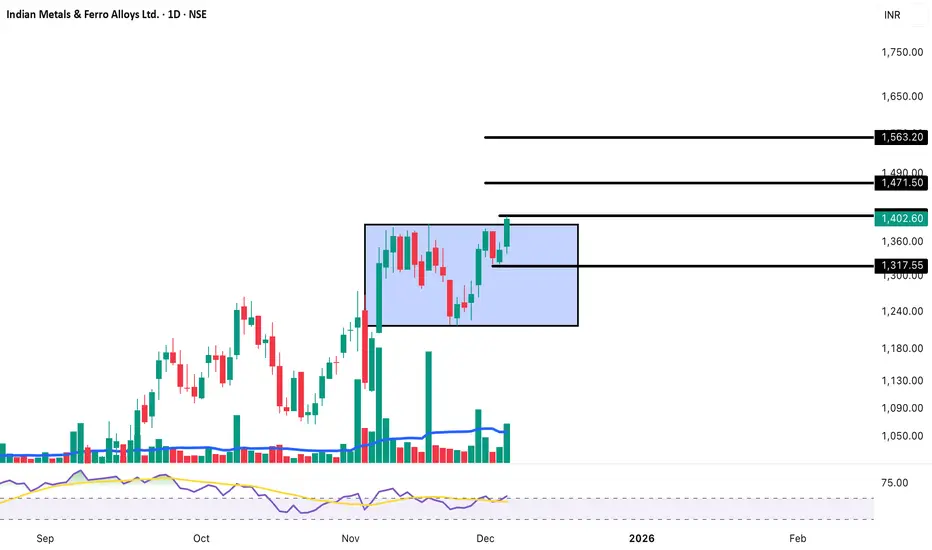
Indian Metals: +4% Surge Breaking Rectangle | Target 1,563-1,700Entry: ₹1,402-1,415 (Current Level)
Target 1: ₹1,471-1,490
Target 2: ₹1,563-1,580
Target 3: ₹1,650-1,700+ (Extended Breakout Target)
Stop Loss: ₹1,317
Disclaimer: For educational purposes only. Not SEBI registered.
Bankniftyprediction
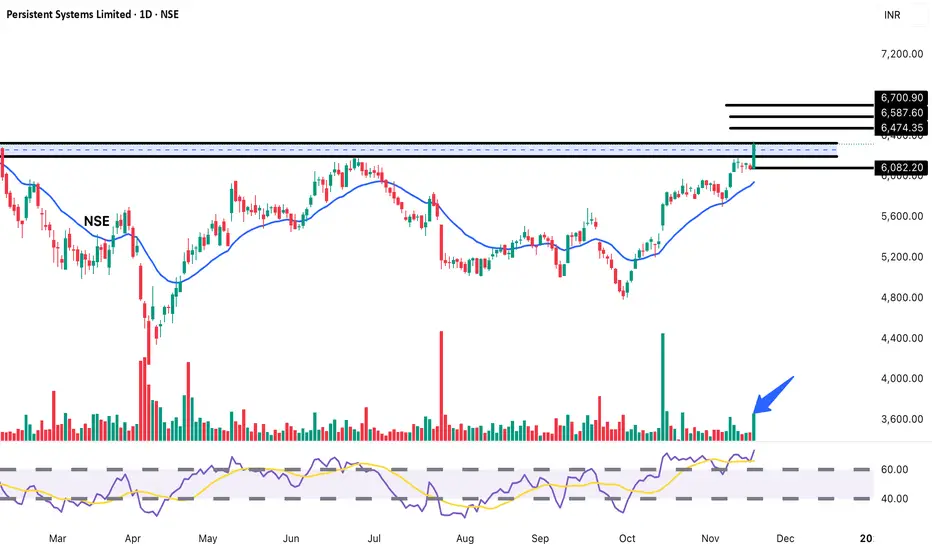
Persistent Systems: Explosive Breakout | Digital Transformation STRONG BUY Setup 💻
Entry: ₹6,316-6,340 (Current Level)
Target 1: ₹6,474-6,500
Target 2: ₹6,587-6,620
Target 3: ₹6,700-6,750
Target 4: ₹6,900-7,000+ (Extended Breakout Target)
Stop Loss: ₹6,082
Technical Rationale:
MASSIVE BREAKOUT from year-long resistance at 6,250 (horizontal black line at top)
Explosive +3.89% surge with exceptional volume spike (874.8K - highlighted with blue arrow)
Breaking above major resistance zone decisively on daily chart
Trading above long-term horizontal resistance after multiple tests throughout 2025
Volume is highest in months - institutional buying evident
Strong uptrend intact - trading above rising EMA (blue curve)
RSI around 65-70 - strong bullish momentum with room for upside
IT Services sector showing strength - digital transformation demand
Multiple resistance levels mapped: 6,474, 6,587, 6,700
Clear support established at breakout zone 6,250 and 6,082
Previous all-time high territory being challenged
Pattern shows consistent higher lows since October bottom
Risk-Reward: Excellent 1:2.5 to 1:4+ ratio depending on targets
Pattern: HORIZONTAL RESISTANCE BREAKOUT on DAILY Chart - breaking year-long ceiling with exceptional volume
Strategy: Medium-term swing to positional (weeks to months)
Book 20% at T1 (6,490), 20% at T2 (6,600), 20% at T3 (6,725)
Hold remaining 40% for extended target 6,900-7,000+
Trail SL to 6,320 after crossing T1
Disclaimer: For educational purposes only. Not SEBI registered.
SBI Life Insurance: Breaking 420-Day Consolidation BUY Setup 🛡️
Entry: ₹1,936-1,945 (Current Level)
Target 1: ₹1,984-1,990
Target 2: ₹2,019-2,030
Target 3: ₹2,056-2,075 (Extended)
Stop Loss: ₹1,910
Technical Rationale:
MAJOR BREAKOUT after 420 days of consolidation (highlighted in cyan)
Breaking above long-term resistance at 1,930 level with strong momentum
Weekly chart showing powerful +5.27% surge
Volume buildup visible (highlighted) - institutional accumulation
Price breaking above descending trendline from 2024 highs
Trading above both EMAs indicating strong bullish trend
Rounding bottom formation on weekly - classic bullish reversal
High volume (5.03M) confirming breakout authenticity
RSI trending upward with room for further upside
Insurance sector showing relative strength
Clear support base at 1,876-1,910 zone
Risk-Reward: Excellent 1:4+ ratio
Pattern: Multi-month base breakout + Rounding bottom - extremely reliable bullish setup on weekly timeframe
Strategy: Positional/long-term - Book 25% at T1 (1,990), 25% at T2 (2,025), trail remaining 50% with SL at 1,950 after T1 achieved
Key Levels:
Breakout Zone: 1,930-1,945 (critical resistance broken)
Strong Resistance: 1,984, 2,019, 2,056
Major Support: 1,910, 1,876
Major Catalyst:
420-day consolidation breakout = huge pent-up energy
Volume accumulation phase complete
Financial sector strength
Disclaimer: For educational purposes only. Not SEBI registered. 420-day base breakout is significant - these typically lead to sustained moves. Weekly chart for medium to long-term position. Manage risk appropriately and conduct thorough research before investing.

Based on our fundamental analysis of Monolithisch India Ltd.Recommendation: NEUTRAL / HOLD
Rationale:
The company's fundamentals are strong—demonstrating phenomenal growth, high profitability, and a lean balance sheet. However, the current stock price has already discounted a significant amount of this future growth. The valuation is very rich (P/E of ≈71.9x), which leaves little room for error or unexpected slowdowns.
For an existing investor, holding the stock is reasonable to capture the expected growth. For a new investor, we recommend a Neutral stance, suggesting it is best to wait for a better entry point (a pullback in price) that offers a more favorable risk-to-reward balance.
Price Target and Duration
Since the market is currently rewarding the exceptional growth with a high multiple, we anchor our near-term target to a slight premium on the current valuation based on sustained financial performance.
Target Price: ₹550
Target Duration: 12-15 Months (This is a long-term view that factors in the execution of the company's current expansion plans).

Hero Motocorp: Major Weekly Breakout | Auto Sector Leader
STRONG BUY Setup 🏍️
Entry: ₹5,798-5,820 (Current Level)
Target 1: ₹5,899-5,920
Target 2: ₹6,033-6,060
Target 3: ₹6,251-6,280
Target 4: ₹6,400-6,500+ (Extended Breakout Target)
Stop Loss: ₹5,588
Technical Rationale:
BREAKING OUT from year-long rectangle consolidation (5,588-5,899 range - blue shaded area)
Powerful +4.69% weekly surge showing strong bullish momentum
Testing upper boundary of rectangle at 5,899 (marked "3d 21h" - breakout imminent)
Weekly chart showing major pattern completion
Trading above descending channel (black trendlines) - channel broken
Volume at 1.77M - strong for weekly timeframe confirming breakout
RSI trending upward around 70-75 - strong momentum (overbought but in uptrend)
Trading well above rising EMA - bullish trend confirmed
Auto sector leader - largest two-wheeler manufacturer globally
Multiple resistance levels clearly marked: 5,899, 6,033, 6,251
Strong support established at 5,588 (rectangle base)
Previous consolidation for 12+ months = powerful breakout potential
Pattern similar to 2024 rally from 3,500 to 6,000+
Risk-Reward: Excellent 1:3 to 1:5+ ratio depending on targets
Pattern: RECTANGLE CONSOLIDATION BREAKOUT on WEEKLY Chart - extremely powerful continuation pattern after year-long base building
Strategy: Medium to long-term positional (weeks to months)
Book 20% at T1 (5,910), 20% at T2 (6,045), 20% at T3 (6,260)
Hold remaining 40% for extended target 6,400-6,500+
Trail SL to 5,820 after crossing T1
Disclaimer: For educational purposes only. Not SEBI registered.

Axis Bank: Falling Wedge Pattern | Wait for Breakout Above 1,26Entry: ₹1,241-1,250 (Current Level)
Target 1: ₹1,259-1,265
Target 2: ₹1,275-1,285 (Breakout Confirmation)
Target 3: ₹1,300-1,320+ (Extended if breaks channel)
Stop Loss: ₹1,222
Disclaimer: For educational purposes only. Not SEBI registered.

HCLTECH: Year-Long Trendline Breaking | IT Services Rally StartsSTRONG BUY Setup 💻
Entry: ₹1,662-1,675 (Current Level)
Target 1: ₹1,703-1,720
Target 2: ₹1,764-1,780
Target 3: ₹1,820-1,850
Target 4: ₹1,900-1,950+ (Extended - Trendline Breakout Target)
Stop Loss: ₹1,591Technical Rationale:
BREAKING ABOVE year-long descending trendline (marked "Trendline" in blue on chart)
Explosive +4.23% surge with exceptional volume spike (6.34M - highlighted as "Volume Spurt")
Daily chart showing decisive breakout from long-term resistance
Trading well above rising EMA (blue curve) - strong bullish reversal
Volume is highest in months (marked with blue arrow) - institutional buying confirmed
RSI trending strongly upward around 70-75 - powerful momentum
IT Services sector leader - one of India's top IT companies
Multiple resistance levels clearly mapped: 1,703, 1,764
Strong support established at breakout zone 1,591-1,600
Previous consolidation near 1,500-1,600 now acting as strong base
Pattern shows consistent recovery from October 2025 lows
Breaking above the descending channel that dominated 2025
Risk-Reward: Excellent 1:3 to 1:5+ ratio depending on targetsPattern: DESCENDING TRENDLINE BREAKOUT on DAILY Chart with massive volume confirmation - highly reliable bullish reversal setupStrategy: Short to medium-term swing/positional (weeks to months)
Book 20% at T1 (1,715), 20% at T2 (1,772), 20% at T3 (1,835)
Hold remaining 40% for extended target 1,900-1,950+
Trail SL to 1,675 after crossing T1
Disclaimer: For educational purposes only. Not SEBI registered.

GRM Overseas: Breaking 480 After 2 Years | Agri-Export LeaderSTRONG BUY Setup 🌾Entry: ₹494-500 (Current Level)
Target 1: ₹509-515
Target 2: ₹519-525
Target 3: ₹528-540
Target 4: ₹560-580+ (Extended Breakout Target)
Stop Loss: ₹480Technical Rationale:
EXPLOSIVE BREAKOUT from multi-year resistance at 480 (blue horizontal line at top)
Massive +2.83% surge on weekly chart with strong momentum
Breaking above 2-year consolidation/resistance zone (highlighted "1d 19h" in green)
Volume at 3.23M - strong for weekly timeframe confirming breakout
Weekly chart showing major pattern completion
Trading well above rising EMA (blue curve) - strong bullish trend
RSI trending upward around 70-75 - strong momentum
Basmati rice exporter - agri-commodity play with export potential
Multiple resistance levels clearly marked: 509, 519, 528
Clear support established at breakout zone 480
Strong recovery from 2023-2024 lows (~160) to current levels
Pattern shows consistent higher highs and higher lows since mid-2024
Breaking into new all-time high territory
Risk-Reward: Excellent 1:4 to 1:6+ ratio for extended targetsPattern: MULTI-YEAR HORIZONTAL RESISTANCE BREAKOUT on WEEKLY Chart - extremely powerful setup after 2+ years of consolidationStrategy: Medium to long-term positional/investment (weeks to months)
Book 20% at T1 (512), 20% at T2 (522), 20% at T3 (534)
Hold remaining 40% for extended target 560-580+
Trail SL to 500 after crossing T1
Disclaimer: For educational purposes only. Not SEBI registered.

Buy Cholamandalam Investment & Finance above 1707Buy above 1707.
Stop-loss: 1640.
Targets: 1745 / 1791.

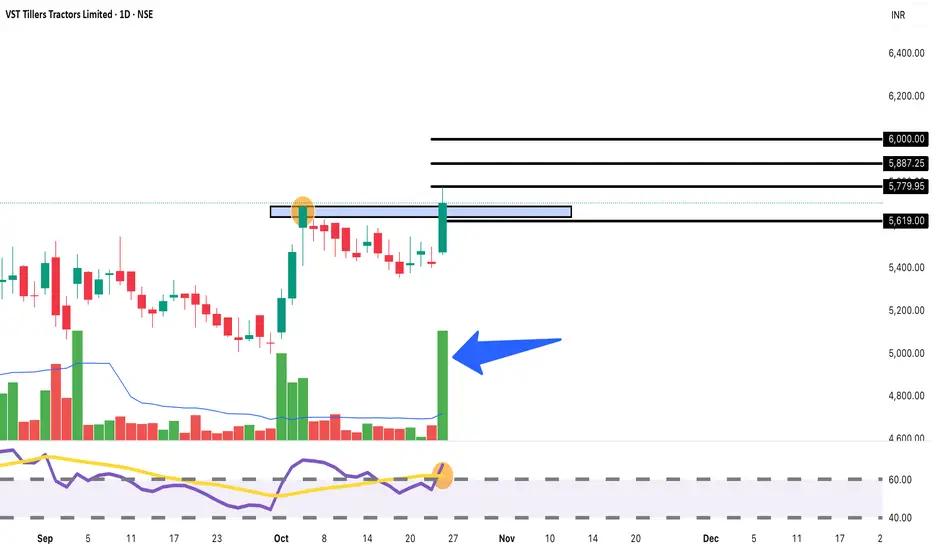
VST Tillers: Explosive Volume Breakout! Target 5,900+BUY Setup 🚜
Entry: ₹5,703-5,720 (Current Level)
Target 1: ₹5,779-5,800
Target 2: ₹5,887-5,900
Target 3: ₹6,000+ (Extended)
Stop Loss: ₹5,620
Technical Rationale:
Massive volume spike (8.71K) - highest in recent period, highlighted with blue arrow
Strong bullish momentum with +5.23% surge today
Breaking out from consolidation range (5,460-5,700)
Price moving above resistance zone marked at 5,700
Rounding bottom formation visible - classic bullish reversal
RSI around 65, showing strength with room for upside
Volume confirmation is exceptional - institutional buying evident
Agricultural/tractor sector showing renewed interest
Two major resistance levels clearly marked at 5,779 and 5,887
Support established at breakout zone (5,650-5,680)
Risk-Reward: Strong 1:3+ ratio
Pattern: Rounding bottom breakout with exceptional volume - highly reliable bullish signal
Strategy: Short to medium-term swing - Book 30% at T1 (5,790), 30% at T2 (5,890), trail remaining with SL at 5,720 after T1
Key Catalysts:
Volume explosion indicating smart money accumulation
Agricultural sector tailwinds
Festive season demand
Key Levels:
Strong Resistance: 5,779, 5,887
Support: 5,650, 5,620, 5,600
education purpose only
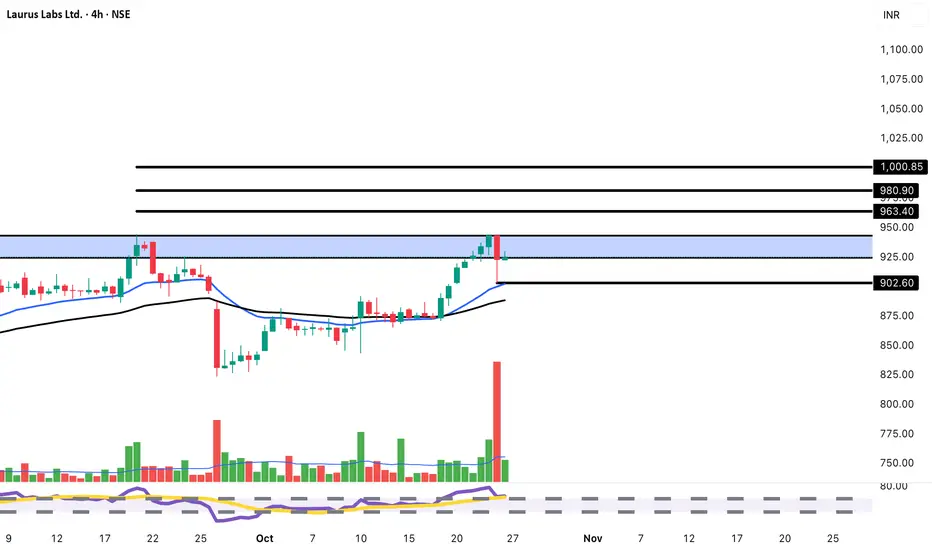
LAURUSLABS: 4H Chart Reversal | Target 980-1,000BUY Setup 💊
Entry: ₹924-930 (Current Level)
Target 1: ₹963-970
Target 2: ₹980-990
Target 3: ₹1,000+ (Extended)
Stop Loss: ₹902
Technical Rationale:
Breaking above key resistance at 925 level with momentum
Strong recovery from recent dip with +0.24% gain
4-hour chart showing bullish reversal pattern
Price reclaiming position above both EMAs
W-pattern (double bottom) formation visible - bullish reversal
RSI trending upward around 70, showing momentum
Volume at 1.35M supporting the breakout
Clear support established at 902 level
Multiple resistance levels: 950, 963, 980, 1,000
Pharma sector showing resilience
Breaking above previous high at 950 zone
Risk-Reward: Good 1:3+ ratio
Pattern: Double bottom/W-pattern breakout - classic bullish reversal on 4H timeframe
Strategy: Intraday to short-term swing - Book 35% at T1 (965), 35% at T2 (985), trail remaining with SL at 930 after T1
Key Levels:
Breakout Zone: 925 (now support)
Strong Resistance: 950, 963, 980, 1,000
Critical Support: 902, 875
For educational purposes only. Not SEBI registered. 4H chart analysis for short-term trades. Watch 902 support closely. Conduct your own research before investing.
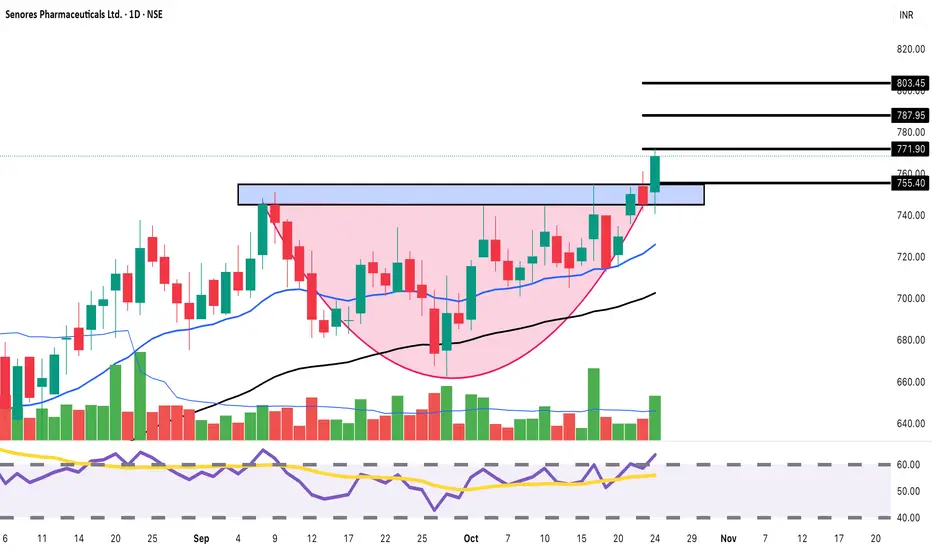
Senores Pharma: Cup & Handle Breakout! Target 803+BUY Setup 💊
Entry: ₹768-775 (Current Level)
Target 1: ₹787-795
Target 2: ₹803-810
Target 3: ₹830+ (Extended)
Stop Loss: ₹752
Technical Rationale:
Powerful breakout from rectangular consolidation (740-770)
Strong bullish momentum with +3.10% surge today
Breaking above resistance zone with conviction
Cup and Handle pattern visible - classic bullish continuation
Price breaking above descending trendline (pink shaded area)
Rising above both EMAs indicating trend reversal
High volume (378.97K) confirming breakout strength
RSI spiking above 60, showing momentum building
Clear support established at 755-760 level
Multiple resistance levels marked: 771, 787, 803
Ascending triangle formation breakout
Risk-Reward: Excellent 1:3+ ratio
Pattern: Cup & Handle + Ascending Triangle breakout - highly reliable bullish signals combined
Strategy: Short to medium-term swing - Book 30% at T1 (790), 35% at T2 (805), trail remaining with SL at 770 after T1
Key Levels:
Breakout Zone: 771 (now support)
Strong Resistance: 787, 803
Support: 755, 752, 740
Sector: Pharma sector showing strength amid market volatility
For educational purposes only. Not SEBI registered. Multiple bullish patterns converging - strong setup but manage risk. Conduct your own research before investing.Retry
Shipping Corporation of India Limited chart analysisBUY Setup ⚓
Entry: ₹250-252 (Current Level)
Target 1: ₹260-265
Target 2: ₹275-280
Target 3: ₹290+ (Extended)
Stop Loss: ₹242
Technical Rationale:
Explosive breakout with +7.93% surge on massive volume
Exceptional volume spike (38M) - highest in the chart period
Breaking out from consolidation range (225-240)
RSI spiking above 60, indicating strong bullish momentum
Price crossing above key resistance at 245-246 level
Gap-up opening showing strong institutional buying
Shipping sector momentum with global trade trends
Support established at breakout zone (245)
Risk-Reward: Strong 1:4+ ratio
Sector Catalyst: PSU shipping stocks showing strength, potential government policy support
Strategy: Momentum trade - Book 30% at T1 (260), 30% at T2 (275), trail SL to 255 after T1 achieved
Caution: High volatility expected - avoid overexposure. Watch for profit booking after sharp rally

Long (Bullish) – Continuation expected if price sustains Resistance Turned Support: ₹221
Next Target Zone: ₹250–₹275
Stop-loss: Below ₹201 (recent swing low and major moving average)


GMDC Breakout Setup: Buy Above 637Entry: Buy above 637 (recent resistance and Fibonacci breakout spot).
Target 1: 673 (Fibonacci 0.382 retracement).
Target 2: 703 (Fibonacci 0.5 retracement).
Target 3: 733 (Fibonacci 0.618 retracement).
Stoploss: 615 (below recent support and trendline).
Volume spike and RSI uptick signal momentum

Bullish Breakout – Monitor for follow-through Support: ₹500–₹570 (previous resistance)
Upside Targets: ₹650, ₹750
Stop-loss: Below ₹499

Rectangle breakout with strong volume buildup📈 Buy Above: ₹155
🎯 Target 1: ₹185
🎯 Target 2: ₹210
🛑 Stop Loss: ₹135
⚡Volume confirmation + breakout retest can give momentum move.

Buy Sundaram Finance Holdings Ltd. Buy ₹634
target of ₹720
stoploss at ₹570
based on current technical setup and breakout from consolidation zone.

Bullish Harmonic (Potential Bullish Bat/Alt Bat)Pattern: Bullish Harmonic (Potential Bullish Bat/Alt Bat)
Currently moving from C → D leg.
Breakout above point B (~₹185) confirmed with good volumes.
D zone projection near ₹240–260.
✅ Buy Zone: ₹185–195
🎯 Target 1: ₹220
🎯 Target 2: ₹250
🛑 Stop Loss: ₹170 (below recent swing low)
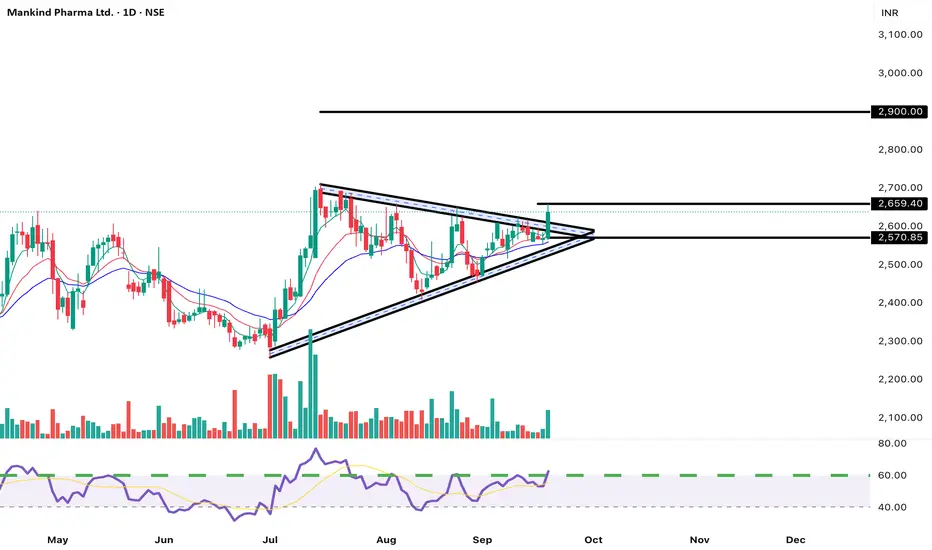
MANKIND PHARMA: Descending Triangle Breakout🎯 BUY
Entry at CMP
💰 TARGET
Calculated using the triangle's height: ₹2900
🛑 STOP-LOSS
Place just below the breakout point for risk management: ₹2555
Bullish Breakout on CAMS: Buy Opportunity Above TrendlineBuy: ₹4,015–₹4,020 (above breakout candle and 200 EMA)
Target: ₹4,270 (September 2025 price target with bullish technicals)
Stoploss: ₹3,940 (below 200 EMA and recent support)
Technical Highlights
CAMS has broken above a major descending trendline and the 200 EMA, signaling a bullish breakout.
RSI is 62, indicating momentum but still below overbought levels.
Volume confirms the breakout strength, with the price supported by analyst targets for September 2025 at ₹4,269.
