Indian Metals & Ferro Alloys Ltd.
No trades
No trades
Compare with Indian Metals & Ferro Alloys Ltd.
97.2 INR
4.24 B INR
28.04 B INR
14.33 M
Last report date
Aug 4, 2026
Report period
Q1 2026
EPS
40.00 INR
Revenue
9.60 B INR
Company info
Sector
Industry
CEO
Subhrakant Panda
Website
Headquarters
Bhubaneswar
Founded
1961
IPO date
Jul 22, 2010
ISIN
INE919H01018
FIGI
BBG000QL2RQ4
Identifiers
ISIN INE919H01018
Indian Metals & Ferro Alloys Ltd. engages in the production of ferro alloys. Its manufacturing cycle comprising of chrome ore mining, power generation and Ferro alloys smelting. The firm operates through the following segments: Ferro Alloys, Power, Mining, and All Other segments. The company was founded by Banshidhar Panda and Ila Panda on November 20, 1961 and is headquartered in Bhubaneswar, India.
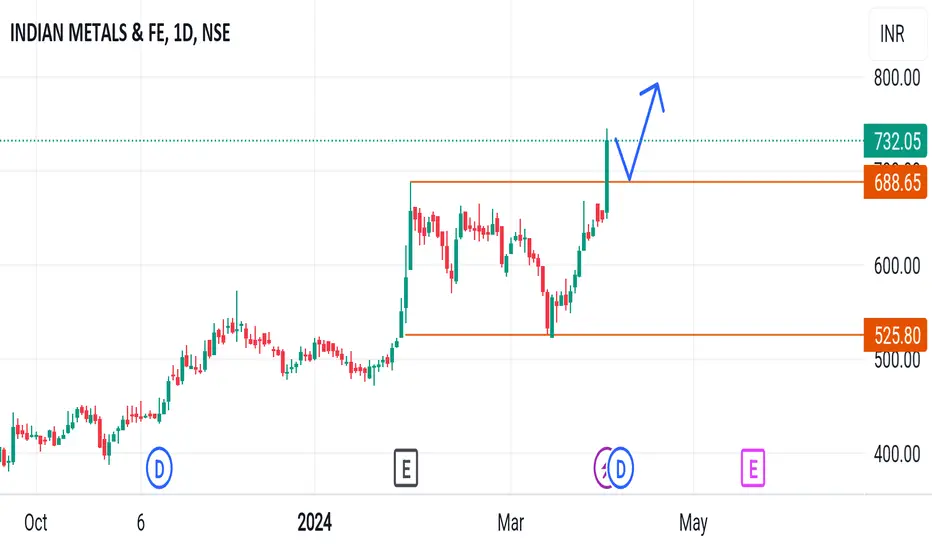
Amazing breakout on WEEKLY Timeframe - IMFACheckout an amazing breakout happened in the stock in Weekly timeframe, macroscopically seen in Daily timeframe. Having a great favor that the stock might be bullish expecting a staggering returns of minimum 25% TGT. IMPORTANT BREAKOUT LEVELS ARE ALWAYS RESPECTED!
NOTE for learners: Place the break
FOR SWING TRADEIMFA (Indian Metals & Ferro Alloys Ltd)
1DAY TF
BUYING ENTRY-930-9365
SL- 850
TG-950-970-980++
(FUNDAMENTALLY GOOD STOCK)
Indian Metals and Ferro Alloys Limited (IMFA) is a leading, fully integrated producer of Ferro Chrome in India which is primarily used in the production of stainless steel. It
INDIAN METALS & FERRO S/RSupport and Resistance Levels:
Support Levels: These are price points (green line/shade) where a downward trend may be halted due to a concentration of buying interest. Imagine them as a safety net where buyers step in, preventing further decline.
Resistance Levels: Conversely, resistance levels (re
Right angled descending broadening wedge patternIMFA formed a right angled descending broadening wedge pattern. This is a bullish pattern with bullish breakout happened three sessions earlier. Price inched higher than the breakout candle high today forming an ideal entry today with stop loss just below breakout candle low. There was high volume d
See all ideas
Summarizing what the indicators are suggesting.
Neutral
SellBuy
Strong sellStrong buy
Strong sellSellNeutralBuyStrong buy
Neutral
SellBuy
Strong sellStrong buy
Strong sellSellNeutralBuyStrong buy
Neutral
SellBuy
Strong sellStrong buy
Strong sellSellNeutralBuyStrong buy
An aggregate view of professional's ratings.
Neutral
SellBuy
Strong sellStrong buy
Strong sellSellNeutralBuyStrong buy
Neutral
SellBuy
Strong sellStrong buy
Strong sellSellNeutralBuyStrong buy
Neutral
SellBuy
Strong sellStrong buy
Strong sellSellNeutralBuyStrong buy
Displays a symbol's price movements over previous years to identify recurring trends.
Frequently asked questions
The current price of IMFA is 1,398.7 INR — it has decreased by −2.06% in the past 24 hours. Watch Indian Metals & Ferro Alloys Ltd. stock price performance more closely on the chart.
Depending on the exchange, the stock ticker may vary. For instance, on NSE exchange Indian Metals & Ferro Alloys Ltd. stocks are traded under the ticker IMFA.
IMFA stock has fallen by −6.80% compared to the previous week, the month change is a −1.44% fall, over the last year Indian Metals & Ferro Alloys Ltd. has showed a 74.11% increase.
We've gathered analysts' opinions on Indian Metals & Ferro Alloys Ltd. future price: according to them, IMFA price has a max estimate of 1,996.00 INR and a min estimate of 1,860.00 INR. Watch IMFA chart and read a more detailed Indian Metals & Ferro Alloys Ltd. stock forecast: see what analysts think of Indian Metals & Ferro Alloys Ltd. and suggest that you do with its stocks.
IMFA reached its all-time high on Apr 29, 2026 with the price of 1,679.9 INR, and its all-time low was 46.0 INR and was reached on Mar 25, 2020. View more price dynamics on IMFA chart.
See other stocks reaching their highest and lowest prices.
IMFA stock is 3.30% volatile and has beta coefficient of 1.64. Track Indian Metals & Ferro Alloys Ltd. stock price on the chart and check out the list of the most volatile stocks — is Indian Metals & Ferro Alloys Ltd. there?
Today Indian Metals & Ferro Alloys Ltd. has the market capitalization of 75.82 B, it has decreased by −1.80% over the last week.
Yes, you can track Indian Metals & Ferro Alloys Ltd. financials in yearly and quarterly reports right on TradingView.
Indian Metals & Ferro Alloys Ltd. is going to release the next earnings report on Nov 5, 2026. Keep track of upcoming events with our Earnings Calendar.
IMFA net income for the last quarter is 1.92 B INR, while the quarter before that showed 1.03 B INR of net income which accounts for 0.00% change. Track more Indian Metals & Ferro Alloys Ltd. financial stats to get the full picture.
Yes, IMFA dividends are paid semi-annually. The last dividend per share was 7.50 INR. As of today, Dividend Yield (TTM)% is 0.89%. Tracking Indian Metals & Ferro Alloys Ltd. dividends might help you take more informed decisions.
Indian Metals & Ferro Alloys Ltd. dividend yield was 1.04% in 2025, and payout ratio reached 15.90%. The year before the numbers were 3.28% and 28.49% correspondingly. See high-dividend stocks and find more opportunities for your portfolio.
As of Aug 17, 2026, the company has 7.39 K employees. See our rating of the largest employees — is Indian Metals & Ferro Alloys Ltd. on this list?
EBITDA measures a company's operating performance, its growth signifies an improvement in the efficiency of a company. Indian Metals & Ferro Alloys Ltd. EBITDA is 7.83 B INR, and current EBITDA margin is 22.74%. See more stats in Indian Metals & Ferro Alloys Ltd. financial statements.
Like other stocks, IMFA shares are traded on stock exchanges, e.g. Nasdaq, Nyse, Euronext, and the easiest way to buy them is through an online stock broker. To do this, you need to open an account and follow a broker's procedures, then start trading. You can trade Indian Metals & Ferro Alloys Ltd. stock right from TradingView charts — choose your broker and connect to your account.
Investing in stocks requires a comprehensive research: you should carefully study all the available data, e.g. company's financials, related news, and its technical analysis. So Indian Metals & Ferro Alloys Ltd. technincal analysis shows the sell today, and its 1 week rating is buy. Since market conditions are prone to changes, it's worth looking a bit further into the future — according to the 1 month rating Indian Metals & Ferro Alloys Ltd. stock shows the buy signal. See more of Indian Metals & Ferro Alloys Ltd. technicals for a more comprehensive analysis.