TRX/USDT pumping is near?Hi Dears
Do you heard about WOW TRADE strategy?
We have a higher time frame trendline line (weekly). We are near the demand in control zone of higher timeframe. We break the trendline and after that we have a pullback to the trendline, base that cause this breaking or break even zone.
After that the price will be in the moon.
And now we are watching this strategy for trx usdt.
I hope it works properly.
Sincerely
Hosein Poursaei
BASE

WSC - WillScot Mobile Mini HoldingsSimple base breakout accompanied by a surge in volume, albeit not a massive surge. Would like to see continued volume surges to get a cushion to allow for a hold thru earnings on 2/21.
Great growth numbers, earnings & sales accelerating at a strong pace on a YoY & QoQ basis.

BROS - Dutch Bros Inc.One of the longer-term plays I am watching. IPO'd back in 2021, they don't have much in the way of current earnings, but analyst estimates are expecting big growth over the next couple of years.
Starting to inch its way up the right side of a possible stage 1 base on good volume. Don't need to rush into buying this one - need to let it show me that it is in fact ready to go. As of now, it's still in a downtrend regardless of the constructive action since the start of the year.

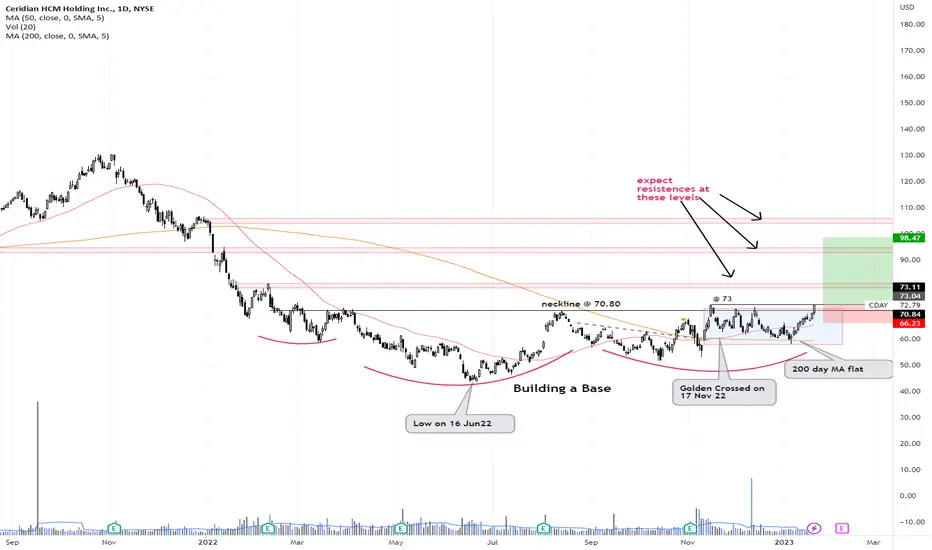
CDAY - on the verge of trending up?CDAY had been basing since hitting low on 16 June 2022 (7 months now). It formed a Golden Cross on 17Nov 2022 (2 months+ ago) but continued to trade flip flopped within a sideway range while it's 200 day moving average began to flatten out.
With it's 200 day MA having shifted from a downtrend to a flat line, the odds have increased for start of a sustainable up trend in the near future esp when it can start trading above it's last recent hi @ 73.
Let see!
Disclaimer: Just my 2 cents and not a trade advice. Kindly do your own due diligence and trade according to your own risk tolerance and don't forget that money management is important! Take care and Good Luck!
SUPPLY STRUCTURE PATTERENS !!!!!!!Hello, everybody! If you like the concept, don't forget to like and follow it.
In this pattern, the market would accumulate sell orders in the supply zone and turn bearish.
Please show your support for me by liking and following my ideas.
Also, let us know what you think in the comment section.


AGCO : several ways 5 and 10 candle pocket pivotAlways wait for a correction after price broke the 100 and 200ema but also make sure theres a base to work from AND pocket pivot occur (5 candle or 10 candle pocket pivot).
I always prefer to enter a trade before the breakout happen but sometimes pocket pivot won't occur until a breakout happen.

Buying before the breakout : Pocket PivotABC is a company with good accelarated Earnings and good margins. The company is identified as tradeable via fundamental analysis/funadmental screening.
Now whats left is when to get it.
I wait for the price to break the 100-200 ema ribbon and make some kind of base/price structure around the area and see if there is a pocket pivot around/inside the base. Preferably before a breakout of the base (if a breakout candle coincide with a pocket pivot, thats okay too)

Flat base breakout - PolycabA good set up in the making. Almost after a year of consolidation price is trying to move out of the range which can open the doors of higher range.
P.S - Very small stop loss
P.S - Views are personal and for education purpose only.

After three bases stock tend to give up gains - with exampleAfter three bases, stock tends to give up gains - for example
Stage analysis is key for stock investing.
Learn how to count the base correctly, and you will save

CLH broke out baseCLH broke out 9 month base. Not to late to get in. Leding stock now. IBD 50 member.

IMGN - ImmunoGen, Inc.Setup - simple base breakout after a solid 70% move off the lows followed by 5 weeks of consolidation. Earnings during consolidation were below expectation. However, after a slight selloff, shares were gobbled back up and volatility was squeezed out right below the breakout level. Half size because the broad market is running a bit hot and could be due for a pullback relatively soon.

Healthcare leader $PRGO making a shark pattern Perrigo is in the Medical-Generic Drugs Group, they develop, manufactures, markets, and distributes private label self-care products, including cough, cold, and allergy products, analgesics, gastrointestinal products, smoking cessation products, infant formula and food products.
IBD gives it a #1 rank in its industry.
PRGO made its major low in May while XLV made it in late June. That's very good relative strength. Now, after the price broke above its 200-day MA, its been forming a base giving a good opportunity to buy.
The price is making shark pattern with a pivot buy at $43.01. I'll leave a STOP BUY at that level.

Potential base on bitcoin??The Society of Technical Analysts' next course starts in October. Those wishing to learn more about technical analysis can take a look at the Route to Diploma - Society of Technical Analysts, www.technicalanalysts.com
Disclaimer:
The information posted on Trading View is for informative purposes and is not intended to constitute advice in any form, including but not limited to investment, accounting, tax, legal or regulatory advice. The information therefore has no regard to the specific investment objectives, financial situation or particular needs of any specific recipient. Opinions expressed are our current opinions as of the date appearing on Trading View only. All illustrations, forecasts or hypothetical data are for illustrative purposes only. The Society of Technical Analysts Ltd does not make representation that the information provided is appropriate for use in all jurisdictions or by all Investors or other potential Investors. Parties are therefore responsible for compliance with applicable local laws and regulations. The Society of Technical Analysts will not be held liable for any loss or damage resulting directly or indirectly from the use of any information on this site.

woousdtAfter breaking the daily base with an ERC candle
We can expect to climb to a higher base after pullback

Rare PUMP pattern. Look for a "Base" on BTC🚀Every trader want to catch the pumps because only in this situation you can get the highest RR. In this educational idea we will talk about pattern which help you to identify upcoming pumps. It`s a base pattern.
"Base" is consolidation pattern which is forming at the market bottom and a part of famous cup and handle pattern. "Base" is acually a copy of cup and it`s lead to PUMP✅when the price break up this pattern.
📊 Why base is important for the long traders❓ Because there is a lot of whales have enough liquidity to accumulate their position. The big volume bars at the bottom are also confirmed that whales buy ADA at the "dip"!
📊 Why the formation of the base leads to PUMP❓ As i said the base is the consolidation pattern where the big players can accumulate enough✅liquidity from scared retail traders.
🔥In the most cases the base forming at the market bottom when the biggest part of traders think that crypto continue to DUMP and sell their crypto at loss or at breakeven. But who buys this huge amount of crypto? Of course this is someone who don`t scare - the big players.
🔥Additionally, the price "compresses like a spring" in consolidation range and when the crypto break up the base the "spring uncompresses" and PUMP begin.
📊 What indicator helps to identify the base and upcoming PUMPS❓ This is a basic volume indicator. The volume growth helps you to identify the bottom. A lot of crypto sells by retail traders and the volume bars grows.
📊 What timeframes should you use to have beggiest winrate (80-90%)❓ The higher the timeframe the better, especially for beginners:
1️⃣ 4h
2️⃣ 1d
3️⃣ 1w
🚩 You need to have experience and complete scalping studying to identify PUMPS at lower timeframes (5m, 15m, 1h).
Look for the "base" on the higher timeframes then move to lower timeframes to have clear understanding of this pattern and find the best entry point. I use the trandline breakout to open a long before the pump. Maybe, you will share your tools to open a long before a pump?
🚩 Traders, do we have the base on BTC now❓ Are retail traders scared and think that BTC will fall lower? Let`s discuss it in the comment!
💻Friends, press the "like"👍 button, write comments and share with your friends - it will be the best THANK YOU.
P.S. Personally, I open an entry if the price shows it according to my strategy.
Always do your analysis before making a trade.

COCO - BaseI draw your attention to the big base at COCO.
This stock is deserving of getting on your list.
Here you just have to watch for when momentum shows up and then act!

Long-term View for EthereumETH is currently attempting to distribute into a bottom.
Looking at history as a guide, I found that it broke out massively into a pennant after basing during its 2015-2016 time period. After consolidating from 2016-2017, it broke out once again- rallying a whopping 23,000% in a year. Notice that this major breakout occurred when the price found support right at the 2015-2016 base's prior resistance.
Fast forward to today, I find that we're in a technically similar situation. We've witnessed a sizeable basing period from 2018-2021 with a breakout that proceeded into a pennant currently being constructed. I believe we'll bottom entirely when we touch the 2018-2021 base's initial resistance, showing the completed pennant (around $1500).
It just so happens that the merge to ETH 2.0 is rumored to occur during August, right where I assume the completion of the pennant will occur. GLTA!

USDCHF 2hAt the moment, this symbol seems to be in a good position for a buy position. what do you think?

Civintas $CIVI, innovation is not always creating thingsCivintas Resources Inc. is in the Oil & Gas Sector, centered in the Exploration and Production Industry. It should benefit from the current uptrend of oil prices NYMEX:CL1! .
I mentioned innovation because the company is set to "clean up dozens of wells orphaned by others". The state of Colorado has granted this new startegy for NYSE:CIVI to "work hand in hand with landowners and local communities to restore former well sites". This may because of their strategy to protect Colorado’s groundwater resources.
They perform Horizontal Drilling but before, they install multiple layers of cement and steel casing and then performs pressure tests on the well casings. This is a good story funds might see to buy this stock.
Today the price emerge with a strong breakout from a flat base. The base has a 11.48 points of height, TA rules state that the target price after the breakout is to add that up the base, that is at $70.63.
The breakout from today has a gain of 7%, that is far from the pivot so I won't chase it. Also the volume isn't that great. So, as I didn't buy yesterday, I'll wait for a throwback to the previous resistance line and buy there. If it doesn't happens, I'll wait for another opportunity.

RTX - Raytheon TechnologiesRecent breakout, pulling back in an orderly fashion to the 20-day line, exhibiting relative strength to the market indexes as they continue to falter.
Look for a bounce off of the 20-day line that clears Tuesday's (2/22/2022) high with a stop loss just under Tuesday's low.

EURUSD WATERFALL DO NOT MISS IT!! 🚣♂️ Hi Traders
Please see our breakdown on EURUSD.
Throughout last week we see a fairly sizable rally across the board for all EURO currency pairs.
We can clearly see we have reached a level that has acted as a major supply zone previously and we expect to see the same again.
Price is clearly still creating our base to gather enough volume to pull price lower.
There is two ways we can set our selves up for this trade.
a) We can look to get in after a confirmed break of the base and a retest of the base on lower time frames. (1hr / 15 minutes)
b) We can play it really safe and wait on the ascending trend line breaking and witnessing some further bearish momentum to confirm our bias.
Please let me know in the comments below what you think of this analysis I'd love to hear all and any feedback!!
Please have a safe and profitable week in the markets.
The Fx Chartist

MLPL Goes to its Base!!MLPL will meet its base at point 232-212. this is crucial base to make new base reversal or still on bearish path
