$HRMY$HRMY is a relatively new company in the biotech space and has held up incredibly well since it's IPO in 2020, forming a nice 2 year base. Price is currently sat just under $54 above which are clear skies. The weekly chart shows an up/down ratio of over 2, suggesting significant institutional accumulation
Basebreakout

$RCMT looks good for a long position$RCMT this had a great day yesterday, reclaiming all key daily moving averages as well as the 10 week moving average. Good room to hit ATHs over $24.13 ($24.02 could also work with volume)

$AIR forming a base$AIR has been consolidating nicely around the 200ma and closed just above a previous breakout area level with nice volume. This is definitely worth keeping an eye on as it could move quickly back up to $50, giving it a nice risk/reward ratio

Is $CAL ready to push higher?Notes:
* Strong up trend
* Great earnings
* Breaking out of a ~13 month base with higher than average volume
* Forming a bull flag
Technicals:
Sector: Consumer Cyclical - Footwear & Accessories
Relative Strength vs. Sector: 2.2
Relative Strength vs. SP500: 3.32
U/D Ratio: 1.52
Base Depth: 56.68%
Distance from breakout buy point: 2.22%
Volume 45.81% above its 15 day avg.
Trade Idea:
* You can enter now as the price is just breaking out of the $27.92 resistance area
* Or you can wait for a break above the bull flag
* Or if you want a better entry you can look to enter around the 27.8 area
* This stock usually has local tops when the price closes around 25.12% above its 50 EMA
* Consider selling into strength if the price closes 24.92% to 25.32% (or higher) above its 50 EMA
* The last closing price is 11.57% away from its 50 EMA
* Historical resistance comes around 29.85 and above that around 33.6
* Be on the lookout around 29.85

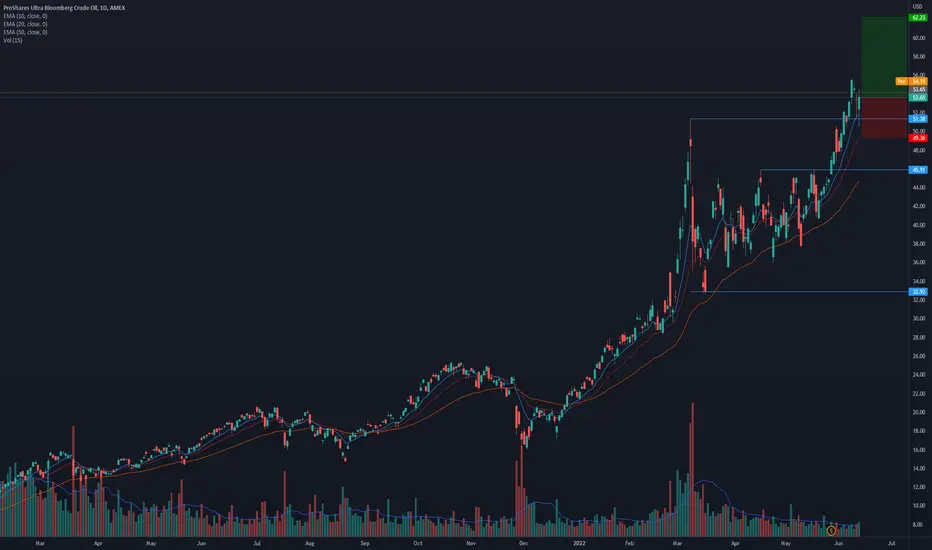
$UCO ready to go higher after retesting broken resistance?Notes:
* Strong up trend due to macro situations
* Printed a Pocket Pivot as it bounced off of broken resistance
* Looks good on multiple time frames
Technicals:
Sector: Exchange Traded Fund
Relative Strength vs. Sector: 3.02
Relative Strength vs. SP500: 4.05
U/D Ratio: 1.62
Base Depth: 56.08%
Distance from breakout buy point: 4.42%
Volume 37.69% above its 15 day avg.
Trade Idea:
* You can enter now as the price just bounced off of the broken resistance with higher than average volume
* If you're looking for a better entry you look to buy around the $52.20 area
* Manage risk accordingly
$RXST looking to head higher?Notes:
* Coming up on the right side of its base
* Volume increasing with price
* Two levels of resistance at which we can take partial profits.
Technicals:
Ticker: $RXST
Sector: Healthcare - Medical Devices
Relative Strength vs. Sector: 25.97
Relative Strength vs. SP500: 8.57
U/D Ratio: 1.7
Base Depth: 82.72%
Distance from breakout buy point: 1.65%
Volume -8.06% below its 15 day avg.

BABA: Bottom's in, now what?The bottom formation is confirmed with rising Accumulation/Distribution and a nice, controlled base at the low. This is evidence of a Dark Pool Buy Zone, aka accumulation zone, where bargain hunting has occurred.
But a bottom formation is a sideways pattern first, before it becomes a sustained uptrend. Resistance overhead is strong, so swing traders should be planning their exit strategies at this time, to get out soon profitably if you took the trade as it moved out of the base. Position traders will have stronger entries with lower risk when bottoms breakout to "complete."
We have a market that is range-bound for most stocks, most of the time, which can be a difficult market for KEEPING profits.
Bottoms provide some of the most lucrative trades, but it's important to follow a set of rules according to your intent for the trade, to get the best results. You can learn more about this at my website.

$WCC ready to go higher?Notes:
* Great earnings in the recent quarters
* Strong up trend in the long run
* Price has been increasing along with volume
* Breaking out of a ~7 month base with higher than average volume
* Also breaking out with a pocket pivot
Technicals:
Ticker: $WCC
Sector: Industrials - Industrial Distribution
Relative Strength vs. Sector: 86.62
Relative Strength vs. SP500: 54.48
U/D Ratio: 1.05
Base Depth: 31.68%
Distance from breakout buy point: 2.1%
Volume 64.84% above its 15 day avg.
Trade Idea:
* You can enter now as the price just broke out of the base and is still close
* If you're looking for a better entry you can look for one around the $139.2 area as that should serve as short term support
* Manage risk accordingly

$ASH ready to move higher?Notes:
* Great earnings track record
* Very strong up trend
* Pays out dividends
* Breaking out of a ~7 month base with higher than average volume along with printing a pocket pivot
Technicals:
* Sector: Basic Materials - Chemicals
* Relative Strength vs. Sector: 4.49
* Relative Strength vs. SP500: 6.32
* U/D Ratio: 1.38
* Base Depth: 29.41%
* Distance from breakout buy point: 0.42%
* Volume 205.16% above its 15 day avg.
Trade Idea:
* You can enter now as the price is just breaking out with high volume
* If you're looking for a better entry you can look for one around the $108.63 area
* Manage risk accordingly

$MUSA breaking a ~5week base. Can it move higher?* Very strong up trend since inception
* Great earnings in the recent quarters
* Breaking out of a ~5week base
* Pays out increasing dividends
* Has lots of accumulation indicated by the U/D Ratio
Technicals:
Sector: Consumer Cyclical - Specialty Retail
RS vs. Sector: 2.7
RS vs. SP500: 6.71
U/D Ratio: 1.66
Distance from breakout buy point: 0.17%
Volume 9.58% above its 15 day avg.
Trade Idea:
* You can enter now as the price is just above the broken resistance
* If you're looking for a better entry you can look to buy around the $245.9 area as that should serve as a short term support

$AVD breaking out of its ~14 month base * Broke its historical resistance of $23.55 which dates back to 2006 with tonnes of volume behind the move
Technicals:
* Sector: Basic Materials - Agricultural Inputs
* Relative Strength vs. Sector: 52.33
* Relative Strength vs. SP500: 8.92
* U/D Ratio: 1.61
* Base Depth: 71.26%
* Distance from breakout buy point: 2.35%
* Volume 196.27% above its 15 day avg.
Trade Idea:
* You can enter now as the price is really close to the broken resistance of $24.25
* If you're looking for a better entry you can look to enter around the $23.85 area or even a retest of $23.55 seems likely.
* A retest of this area ($23.55 to $23.85) would indicate that buyers are willing to push the price higher.
* Next historical resistance comes in around $27.9

$BPT breaking out of a one month base!* Strong recent up trend
* Breaking out of a one month base
* Pays dividends
* Price looks good on all time frames.
Technicals:
* Sector: Energy - Oil & Gas Refining & Marketing
* Relative Strength vs. Sector: 2.07
* Relative Strength vs. SP500: 6.83
* U/D Ratio: 1.25
* Base Depth: 32.41%
* Distance from breakout buy point: 1.92%
* Volume 14.33% above its 15 day avg.
Trade Idea:
* You can enter at yesterdays closing price as it's close to the broken resistance.
* If you're looking for a better entry you might be able to catch a bid around the $17 area
* Target for the trade is a historical level of resistance around the $19.2 area
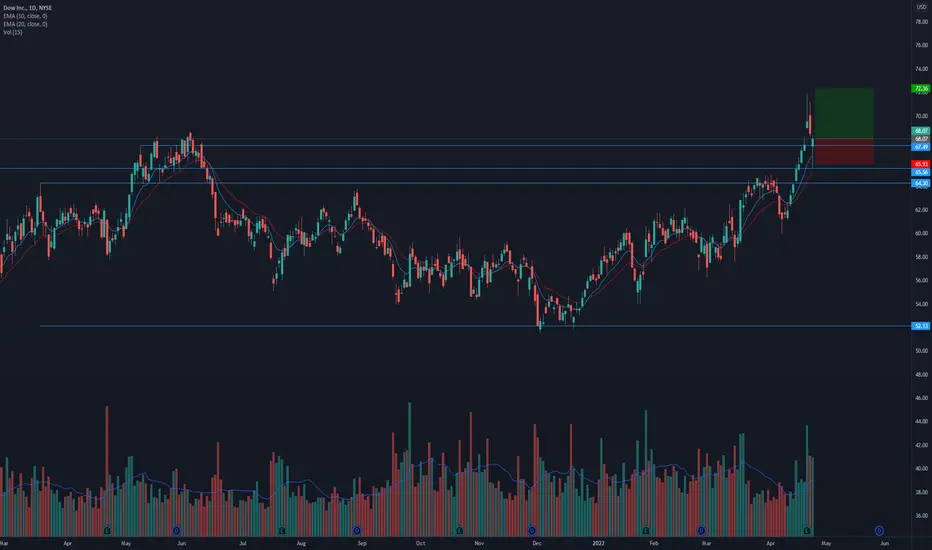
$DOW breaking out of a ~13 month base. Can it go higher?Notes/Thoughts:
* Great earnings record
* Strong up trend
* Breaking out of a ~13 month base with higher than average volume
* Recently used historical highs of $65.56 as support
* Last bullish hammer indicating tonnes of demand below $67.49
* Extremely close to the broken resistance of $67.49 offering a great risk/reward
Technicals:
* Sector: Basic Materials - Chemicals
* Relative Strength vs. Sector: 9.19
* Relative Strength vs. SP500: 8.08
* U/D Ratio: 1.2
* Base Depth: 29.46%
* Distance from breakout buy point: 0.86%
* Volume 46.06% above its 15 day average.
Trade Idea:
* You can enter now as the price is really close to the broken base resistance
* Manage risk accordingly
* If you're looking for a slightly better entry you may wait for the price to pull back to $67.49
* Due to the nature of this choppy market I've reduced my stop and targets accordingly.
$VIST ready to push higher?Notes/Thoughts:
* Strong up trend in the recent years
* Okay earnings with growth expectation
* Closed just above resistance of $9.07
* During the consolidation from March 23, 2022 the volume was decreasing; now it's increasing and back above the average
* A high Relative Strength along with the high UD Ratio shows this may be ready to move higher.
Technicals:
* Sector: Energy - Oil & Gas E&P
* Relative Strength vs. Sector: 1.79
* Relative Strength vs. SP500: 11.04
* U/D Ratio: 1.68
* Base Depth: 21.26%
* Distance from breakout buy point: 0.11%
* Volume 6.71% above its 15 day average.
Trade Idea:
* You can enter now as the price is just above the broken resistance
* The entry now is providing a good risk/reward ratio
* Manage risk according to your tolerance

$EW breaking out of a ~8month base!Notes:
* Good earnings record
* Very strong up trend on the monthly
* Breaking out of a ~8 month base for the second time
* Has been ranging tightly for the past few weeks between $123.27 and $119.94
Technicals:
* Sector: Healthcare - Medical Devices
* Relative Strength vs. Sector: 1.2
* Relative Strength vs. SP500: 3.88
* U/D Ratio: 1.13
* Base Depth: 20.9%
* Distance from breakout buy point: 1.01%
* Volume 18.81% above its 15 day avg.
Trade Idea:
* You can enter now as the price is still very close to the breakout point
* If you're looking for a slightly better entry you can wait for an opportunity around $123.27 or 119.94
* Manage risk accordingly

$GGB breaking out of a ~11month base!Notes:
* Great earnings in the recent quarters
* Strong up trend in the recent years
* Breaking out of a ~11 month cup shaped base with higher than average volume
* During the recent pull back the volume was decreasing indicating bullishness.
Technicals:
* Sector: Basic Materials - Steel
* Relative Strength vs. Sector: 7.19
* Relative Strength vs. SP500: 13.71
* U/D Ratio: 0.8
* Base Depth: 56.93%
* Distance from breakout buy point: 0.31%
* Volume 14.02% above its 15 day avg.
Trade Idea:
* You can enter now as the price is just breaking out of the base
* Manage risk accordingly

$PLD breaking out of a cup with handle!Notes:
* Excellent earnings
* Very strong up trend in the longer time frames
* Breaking out of a ~5month cup with handle pattern with higher than average volume
Technicals:
* Sector: Real Estate - REIT - Industrial
* Relative Strength vs. Sector: 2.29
* Relative Strength vs. SP500: 7.54
* U/D Ratio: 0.96
* Base Depth: 20.72%
* Distance from breakout buy point: 0.3%
* Volume 34.89% above its 15 day avg.
Trade Idea:
* You can enter now as the price is just breaking out with higher than average volume and good earnings report.
* If you're looking for a slightly better entry you can wait for an opportunity around the $168 area

$SBLK ready to push higher after printing a Pocket Pivot?Notes/Thoughts:
* Broke out of $29.87 once again this time with tonnes of volume and a printed a pocket pivot!
* With increased hedge fund activity it makes sense to get in now
* Has the relative strength and the UD Volume indicating that it's ready to move higher
Technicals:
* Sector: Industrials - Marine Shipping
* Relative Strength vs. Sector: 11.25
* Relative Strength vs. SP500: 10.98
* U/D Ratio: 1.24
* Base Depth: 21.77%
* Distance from breakout buy point: 1.98%
* Volume 106.73% above its 15 day avg.
Trade Idea
* The idea here is to play the pocket pivot.
* The pocket pivot seems to be valid as it's emerging from the 10/20 EMAs
* This seems like a good entry as it broke out from $29.87 with tonnes of volume and we can expect it to continue higher
* Managing risk tightly as I don't want to lose more than 4% on this trade
* If you're looking for a better entry you can look for an opportunity around the $29.87 area and manage risk accordingly

$NVO giving another entry opportunity before moving higher?* Good earnings
* Very strong up trend in the long term
* Broke out of a ~4month base and now retested it as support
* Sector: Healthcare - Drug Manufacturers - General
* Relative Strength vs. Sector: 8.35
* Relative Strength vs. SP500: 2.56
* U/D Ratio: 2.21
* Base Depth: 26.05%
* Distance from breakout buy point: 1.01%
* Volume 145.18% above its 15 day average.
Trade Idea:
* Given the amount of volume that came in around $116.55, it seems like there's quite a bit of demand for this stock around this price.
* You can look to enter now as the price is very close to the broken base
* The U/D ratio indicates that the stock's under accumulation
* If you're looking for a better entry you can look to enter around $115.16

US Stock In Play: $CRC$CRC - almost 75% Institutional ownership in this O&G name to its float. coincidentally, the current 7 months base pattern is met with positive Up/Down Volume ratio at 1.3 reflecting, high possibility of fund accumulation during the phase.
clean pivot at $47 for BO

$HSIC looking to make the next leg higher!Notes:
* Solid earnings in the recent quarters
* Strong up trend in the long term
* Broke out of a base on base pattern
* Initially created a base of ~9 months, broke out and created a smaller base of ~4 week and is now breaking out again
* The ~9 month base was just above historical highs of $73.19 setting it as support
* Making new all-time-highs
* For the past 3 weeks it has been testing $87.55 as a new level of support with the volume drying up indicating that buyers and sellers are agreeing on this price
Technicals:
* Sector: Healthcare - Medical Distribution
* Relative Strength vs. Sector: 2.11
* Relative Strength vs. SP500: 5.05
* U/D Ratio: 1.79
* Base Depth: ~19.68%
* Distance from breakout buy point: 2.25%
* Volume 1.04% above its 15 day avg.
Trade Idea:
* You can look to enter now as the price is still pretty close to the broken level of $87.55
* Manage risk under $87.55
* If you're looking for a better entry you can look to buy around $88.72.

$IMXI is one to keep a close eye on as it builds a pivot.Technicals:
* Very good earnings quarter over quarter
* Steady up trend and seems to be starting a new leg higher
* Sector: Technology - Information Technology Services
* Relative Strength vs. Sector: 4.17
* Relative Strength vs. SP500: 7.42
* U/D Ratio: 1.45
* Base Depth: 27.85%
* Distance from breakout buy point: 12.87%
* Volume -24.65% below its 15 day avg
What to look for:
* Broke out of an 18 month base with tonnes of volume
* Is now building a smaller base after a ~41% move
* Consolidating price action with decreasing volume indicates that sellers are running out of steam
* Look for a break/close above $21.8 with volume.

$PKG ready to push higher?* Great earnings
* Strong up trend
* Breaking out of a 13 month base and retested it as support
* Sector: Consumer Cyclical - Packaging & Containers
* Relative Strength vs. Sector: 1.38
* Relative Strength vs. SP500: 3.17
* U/D Ratio: 1.28
* Base Depth: 21.42%
* Distance from breakout buy point: 1.9%
* Volume 14.3% above its 15 day average
