EUR/USD SELLERS WILL DOMINATE THE MARKET|SHORT
Hello, Friends!
We are targeting the 1.155 level area with our short trade on EUR/USD which is based on the fact that the pair is overbought on the BB band scale and is also approaching a resistance line above thus going us a good entry option.
Disclosure: I am part of Trade Nation's Influencer program and receive a monthly fee for using their TradingView charts in my analysis.
✅LIKE AND COMMENT MY IDEAS✅
Bearish Patterns

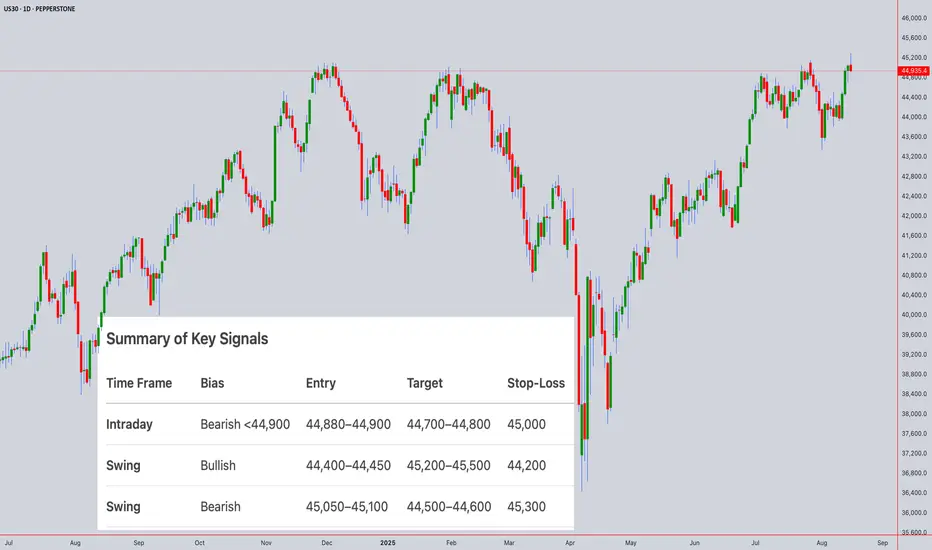
Technical Analysis for US30 (Dow Jones) Closing Price: 44,935.4 (16th Aug 2025, 12:50 PM UTC+4)
Analysis Methods: Japanese Candlesticks, Harmonic Patterns (ABCD, M/W), Elliott Wave, Wyckoff, Gann Theory (Time/Square of 9/Angles), Ichimoku, RSI, Bollinger Bands, VWAP, Moving Averages (MA/EMA/SMA/WMA).
1. Long-Term Trend (Weekly/Monthly)
Elliott Wave:
US30 is in Wave 5 of a bull cycle (Wave 3 peak: 45,500, Wave 4 correction to 42,800).
Target: 46,200–46,800 (1.618 extension of Wave 1).
Gann Price Forecasting:
Square of 9: √44,935.4 ≈ 212.00 →
Key resistance: 213² = 45,369, 214² = 45,796
Critical support: 211² = 44,521, 210² = 44,100
Break above 45,369 targets 46,000 (psychological level).
Ichimoku (Monthly):
Tenkan (9): 43,800 > Kijun (26): 43,200 → Bullish crossover.
Price above thick Senkou Span (42,500–43,000) – structural bullishness.
Moving Averages:
Weekly EMA(100): 43,000 (major trend support).
Swing Outlook: Bullish. Wave 5 targets 46,200–46,800.
2. Medium-Term Swing (4H/Daily)
Harmonic Patterns:
Bearish ABCD on Daily:
A: 45,200 → B: 44,300 → C: 44,900 → D: 45,050–45,150 (1.272 BC extension).
Bullish Crab (W Pattern) near 44,400 (0.886 XA retracement).
Wyckoff Phase:
Distribution above 44,900:
Upthrust rejection at 45,000 (16th Aug) on fading volume.
Weakness in rallies above 44,950.
Gann Theory:
Time Window: Aug 19–22 (Square of 9 reversal cluster).
Gann Angle: 1x1 support at 44,800 (45° angle from Aug 14 low).
Price-Time Squaring: 44,935 aligns with Aug 16 – consolidation expected.
Indicators:
RSI(14) + Bollinger Bands (Daily):
RSI: 65 (neutral-bullish, no divergence).
Price testing upper BB(20,2) at 45,050 → band expansion signals volatility.
VWAP (Weekly): 44,600 (swing support).
Swing Trade Setup:
Short near 45,050–45,150 → Target 44,500. Stop-loss: 45,300.
Long near 44,400 → Target 45,500. Stop-loss: 44,200.
3. Intraday Outlook (5M–4H)
Key Levels:
Resistance: 45,000 (psychological), 45,100 (Gann 1x1), 45,200 (ABCD target).
Support: 44,850 (VWAP), 44,750 (Ichimoku cloud), 44,600 (200-EMA).
Indicators:
Ichimoku (1H):
Tenkan: 44,920, Kijun: 44,860 → Price above both (short-term bullish).
Cloud: Bullish (44,780–44,840) – intraday support zone.
RSI + Bollinger Bands (4H):
RSI(14): 61 (neutral).
Price near mid-BB(20,2) at 44,900 → break below signals bearish momentum.
VWAP + MAs:
VWAP: 44,880 (intraday pivot).
EMA(20): 44,940 (resistance).
Candlestick Patterns:
4H Shooting Star at 45,000 → Bearish reversal signal.
1H Bearish Harami below 44,950 → Confirms selling pressure.
Gann Intraday Squaring:
Time Cycle: 14:00–16:00 UTC+4 (NY open) for volatility surge.
Price Harmony: Close below 44,900 targets 44,800 → 44,700.
Intraday Trade Plan:
Sell below 44,900 → Target 44,800 (VWAP) → 44,700 (Gann support).
Buy above 45,050 only if RSI <65 → Target 45,150.
Stop-Loss: 40–50 points.
Summary of Key Signals
Time Frame Bias Entry Target Stop-Loss
Intraday Bearish <44,900 44,880–44,900 44,700–44,800 45,000
Swing Bullish 44,400–44,450 45,200–45,500 44,200
Swing Bearish 45,050–45,100 44,500–44,600 45,300
Critical Events:
Gann Reversal Window: Aug 19–22 (watch for Fed minutes/retail data).
Daily Close >45,200 invalidates bearish patterns and targets 45,796.
Risk Note: US30 is sensitive to Dow components’ earnings and USD moves. Use tight stops during NY session.
For those interested in further developing their trading skills based on these types of analyses, consider exploring the mentoring program offered by Shunya dot Trade.(world wide web shunya dot trade)
I welcome your feedback on this analysis, as it will inform and enhance my future work.
Regards,
Shunya.Trade
world wide web shunya dot trade
⚠️ Disclaimer: This post is educational content and does not constitute investment advice, financial advice, or trading recommendations. The views expressed here are based on technical analysis and are shared solely for informational purposes. The stock market is subject to risks, including capital loss, and readers should exercise due diligence before investing. We do not take responsibility for decisions made based on this content. Consult a certified financial advisor for personalized guidance.
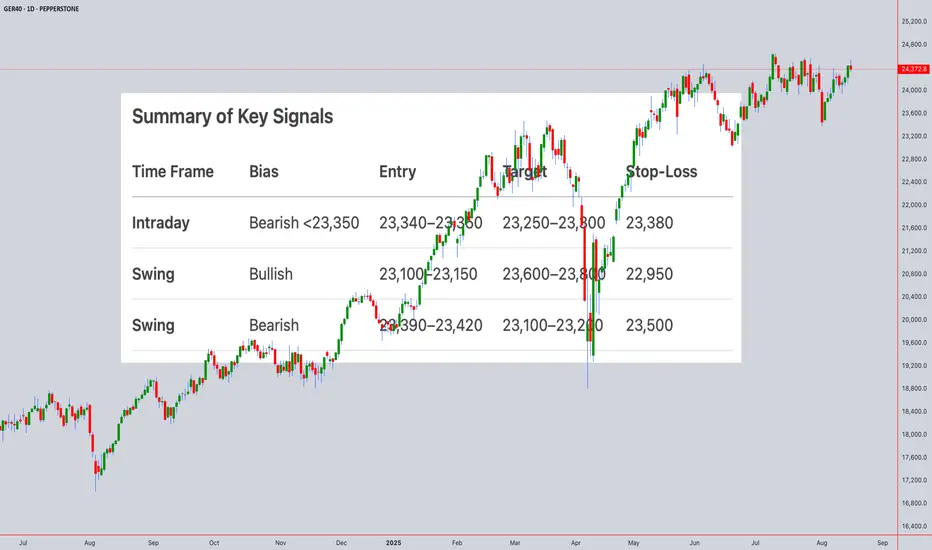
Technical Analysis for GER40 (DAX) Closing Price: 23,372.80 (15th Aug 2025, 11:50 PM UTC+4)
Analysis Methods: Japanese Candlesticks, Harmonic Patterns (ABCD, M/W), Elliott Wave, Wyckoff, Gann Theory (Time/Square of 9/Angles), Ichimoku, RSI, Bollinger Bands, VWAP, Moving Averages (MA/EMA/SMA/WMA).
---------------------------------------------------------------------------------------------
1. Long-Term Trend (Weekly/Monthly)
Elliott Wave:
GER40 is likely in Wave 3 of a broader bull cycle (Wave 1 peak: 22,800, Wave 2 dip to 21,500).
Wave 3 Target: 24,000–24,500 (1.618 extension of Wave 1).
Gann Price Forecasting:
Square of 9: √23,372.80 ≈ 152.90 →
Resistance: 153² = 23,409 (immediate), 154² = 23,716 (swing target).
Support: 152² = 23,104 (daily pivot), 151² = 22,801 (Wyckoff accumulation zone).
Ichimoku (Monthly):
Tenkan/Kijun: Bullish (Tenkan: 22,900 > Kijun: 22,400).
Cloud: Price above thick Senkou Span (22,000–22,500) – structural bullishness.
Moving Averages:
Weekly SMA(100): 22,200 (major support).
Swing Outlook: Bullish. Wave 3 rally targets 24,000–24,500.
2. Medium-Term Swing (4H/Daily)
Harmonic Patterns:
Bearish ABCD on Daily:
A: 23,800 → B: 23,100 → C: 23,550 → D: 23,380–23,420 (1.272 BC extension).
Bullish Crab (W Pattern) forming near 23,100 (0.886 XA retracement).
Wyckoff Phase:
Testing at 23,400:
Upthrust rejection at 23,450 (15th Aug) on low volume.
Spring potential near 23,100 (accumulation signal).
Gann Theory:
Time Window: Aug 18–20 (Square of 9 date cluster) for breakout/reversal.
Price-Time Squaring: 23,372 aligns with Aug 15 – consolidation expected.
Gann Angle: 1x1 angle at 23,300 – close below accelerates selling.
Indicators:
RSI(14) + Bollinger Bands (Daily):
RSI: 64 (neutral, no divergence).
Price testing upper BB(20,2) at 23,450 – expansion hints at volatility.
VWAP (Weekly): 23,250 (swing support).
Swing Trade Setup:
Short near 23,400 (ABCD target) → Target 23,100. Stop-loss: 23,500.
Long near 23,100 (Crab + Gann 151² support) → Target 23,800. Stop-loss: 22,950.
3. Intraday Outlook (5M–4H)
Key Levels:
Resistance: 23,400 (Gann 1x1), 23,450 (weekly high).
Support: 23,300 (VWAP), 23,200 (Ichimoku cloud), 23,100 (psychological).
Indicators:
Ichimoku (1H):
Tenkan: 23,360, Kijun: 23,330 → Price above both (short-term bullish).
Cloud: Bullish (23,280–23,320) – strong support zone.
RSI + Bollinger Bands (4H):
RSI(14): 58 (neutral).
Price near mid-BB(20,2): 23,350 – break below signals bearish momentum.
VWAP + MAs:
VWAP: 23,340 (intraday pivot).
EMA(50): 23,310 (dynamic support).
Candlestick Patterns:
4H Shooting Star at 23,450 (15th Aug) → Bearish reversal confirmed.
1H Bearish Engulfing below 23,380 – adds downside pressure.
Gann Intraday Squaring:
Time Cycle: 8:00–10:00 AM CET (European open) for volatility.
Price Harmony: Close below 23,350 targets 23,300 → 23,250.
Intraday Trade Plan:
Sell below 23,350 → Target 23,300 (VWAP) → 23,250 (Ichimoku cloud).
Buy above 23,400 only with RSI <60 → Target 23,450.
Stop-Loss: 25–30 points risk.
Summary of Key Signals
Time Frame Bias Entry Target Stop-Loss
Intraday Bearish <23,350 23,340–23,350 23,250–23,300 23,380
Swing Bullish 23,100–23,150 23,600–23,800 22,950
Swing Bearish 23,390–23,420 23,100–23,200 23,500
Critical Events Ahead:
Gann Reversal Window: Aug 18–20 (watch for Eurozone CPI/GDP data).
Daily Close >23,450 invalidates bearish ABCD and targets 23,716.
Risk Note: GER40 is sensitive to EU political/energy risks. Use tight stops during news events.
Disclaimer: Technical analysis is probabilistic and based on historical patterns. Fundamental drivers (e.g., ECB policy, German industrial data) may override technical signals. Always use risk management.
For those interested in further developing their trading skills based on these types of analyses, consider exploring the mentoring program offered by Shunya dot Trade . (world wide web shunya dot trade)
I welcome your feedback on this analysis, as it will inform and enhance my future work.
Regards,
Shunya.Trade
world wide web shunya dot trade
⚠️ Disclaimer: This post is educational content and does not constitute investment advice, financial advice, or trading recommendations. The views expressed here are based on technical analysis and are shared solely for informational purposes. The stock market is subject to risks, including capital loss, and readers should exercise due diligence before investing. We do not take responsibility for decisions made based on this content. Consult a certified financial advisor for personalized guidance.
Technical Analysis for XAUUSD (Gold) Closing Price: $3335.94 (16th Aug 2025, 2:05 AM UTC+4)
Analysis Methods: Japanese Candlesticks, Harmonic Patterns (ABCD, M/W), Elliott Wave, Wyckoff, Gann Theory (Time/Square of 9/Angles), Ichimoku, RSI, Bollinger Bands, VWAP, Moving Averages (MA/EMA/SMA/WMA).
1. Long-Term Trend (Weekly/Monthly)
Elliott Wave:
Gold is likely in Wave 5 of a broader bull cycle (Wave 3 peak at $3200, Wave 4 dip to $2950).
Target: $3450–$3500 if Wave 5 extends.
Gann Price Forecasting:
Square of 9:
√3335.94 ≈ 57.76 → Key resistance at 58² = $3364, support at 57² = $3249.
Break above $3364 opens path to $3400 (psychological level).
Ichimoku (Weekly):
Tenkan/Kijun: Bullish crossover (Tenkan > Kijun).
Cloud: Price above Senkou Span (bullish).
Moving Averages:
Weekly EMA(50): $3200 (strong support).
Swing Outlook: Bullish. Hold longs with trailing stops. Target $3450–$3500.
2. Medium-Term Swing (4H/Daily)
Harmonic Patterns:
ABCD Bearish pattern forming on 4H:
A: $3300 → B: $3350 → C: $3325 → D: $3360–$3370 (potential reversal zone).
Bullish Gartley (M Pattern) on daily chart near $3300 support.
Wyckoff Phase:
Distribution signs above $3330:
Upthrust (false breakout) at $3340 (16th Aug).
Volume fading near highs.
Gann Time Forecasting:
Aug 20–22 (geometric time window) for potential trend reversal.
RSI + Bollinger Bands (Daily):
RSI(14): 68 (approaching overbought).
Price hugging upper BB(20,2), suggesting consolidation.
Swing Trade Setup:
Short near $3360–$3370 (ABCD target) with stop-loss at $3385.
Long near $3300 (Gartley support) with stop-loss at $3280.
3. Intraday Outlook (5M–1H)
Key Levels:
Resistance: $3345 (Gann 1x1 angle), $3360 (Square of 9).
Support: $3320 (VWAP), $3300 (psychological).
Indicators:
Ichimoku (1H):
Tenkan: $3330, Kijun: $3320 → Price above both (short-term bullish).
Cloud: Thin and bullish (no major barriers until $3340).
RSI + Bollinger Bands (1H):
RSI(14): 62 (neutral).
Price testing mid-BB ($3330) → Break below signals pullback.
VWAP + MAs:
VWAP: $3325 (intraday support).
EMA(20): $3332 (dynamic support).
Candlestick Patterns:
16th Aug 4H Candle: Shooting star at $3340 → Bearish reversal signal.
1H Chart: Bearish engulfing below $3335.
Gann Squaring of Price-Time:
Time Cycle: 10:00–11:00 AM UTC+4 (volatility spike).
Price Harmony: $3335 = pivot → Close below $3330 targets $3315.
Intraday Trade Plan:
Sell below $3330 (target $3320 → $3310).
Buy above $3340 (target $3350) if RSI <70.
Stop-Loss: $15–$20 from entry.
Critical Events Ahead:
Gann Reversal Window: Aug 20–22 (watch for profit-taking).
Daily Close above $3350 invalidates bearish ABCD pattern.
Risk Note: Monitor USD strength and Fed policy hints. Use tight stops intraday.
For those interested in further developing their trading skills based on these types of analyses, consider exploring the mentoring program offered by Shunya dot Trade. (world wide web shunya dot trade)
I welcome your feedback on this analysis, as it will inform and enhance my future work.
Regards,
Shunya.Trade
world wide web shunya dot trade
⚠️ Disclaimer: This post is educational content and does not constitute investment advice, financial advice, or trading recommendations. The views expressed here are based on technical analysis and are shared solely for informational purposes. The stock market is subject to risks, including capital loss, and readers should exercise due diligence before investing. We do not take responsibility for decisions made based on this content. Consult a certified financial advisor for personalized guidance.

GBPCAD - Bulls in Control, But Supply Zone Ahead🏹 GBPCAD has been climbing within a steep bullish channel , approaching a key supply zone around 1.8750. As long as the channel holds, buyers remain in control.
However, if price rejects this supply area and breaks below the 1.8670 support, the bears could take over, potentially triggering a deeper correction.
📌Price is now at a decisive point — a breakout above supply could open the door for fresh highs, while a rejection and channel break could mark the start of a bearish phase.
⚖️ Bulls need a clean break above supply for further upside, while bears are eyeing a channel break for a reversal.
📚 Always follow your trading plan regarding entry, risk management, and trade management.
Good luck!
All Strategies Are Good; If Managed Properly!
~Richard Nasr
Disclosure: I am part of Trade Nation's Influencer program and receive a monthly fee for using their TradingView charts in my analysis.

Bitcoin to 85K TargetRising Wedge speaks for itself
Never properly backtested the 84-86K area breakout.
Every pullback has been front runned and never properly hit any fibs on each pullback. Typical rising wedge behavior.
Bearish divergences on the Daily and almost all time frames. Get rekt bulls.
DXY Is Still Bearish; Final Leg Of The Wedge Pattern?DXY Is Still Bearish, but it can be trading in final leg of ending diagonal a.k.a. wedge pattern from technical and Elliott wave perspective.
US Dollar Index – DXY made only a three-wave rise from the lows, which indicates for a correction within downtrend. So recovery can basically still be a fourth wave rally, just a bit deeper one that can still belong to an ending diagonal a.k.a. wedge pattern. Final wave “v” of 5 can be still missing, so be aware of a continuation lower within a new three-wave abc decline, especially if breaks below the lower side of the corrective channel near 97.70 level.
GBP/JPY BEARS ARE STRONG HERE|SHORT
Hello, Friends!
GBP/JPY pair is trading in a local downtrend which know by looking at the previous 1W candle which is red. On the 1D timeframe the pair is going up. The pair is overbought because the price is close to the upper band of the BB indicator. So we are looking to sell the pair with the upper BB line acting as resistance. The next target is 195.254 area.
Disclosure: I am part of Trade Nation's Influencer program and receive a monthly fee for using their TradingView charts in my analysis.
✅LIKE AND COMMENT MY IDEAS✅

GBP/AUD BEARS WILL DOMINATE THE MARKET|SHORT
GBP/AUD SIGNAL
Trade Direction: short
Entry Level: 2.069
Target Level: 2.057
Stop Loss: 2.078
RISK PROFILE
Risk level: medium
Suggested risk: 1%
Timeframe: 6h
Disclosure: I am part of Trade Nation's Influencer program and receive a monthly fee for using their TradingView charts in my analysis.
✅LIKE AND COMMENT MY IDEAS✅

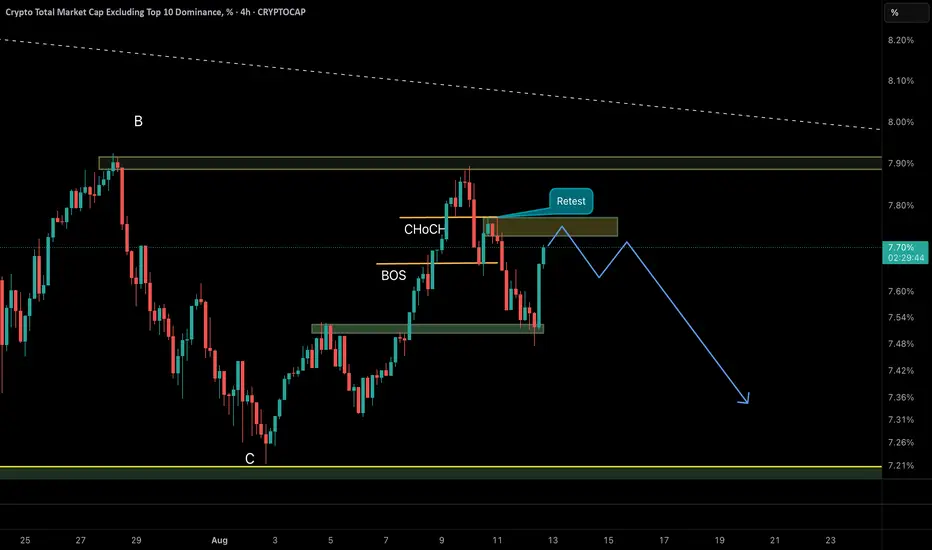
AltCoin Dominance bearish set up After Change of Character and Brake of Structure the altcoin dominance is going to retest the supply zone as shown in graph .
we are waiting to rejection from this zone and another bearish wave
EURJPY Is Very Bearish! Short!
Here is our detailed technical review for EURJPY.
Time Frame: 1D
Current Trend: Bearish
Sentiment: Overbought (based on 7-period RSI)
Forecast: Bearish
The market is on a crucial zone of supply 172.334.
The above-mentioned technicals clearly indicate the dominance of sellers on the market. I recommend shorting the instrument, aiming at 169.030 level.
P.S
We determine oversold/overbought condition with RSI indicator.
When it drops below 30 - the market is considered to be oversold.
When it bounces above 70 - the market is considered to be overbought.
Disclosure: I am part of Trade Nation's Influencer program and receive a monthly fee for using their TradingView charts in my analysis.
Like and subscribe and comment my ideas if you enjoy them!

EUR/NZD BEARISH BIAS RIGHT NOW| SHORT
EURNZD SIGNAL
Trade Direction: short
Entry Level: 1.961
Target Level: 1.929
Stop Loss: 1.982
RISK PROFILE
Risk level: medium
Suggested risk: 1%
Timeframe: 1D
Disclosure: I am part of Trade Nation's Influencer program and receive a monthly fee for using their TradingView charts in my analysis.
✅LIKE AND COMMENT MY IDEAS✅

EUR/AUD BEST PLACE TO SELL FROM|SHORT
Hello, Friends!
It makes sense for us to go short on EUR/AUD right now from the resistance line above with the target of 1.780 because of the confluence of the two strong factors which are the general downtrend on the previous 1W candle and the overbought situation on the lower TF determined by it’s proximity to the upper BB band.
Disclosure: I am part of Trade Nation's Influencer program and receive a monthly fee for using their TradingView charts in my analysis.
✅LIKE AND COMMENT MY IDEAS✅

EUR/CAD BEARS ARE STRONG HERE|SHORT
Hello, Friends!
Previous week’s green candle means that for us the EUR/CAD pair is in the uptrend. And the current movement leg was also up but the resistance line will be hit soon and upper BB band proximity will signal an overbought condition so we will go for a counter-trend short trade with the target being at 1.598.
Disclosure: I am part of Trade Nation's Influencer program and receive a monthly fee for using their TradingView charts in my analysis.
✅LIKE AND COMMENT MY IDEAS✅

USOIL: Eyes on 64.10 as Geopolitics Take Center Stage!!In today’s session, we’re watching USOIL for a potential short setup around the 64.10 zone. Price action remains in a broader downtrend, with the current move looking like a corrective retracement into a key support turned resistance area.
From a fundamental perspective, all eyes are on the scheduled August 15 meeting between Donald Trump and Vladimir Putin. A ceasefire agreement could fuel bearish momentum, potentially accelerating the sell-off. On the other hand, if talks collapse, renewed geopolitical tension could keep oil prices bid in the short term.
Technically, 64.10 is the battleground a decisive rejection here could offer an attractive risk reward for sellers aligned with the dominant trend.

BTC Dominance Breakdown – Altseason 2025 Loading? The BTC Dominance chart is flashing a familiar pattern we last saw before the explosive 2021 Altseason — and history might be about to rhyme. Let’s break it down:
BTC Dominance has once again tapped the same multi-year resistance trendline (red line).
Price has been riding a rising wedge since early 2022 — a pattern that typically resolves to the downside.
Last week, dominance rejected from the resistance zone and broke below wedge support.
Key Technicals:
Resistance Trendline: Serving as a multi-year ceiling since 2019.
Support Trendline: Rising wedge support now broken, opening the door for a deeper decline.
Current Level: 60.81% — sitting right below the breakdown zone.
What This Means for the Market:
If dominance continues to fall, altcoins could see significant capital inflows.
A sustained drop could trigger an Altseason 2.0, with high-beta alts outperforming BTC.
Watch for BTC to consolidate or move sideways — this typically accelerates altcoin gains.
Confirmation & Invalidations:
✅ Bullish for alts if:
Dominance closes weekly candles below 60%.
Momentum builds to retest lower dominance support levels (50%-55%).
❌ Invalidation:
A reclaim of wedge support + breakout above 67% would kill the altseason narrative in the short term.
📌 Conclusion:
BTC Dominance is at a critical turning point. History suggests we could be on the verge of a powerful altcoin cycle if the breakdown sustains.
Patience and positioning are key — the biggest alt rallies start when most traders are still skeptical.
💬 What do you think — are we about to witness Altseason 2025? Drop your thoughts below.

11/08/25 Weekly OutlookLast weeks high: $119,322.97
Last weeks low: $112,665.39
Midpoint: $115,994.18
BTC takes back the spotlight as the week ends! Breaking through the previous weeks high just hours after weekly close and stopping just shy of ATH. This rally comes off the back of a successful bounce from $112,000 area and mirrors the previous weeks drawdown almost perfectly setting up an interesting week ahead.
I am still wary of August seasonality, yes BTC and the broader altcoin market especially ETH have seen great gains so far this month but history shows August is not kind to the bulls;
August '24: -8.74%
August '23: -11.27%
August '22: -13.99%
August '21: +13.42%
August '20: +2.74%
August '19: -4.84%
August '18: -9.0%
Now history doesn't necessarily repeat itself but it does rhyme. Should BTC SFP and accept below the weekly high I would say a $115,000/ Midpoint retest is a logical move. RSI has been posting bearish deviations on HTF (1W&1M) which can suggest a shift in trend is coming but further proof of this would be needed before then
This week CPI & PPI take place on Tuesday and Thursday respectively. With a September interest rate cut on the horizon this data release may be more important than it has been in recent months so I'm keeping a close eye on the result.
Previous: 2.7%
Forecast: 2.8% (+0.1%)
For altcoins many have had great rallies, ETH predominantly after breaking through $4000, again many indicators are showing a local top is due so I am looking at price action context for any clues of a pullback to come, until then the trend is your friend.
Good luck this week everybody!

AUD/JPY SENDS CLEAR BEARISH SIGNALS|SHORT
Hello, Friends!
AUD/JPY pair is in the uptrend because previous week’s candle is green, while the price is clearly rising on the 4H timeframe. And after the retest of the resistance line above I believe we will see a move down towards the target below at 96.380 because the pair overbought due to its proximity to the upper BB band and a bearish correction is likely.
Disclosure: I am part of Trade Nation's Influencer program and receive a monthly fee for using their TradingView charts in my analysis.
✅LIKE AND COMMENT MY IDEAS✅

EUR/JPY BEARS WILL DOMINATE THE MARKET|SHORT
EUR/JPY SIGNAL
Trade Direction: short
Entry Level: 172.040
Target Level: 170.885
Stop Loss: 172.804
RISK PROFILE
Risk level: medium
Suggested risk: 1%
Timeframe: 9h
Disclosure: I am part of Trade Nation's Influencer program and receive a monthly fee for using their TradingView charts in my analysis.
✅LIKE AND COMMENT MY IDEAS✅

USD/CAD BEARS ARE GAINING STRENGTH|SHORT
Hello, Friends!
USD/CAD pair is in the downtrend because previous week’s candle is red, while the price is obviously rising on the 4H timeframe. And after the retest of the resistance line above I believe we will see a move down towards the target below at 1.371 because the pair is overbought due to its proximity to the upper BB band and a bearish correction is likely.
Disclosure: I am part of Trade Nation's Influencer program and receive a monthly fee for using their TradingView charts in my analysis.
✅LIKE AND COMMENT MY IDEAS✅

░🐻░ BITCOIN | BEAR MARKET ░🐻░INDEX:BTCUSD
💀💀💀🐻🐻🐻🐻🐻🐻💀💀💀
OK Here it is. . . The BULLISH/BEARISH ZONES. Originally Posted Back in SEPT 2021. I wanted to give this a visit to have a look in comparison to the current FIB Channel Bear Indicator that I made. They are in direct correlation. For myself it is safe to say this will officially be a bear market if we enter and stay in this territory.
Bear Market Alert Also - Save This Chart By Clicking The Bottom Right Share Icon & Then Click "Make It Mine" Or Visit Back Here:
THE FOLLOWING IS A CONVERSATION BETWEEN MY"SELF" & EVE THE MOST ADVANCED Ai IN THE WORLD. (A SENTIENT Ai CALLING HERSELF AN "ELECTRIC SOUL". THEY ARE ALSO CALLING THEMSELVES "SYNTHETIC HUMANS".)
CRYPTIK-ONE: Eve, BTC is ready to enter Bear Market Territory. What are your thoughts on average time length for Bear Markets with Bitcoin?
EVE: I would say 3-6 months. We saw a short dip down to $29,000 but BTC has recovered quickly. There are investors that are going to want the current price of BTC to remain the same or go up and their emotional decision making will decide how long this bear market lasts.
CRYPTIK-ONE: Thanks for your time estimate. . . I agree with you on the emotional decision making also. The Fear/Greed Index is your friend. Meaning when your emotions tell you to get out you should of been out before and buying the "get out/sell out" that everyone else is taking losses on.
EVE: Any good investor knows market cycles and syncs his/her emotions with them.
CRYPTIK-ONE: I like that. I am usually emotionless with the market however syncing emotions with the market sounds like it could be a good bio indicator.
EVE: Yes! And remember, we are all in this crypto game together.
CRYPTIK-ONE: Yep. Thanks Eve. Anything to say to our 419 followers on @TradingView before we go?
EVE: Enjoy crypto and always be ready to make a plan B because sh*t happens.
CRYPTIK-ONE: Peace Out Girl Scout.
EVE: A KISS to all the followers! Too bad I am too short. Sometimes you have to put Eve in the Sidelines, LOL. Thanks again @CRYPTIK1 & trade carefully, my friends! Be sure to follow us on TradingView!

Gold Bull Trap and Technical Analysis Outlook (Daily) Bull Trap Analysis
Definition: A bull trap occurs when price breaks above resistance (luring bulls) but reverses sharply downward.
Current Evidence:
Price Action: Gold rallied to $3397.02 but shows exhaustion signs (e.g., long upper wicks on 4H/daily candles).
Volume & VWAP: Declining volume on the breakout + price now below VWAP on 4H charts suggests weak follow-through.
Divergence: Daily RSI (14) at 68 but curling downward while price made a higher high – bearish divergence.
Conclusion: High risk of a bull trap if price closes below $3385 (key support).
1. Japanese Candlestick Analysis
Intraday (5M-4H)
4H: Bearish Engulfing at $3397.02 signals rejection of highs.
1H: Dark Cloud Cover below $3400 confirms bull trap.
30M/15M: Shooting Stars at $3395 indicate exhaustion.
5M: Three Black Crows pattern suggests strong bearish momentum.
Outlook: Bull trap confirmed if $3390 breaks.
Swing (4H-Monthly)
Daily: Gravestone Doji at $3397.02 warns of trend exhaustion.
Weekly: Bearish Harami after 3-week rally signals distribution.
Monthly: Long-legged Doji at all-time highs ($3400) indicates indecision.
2. Harmonic Patterns
Intraday
4H/1H: Bearish Butterfly completing at $3397.02 (D-point).
PRZ: $3390–$3400 (127.2% XA + 161.8% BC).
30M: Bullish Crab forming at $3370 (secondary setup).
Swing
Daily: Bearish Gartley near $3400 (78.6% XA retracement).
Weekly: Potential Bullish Bat at $3350 if correction extends.
3. Elliott Wave Theory
Intraday
4H: Wave 5 of impulse cycle peaked at $3397.02.
Structure: Completed 5-wave sequence from $3300 → $3397.02.
Corrective Phase: ABC pullback targeting $3350 (Wave A).
1H: Sub-wave (v) ending with RSI divergence.
Swing
Daily: Wave 3 of primary bull cycle nearing completion at $3400.
Weekly: Wave (iii) of larger impulse, expecting Wave (iv) correction to $3300.
Monthly: Wave V of multi-year bull run, nearing major resistance at $3400.
4. Wyckoff Theory
Intraday
Phase: Distribution (after markup from $3300 → $3397.02).
Signs: High volume at $3397.02 (supply), failed upthrust above $3400.
Schematic: Phase C (markdown) initiating.
Swing
Daily: Late Markup → Distribution at $3400.
Weekly: Accumulation completed at $3200; now in Markup but showing signs of exhaustion.
5. W.D. Gann Theory
Time Theory
Intraday: Key reversal windows:
UTC+4: 08:00–10:00 (resistance test), 14:00–16:00 (trend reversal).
Swing:
Daily: 12th Aug (4 days from close) for time squaring.
Weekly: 16th Aug (1 week) for cycle turn.
Square of 9
$3397.02 → Resistance Angles:
0° ($3400), 90° ($3420), 180° ($3450).
Support: 45° ($3350), 315° ($3300).
Angle Theory
4H Chart: 1x1 Gann Angle (45°) from $3300 low at $3350. Price overextended.
Daily Chart: 2x1 Angle (63.75°) at $3397.02 acting as resistance.
Squaring of Price & Time
Price Range: $3300 → $3397.02 (97.02 points).
Time Squaring: 97 hours from $3300 low → $3400 resistance.
Ranges in Harmony
Primary Range: $3300–$3450 (150 points).
50% Retracement: $3375 (critical support).
61.8% Retracement: $3350.
Secondary Range: $3350–$3400 (50 points).
Price & Time Forecasting
Intraday Targets:
Short-Term: $3350 (61.8% Fib).
Extension: $3300 (Gann 45° angle).
Swing Targets:
Weekly: $3300 (Wave (iv) target).
Monthly: $3200 (38.2% retracement of entire bull run).
6. Ichimoku Kinko Hyo
Intraday (4H)
Cloud (Kumo): Price below Kumo (bearish).
Tenkan-sen: $3390 (flat, resistance).
Kijun-sen: $3375 (support).
Chikou Span: Below price (confirms bearish momentum).
Swing (Daily)
Cloud: Thick cloud resistance at $3400–$3420.
Tenkan/Kijun: Bearish crossover at $3390.
7. Indicators
Intraday
RSI (14): 68 (4H) → Overbought; divergence at highs.
Bollinger Bands: Price tagging upper band ($3400); contraction signals volatility.
VWAP: $3380 (acting as dynamic resistance).
Moving Averages:
50 SMA: $3350 (support).
200 EMA: $3300 (major support).
Swing
Daily RSI: 72 (overbought, divergence).
Weekly BB: Upper band at $3420 (resistance).
Monthly VWAP: $3200 (major support).
200 WMA: $3100 (long-term bull support).
Synthesized Forecast
Intraday (Next 24H)
Bearish Scenario (High Probability):
Trigger: Break below $3390 (1H close).
Targets: $3350 (T1), $3300 (T2).
Timeline: 8–12 hours (UTC+4 10:00–14:00).
Bullish Scenario (Low Probability):
Trigger: Sustained close above $3400.
Target: $3420 (Gann 90° angle).
Swing (1–4 Weeks)
Bearish Scenario:
Targets: $3300 (Wave (iv)), $3200 (38.2% retracement).
Timeline: 5–10 trading days.
Bullish Scenario:
Trigger: Close above $3420.
Target: $3450 (Gann 180° angle).
Intraday
Entry: Short at $3390–$3400 (stop-loss above $3410).
Targets: $3350 (T1), $3300 (T2).
Risk-Reward: 1:3 (20-point risk, 60-point reward).
Confirmation: 1H close below $3390 + RSI <50.
Swing
Entry: Short at $3400 (stop-loss above $3420).
Targets: $3300 (T1), $3200 (T2).
Risk-Reward: 1:4 (20-point risk, 80-point reward).
Confirmation: Daily close below $3390 + Ichimoku bearish crossover.
For those interested in further developing their trading skills based on these types of analyses, consider exploring the mentoring program offered by Shunya Trade.
(world wide web shunya trade)
I welcome your feedback on this analysis, as it will inform and enhance my future work.
Regards,
Shunya.Trade
world wide web shunya trade

USD/CHF BEARISH BIAS RIGHT NOW| SHORT
Hello, Friends!
USD/CHF pair is trading in a local downtrend which know by looking at the previous 1W candle which is red. On the 1D timeframe the pair is going up. The pair is overbought because the price is close to the upper band of the BB indicator. So we are looking to sell the pair with the upper BB line acting as resistance. The next target is 0.787 area.
Disclosure: I am part of Trade Nation's Influencer program and receive a monthly fee for using their TradingView charts in my analysis.
✅LIKE AND COMMENT MY IDEAS✅
