DOW JONES - BEARISH MOVEHello Traders !
The Dow Jones price failed to create a new higher high !
Currently, The Higher low is broken (change of character).
So, I expect a bearish move📉
_______________
TARGET: 43315.00🎯
Bearish Patterns

EURJPY Potential DownsidesHey Traders, in today's trading session we are monitoring EURJPY for a selling opportunity around 162.300 zone, EURJPY is trading in a downtrend and currently is in a correction phase in which it is approaching the trend at 162.300 support and resistance area.
Trade safe, Joe.

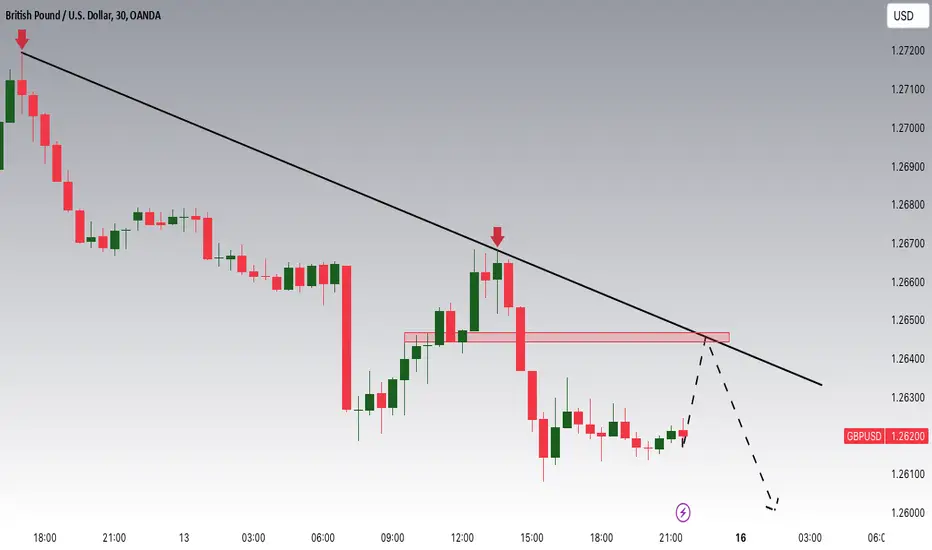
GBPUSD Is Nearing 1.26450 Resistance Along With The TrendHey Traders, in today's trading session we are monitoring GBPUSD for a selling opportunity around 1.26450 zone, GBPUSD is trading in a downtrend and currently is in a correction phase in which it is approaching the trend at 1.26450 support and resistance area.
Trade safe, Joe.
How far ETH will pull back? Potential Future PathIn this chart, all bull trends are in green and bear trends in red, the the longer/ more tested, the stronger the line.
-The dark red line in the bottom corner was a descending trend we had since over a year ago
-We broke out and established a strong ascending trendline and an ascending channel that was about 15 degrees lower slope. And actually at the same time it confirmed the upward channel, it started the downward channel, recently confirmed.
-The other battle here is we lost that strong dark dark green ascending support line and then we came back up and took it back, got rejected and then tried numerous more times to break it before giving up and losing ground.
* Once again we will need to decide which channel we want to maintain, the ascending green channel or the newly formed descending red channel
* I drew some lines of what seems Potential Future Paths, based on my interpretation of the current chart
*Each set of eyes are where you want to be paying attention should we make it to this area.
Roughly this chart infers.
Possible downside
ETH: $3650-$3550 | bullish | If we maintain this green Ascending channel
ETH: ~$3450 | Possible short term bear
Possible Upside:
Look for resistance around $3950 after testing channel bottom.
-------------------------------------
Orderbooks:
Currently orderbooks are strong but we did have the first significant dip in trader confidence we have had in a long minute with the recent sharp pullback but asks are back up to a very stable level. A recent uptick in in bids at 100% DOM, infers traders think there is some more pullback possible though this could be short lived. This is per coinmarketflow, using the new TV charts on ETH.
-------------------------------------
Longer Term:
Note, that is 1 hour candles, here is the same chart with 1d candles:
* Notice we are in a looong term ascending trend and we still have a ways before we test our theoretical top of channel but also there is a lot of room for this to fall, ETH could fall to $2500 in the next days to months and it would still be in an overall longterm ascending pattern with numerous proofs of support over the years.
This is my research based on trend analysis and orderbooks. You should always do your own research, maybe my research will help add to your own and work out as a win.

NQ1! BEST PLACE TO SELL FROM|SHORT
Hello, Friends!
We are now examining the NQ1! pair and we can see that the pair is going up locally while also being in a uptrend on the 1W TF. But there is also a powerful signal from the BB upper band being nearby, indicating that the pair is overbought so we can go short from the resistance line above and a target at 21,219.75 level.
✅LIKE AND COMMENT MY IDEAS✅

USOIL SELLERS WILL DOMINATE THE MARKET|SHORT
Hello, Friends!
USOIL pair is trading in a local downtrend which know by looking at the previous 1W candle which is red. On the 1H timeframe the pair is going up. The pair is overbought because the price is close to the upper band of the BB indicator. So we are looking to sell the pair with the upper BB line acting as resistance. The next target is 70.28 area.
✅LIKE AND COMMENT MY IDEAS✅

EUR/AUD BEARISH BIAS RIGHT NOW| SHORT
Hello, Friends!
We are going short on the EUR/AUD with the target of 1.631 level, because the pair is overbought and will soon hit the resistance line above. We deduced the overbought condition from the price being near to the upper BB band. However, we should use low risk here because the 1W TF is green and gives us a counter-signal.
✅LIKE AND COMMENT MY IDEAS✅

EUR/JPY BEARS ARE STRONG HERE|SHORT
Hello, Friends!
It makes sense for us to go short on EUR/JPY right now from the resistance line above with the target of 160.038 because of the confluence of the two strong factors which are the general downtrend on the previous 1W candle and the overbought situation on the lower TF determined by it’s proximity to the upper BB band.
✅LIKE AND COMMENT MY IDEAS✅

EUR/CAD SHORT FROM RESISTANCE
Hello, Friends!
Previous week’s green candle means that for us the EUR/CAD pair is in the uptrend. And the current movement leg was also up but the resistance line will be hit soon and upper BB band proximity will signal an overbought condition so we will go for a counter-trend short trade with the target being at 1.490.
✅LIKE AND COMMENT MY IDEAS✅

EURGBP Potential DownsidesHey Traders, in today's trading session we are monitoring EURGBP for a selling opportunity around 0.83200 zone, EURGBP is trading in a downtrend and currently is in a correction phase in which it is approaching the trend at 0.83200 support and resistance area.
Trade safe, Joe.

BITCOIN BEARS WILL DOMINATE THE MARKET|SHORT
Hello, Friends!
BITCOIN is trending down which is evident from the red colour of the previous weekly candle. However, the price has locally surged into the overbought territory. Which can be told from its proximity to the BB upper band. Which presents a beautiful trend following opportunity for a short trade from the resistance line above towards the demand level of 89,901.
✅LIKE AND COMMENT MY IDEAS✅

EUR/GBP SENDS CLEAR BEARISH SIGNALS|SHORT
Hello, Friends!
EUR/GBP pair is in the downtrend because previous week’s candle is red, while the price is obviously rising on the 5H timeframe. And after the retest of the resistance line above I believe we will see a move down towards the target below at 0.825 because the pair is overbought due to its proximity to the upper BB band and a bearish correction is likely.
✅LIKE AND COMMENT MY IDEAS✅

USD/CHF BEARS ARE GAINING STRENGTH|SHORT
Hello, Friends!
USD/CHF pair is trading in a local downtrend which know by looking at the previous 1W candle which is red. On the 2H timeframe the pair is going up. The pair is overbought because the price is close to the upper band of the BB indicator. So we are looking to sell the pair with the upper BB line acting as resistance. The next target is 0.886 area.
✅LIKE AND COMMENT MY IDEAS✅

GBP/USD BEARS ARE STRONG HERE|SHORT
Hello, Friends!
Previous week’s green candle means that for us the GBP/USD pair is in the uptrend. And the current movement leg was also up but the resistance line will be hit soon and upper BB band proximity will signal an overbought condition so we will go for a counter-trend short trade with the target being at 1.270.
✅LIKE AND COMMENT MY IDEAS✅

AUDCAD Potential DownsidesHey Traders, in today's trading session we are monitoring AUDCAD for a selling opportunity around 0.91000 zone, AUDCAD is trading in an uptrend and currently is in a correction phase in which it is approaching the trend at 0.91000 support and resistance area.
Trade safe, Joe.

NZDUSD Potential DownsidesHey Traders, in today's trading session we are monitoring NZDUSD for a selling opportunity around 0.57800 zone, NZDUSD is trading in a downtrend and currently is in a correction phase in which it is approaching the trend at 0.57800 support and resistance area.
Trade safe, Joe.

EURUSD Potential DownsidesHey Traders, in today's trading session we are monitoring EURUSD for a selling opportunity around 1.05100 zone, EURUSD is trading in a downtrend and currently is in a correction phase in which it is approaching the trend at 1.05100 support and resistance area.
Trade safe, Joe.

GBPNZD Can Be Finishing The Wedge PatternGBPNZD pair has been trading bullish for the last 2 years or so, but since 2023 we can see that price action is slowing down and that bulls are running out of steam.
It came even higher recently and it's testing the highs of the year, but we are tracking an ending diagonal a.k.a. wedge pattern, which can be in final stages of 5th wave. If we are correct, then strong and sharp reversal will show up in 2025.
The ending diagonal (wedge) pattern is a special type of wave that occurs in wave 5 of an impulse or in wave C of a correction. An ending diagonal pattern is a type of pattern that can occur at the completion of a strong move. It reflects a “calming” of the market sentiment such that price still moves generally in the direction of the larger move, but not strongly enough to produce an impulsive wave. Ending diagonals consist of five waves, labeled 1-2-3-4-5, where each wave subdivides into three legs. Waves 1 and 4 overlap in price, while wave 3 can not be the shortest amongst waves 1, 3 and 5.
The reason why they are so interesting is because they are indicating a reversal, usually a strong one.

Silver May Face More Weakness After A Corrective RallySilver is making sharp reversal down from recent highs, even breaking a lower trendline support of an ending diagonal which is an important indication for a top in place. As such, we are aware of much lower prices, maybe even back to the start of a diagonal at around 27/28 as drop from 4h time frame has an impulsive bearish structure into wave A/1.
But we see some bounce now that can be an A-B-C irregular/expanded flat correction into wave B/2, where subwave (C) can be now in progress. Resistance is then around 31.60-33 area, and from where we will have to be aware of further weakness within wave C or 3.


GOLD BEARISH BIAS RIGHT NOW| SHORT
Hello, Friends!
GOLD is making a bullish rebound on the 4H TF and is nearing the resistance line above while we are generally bearish biased on the pair due to our previous 1W candle analysis, thus making a trend-following short a good option for us with the target being the 2,667.233 level.
✅LIKE AND COMMENT MY IDEAS✅

USD/CAD BEST PLACE TO SELL FROM|SHORT
Hello, Friends!
The BB upper band is nearby so USD-CAD is in the overbought territory. Thus, despite the uptrend on the 1W timeframe I think that we will see a bearish reaction from the resistance line above and a move down towards the target at around 1.405.
✅LIKE AND COMMENT MY IDEAS✅

USD/JPY SHORT FROM RESISTANCE
Hello, Friends!
USD-JPY uptrend evident from the last 1W green candle makes short trades more risky, but the current set-up targeting 151.868 area still presents a good opportunity for us to sell the pair because the resistance line is nearby and the BB upper band is close which indicates the overbought state of the USD/JPY pair.
✅LIKE AND COMMENT MY IDEAS✅
