AUD/CAD SHORT FROM RESISTANCE
Hello, Friends!
We are now examining the AUD/CAD pair and we can see that the pair is going up locally while also being in a uptrend on the 1W TF. But there is also a powerful signal from the BB upper band being nearby, indicating that the pair is overbought so we can go short from the resistance line above and a target at 0.895 level.
Disclosure: I am part of Trade Nation's Influencer program and receive a monthly fee for using their TradingView charts in my analysis.
✅LIKE AND COMMENT MY IDEAS✅
Bearish Patterns

GBP/CHF SELLERS WILL DOMINATE THE MARKET|SHORT
Hello, Friends!
We are going short on the GBP/CHF with the target of 1.080 level, because the pair is overbought and will soon hit the resistance line above. We deduced the overbought condition from the price being near to the upper BB band. However, we should use low risk here because the 1W TF is green and gives us a counter-signal.
Disclosure: I am part of Trade Nation's Influencer program and receive a monthly fee for using their TradingView charts in my analysis.
✅LIKE AND COMMENT MY IDEAS✅

USD/CHF BEARS ARE GAINING STRENGTH|SHORT
USD/CHF SIGNAL
Trade Direction: short
Entry Level: 0.804
Target Level: 0.799
Stop Loss: 0.807
RISK PROFILE
Risk level: medium
Suggested risk: 1%
Timeframe: 2h
Disclosure: I am part of Trade Nation's Influencer program and receive a monthly fee for using their TradingView charts in my analysis.
✅LIKE AND COMMENT MY IDEAS✅

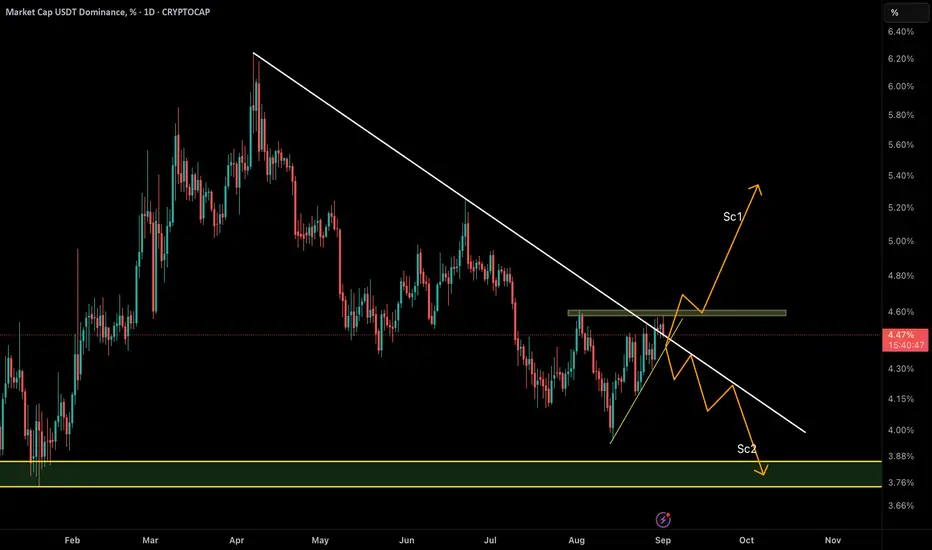
USDT Dominance at a Key Decision Point ,Crash or Fly?USDT Dominance has managed to break above the descending trendline (white line) with volume, but so far it has failed to clear the order block resistance at 4.61% (green zone).
At this stage, price action is stuck between two critical levels, and the next move could define the market’s mid-term direction:
🔸 Scenario 1 (Bullish for USDT.D / Bearish for Crypto):
A clean break and acceptance above the 4.61% order block would confirm demand for stablecoins, signaling capital rotation out of crypto assets. This could trigger a market-wide selloff in Bitcoin and altcoins.
🔸 Scenario 2 (Bearish for USDT.D / Bullish for Crypto):
Failure to hold above the broken trendline and a rejection from 4.61% could drive USDT.D back below the descending line, opening the path toward the 3.8% demand zone. This would suggest capital flowing back into crypto, fueling a potential bullish rally.
⚠️ Market participants should keep a close eye on this area — the reaction around 4.61% will set the tone for the weeks ahead.
USOIL BEARS WILL DOMINATE THE MARKET|SHORT
USOIL SIGNAL
Trade Direction: short
Entry Level: 64.00
Target Level: 62.79
Stop Loss: 64.80
RISK PROFILE
Risk level: medium
Suggested risk: 1%
Timeframe: 4h
Disclosure: I am part of Trade Nation's Influencer program and receive a monthly fee for using their TradingView charts in my analysis.
✅LIKE AND COMMENT MY IDEAS✅

CHF/JPY SENDS CLEAR BEARISH SIGNALS|SHORT
Hello, Friends!
It makes sense for us to go short on CHF/JPY right now from the resistance line above with the target of 182.348 because of the confluence of the two strong factors which are the general downtrend on the previous 1W candle and the overbought situation on the lower TF determined by it’s proximity to the upper BB band.
Disclosure: I am part of Trade Nation's Influencer program and receive a monthly fee for using their TradingView charts in my analysis.
✅LIKE AND COMMENT MY IDEAS✅

So, the market will never fall ever again ?Sentiment in the market is max bullish right now, which has historically been a very good time to be bearish.

AUDCAD | Technical 4h. This scenario is about how the price action can continue in the next few!
The bears are stronger after this triple top resistance. So, we may see strong downhills. :)
GL!
Nika.

NZD/JPY SELLERS WILL DOMINATE THE MARKET|SHORT
Hello, Friends!
Bearish trend on NZD/JPY, defined by the red colour of the last week candle combined with the fact the pair is overbought based on the BB upper band proximity, makes me expect a bearish rebound from the resistance line above and a retest of the local target below at 85.565.
Disclosure: I am part of Trade Nation's Influencer program and receive a monthly fee for using their TradingView charts in my analysis.
✅LIKE AND COMMENT MY IDEAS✅

CAD/JPY BEARISH BIAS RIGHT NOW| SHORT
Hello, Friends!
CAD/JPY is trending down which is clear from the red colour of the previous weekly candle. However, the price has locally surged into the overbought territory. Which can be told from its proximity to the BB upper band. Which presents a great trend following opportunity for a short trade from the resistance line above towards the demand level of 105.850.
Disclosure: I am part of Trade Nation's Influencer program and receive a monthly fee for using their TradingView charts in my analysis.
✅LIKE AND COMMENT MY IDEAS✅

XAUUSD big correction is coming on September?The complex correction or consolidation is now on the edge.
Either Gold will break it and make a new range or it will retreat about $100-$150 correction.
I prefer to trade with the correction, BEARISH FOR GOLD!
LET'S GO...!!!

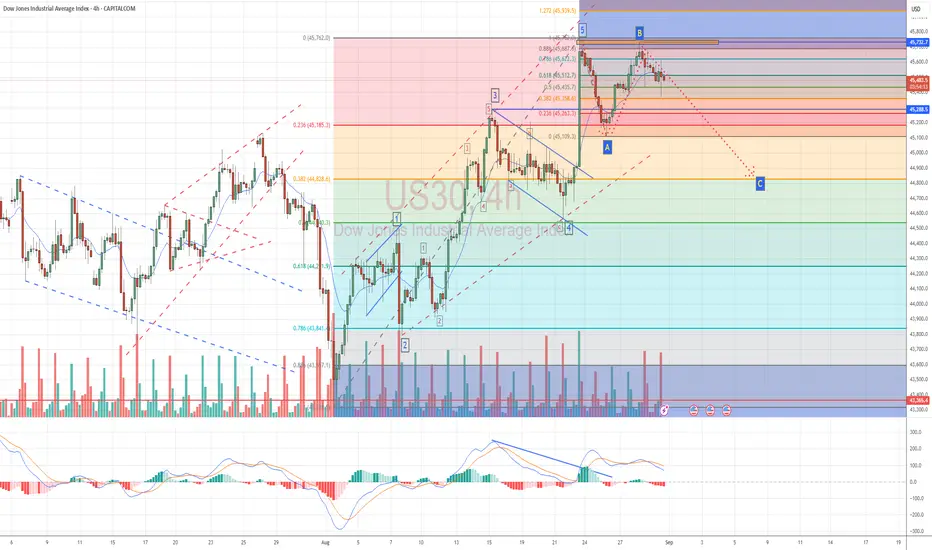
Perfect Elliot Wave on US30 The US30 has completed its 5 impulsive waves and made A and B correction, where the B making imperfect double top (as top of wave 5).
I am ready for wave C of the A-B-C correction!
Are you?
USDCAD – Shift in Momentum!USDCAD has moved from a strong bullish rally into a clear shift in momentum. After breaking structure with an aggressive drop, price is now moving inside a rising channel that looks more corrective than impulsive.
The previous bullish phase was defined by higher highs and higher lows, but the sharp decline highlighted a potential change in sentiment. Since then, the market has been consolidating, with price pushing higher in a slower and corrective manner.
As long as price remains inside this channel, the bias stays bearish, and I’ll be looking for shorts from the upper boundary around the 1.3880–1.3900 zone. A break below the lower bound near 1.3820 could confirm continuation to the downside.
This is a critical zone for USDCAD, where sellers may step in to regain control.
📚 Always follow your trading plan regarding entry, risk management, and trade management.
Good luck!
All Strategies Are Good; If Managed Properly!
~Richard Nasr

GOLD BEST PLACE TO SELL FROM|SHORT
GOLD SIGNAL
Trade Direction: short
Entry Level: 3,406.14
Target Level: 3,357.86
Stop Loss: 3,438.15
RISK PROFILE
Risk level: medium
Suggested risk: 1%
Timeframe: 9h
Disclosure: I am part of Trade Nation's Influencer program and receive a monthly fee for using their TradingView charts in my analysis.
✅LIKE AND COMMENT MY IDEAS✅

AUD/JPY BEARS ARE STRONG HERE|SHORT
AUD/JPY SIGNAL
Trade Direction: short
Entry Level: 96.098
Target Level: 95.328
Stop Loss: 96.611
RISK PROFILE
Risk level: medium
Suggested risk: 1%
Timeframe: 9h
Disclosure: I am part of Trade Nation's Influencer program and receive a monthly fee for using their TradingView charts in my analysis.
✅LIKE AND COMMENT MY IDEAS✅

USOIL SENDS CLEAR BEARISH SIGNALS|SHORT
USOIL SIGNAL
Trade Direction: short
Entry Level: 64.06
Target Level: 61.35
Stop Loss: 65.86
RISK PROFILE
Risk level: medium
Suggested risk: 1%
Timeframe: 12h
Disclosure: I am part of Trade Nation's Influencer program and receive a monthly fee for using their TradingView charts in my analysis.
✅LIKE AND COMMENT MY IDEAS✅

EUR/NZD BEARISH BIAS RIGHT NOW| SHORT
Hello, Friends!
We are now examining the EUR/NZD pair and we can see that the pair is going up locally while also being in a uptrend on the 1W TF. But there is also a powerful signal from the BB upper band being nearby, indicating that the pair is overbought so we can go short from the resistance line above and a target at 1.960 level.
Disclosure: I am part of Trade Nation's Influencer program and receive a monthly fee for using their TradingView charts in my analysis.
✅LIKE AND COMMENT MY IDEAS✅

BITCOIN SHORT FROM RESISTANCE
BITCOIN SIGNAL
Trade Direction: short
Entry Level: 119,125.07
Target Level: 111,573.08
Stop Loss: 124,149.32
RISK PROFILE
Risk level: medium
Suggested risk: 1%
Timeframe: 12h
Disclosure: I am part of Trade Nation's Influencer program and receive a monthly fee for using their TradingView charts in my analysis.
✅LIKE AND COMMENT MY IDEAS✅

EUR/CHF SENDS CLEAR BEARISH SIGNALS|SHORT
Hello, Friends!
The BB upper band is nearby so EUR-CHF is in the overbought territory. Thus, despite the uptrend on the 1W timeframe I think that we will see a bearish reaction from the resistance line above and a move down towards the target at around 0.934.
Disclosure: I am part of Trade Nation's Influencer program and receive a monthly fee for using their TradingView charts in my analysis.
✅LIKE AND COMMENT MY IDEAS✅

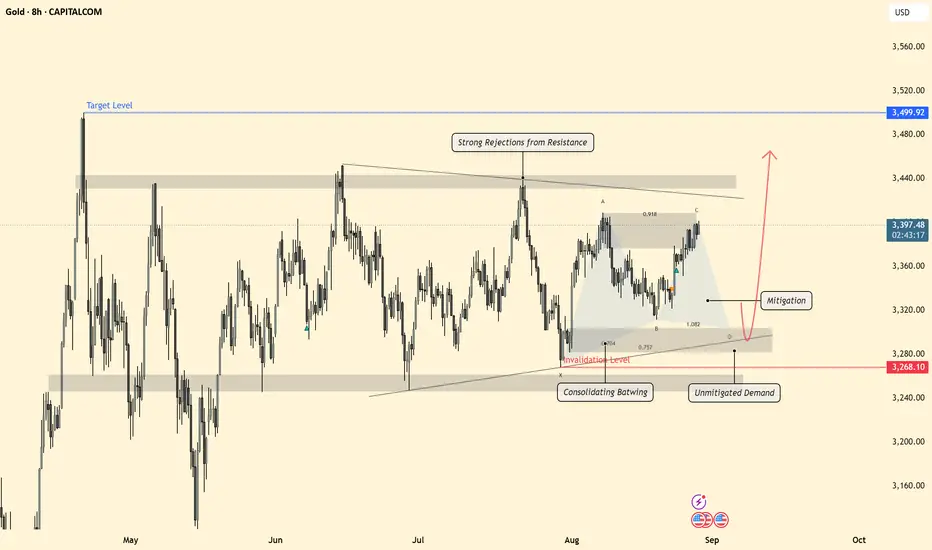
Gold (XAU/USD) - Possible Bearish move before breakout🟡 Gold (XAU/USD) – 8H Breakdown
📊 Bias
Currently neutral → short-term bearish pullback expected before bullish continuation.
🔎 Technical Breakdown
Structure:
Price is consolidating inside a batwing harmonic pattern.
Multiple strong rejections from resistance confirm sellers defending higher levels.
Key unmitigated demand zone sits around 3,268 – 3,280.
Key Levels:
Target Resistance: 3,499
Current Price: 3,397
Mitigation Zone: 3,320 – 3,330
Demand Zone (Buy POI): 3,268 – 3,280 (high probability entry)
Invalidation: Break & close below 3,268
Expectations:
Possible short-term rejection around current resistance (3,397 – 3,410).
Price likely retraces into mitigation zone (3,320) or deeper into demand (3,268).
Bullish reaction from demand could push back into 3,499 target level.
🎯 Trade Plan
Entry Zone (Buy): 3,268 – 3,280 (unmitigated demand)
Stop Loss: Below 3,250 (invalidate structure)
First Target: 3,397 (current highs / liquidity)
Main Target: 3,499 (major resistance level)
⚠️ Notes
Watch for false breakouts above 3,400 before the deeper retracement.
Confirmation at demand zone is key — look for rejection candles or bullish engulfing.
If demand fails, structure flips bearish into 3,200s.
NVDA LIVE 27 AUG 2025This is my analysis for NVDA . i am not touching it all. I have discussed my reasons as per data. If you have any doubts, feel free to DM me
NOTE: AVOIDING NVDA

GOLD BEST PLACE TO SELL FROM|SHORT
GOLD SIGNAL
Trade Direction: short
Entry Level: 3,376.52
Target Level: 3,274.10
Stop Loss: 3,444.67
RISK PROFILE
Risk level: medium
Suggested risk: 1%
Timeframe: 1D
Disclosure: I am part of Trade Nation's Influencer program and receive a monthly fee for using their TradingView charts in my analysis.
✅LIKE AND COMMENT MY IDEAS✅

EUR/AUD BEARS ARE STRONG HERE|SHORT
EUR/AUD SIGNAL
Trade Direction: short
Entry Level: 1.790
Target Level: 1.765
Stop Loss: 1.807
RISK PROFILE
Risk level: medium
Suggested risk: 1%
Timeframe: 1D
Disclosure: I am part of Trade Nation's Influencer program and receive a monthly fee for using their TradingView charts in my analysis.
✅LIKE AND COMMENT MY IDEAS✅
