BULLA is showing extreme overbought conditionsSHORT – BULLA
Across multiple timeframes, BULLA is showing extreme overbought conditions, signaling a high risk of mean reversion. On the 15-minute timeframe, a clear bearish divergence has formed, indicating weakening bullish momentum despite elevated prices.
Price has broken down from the ascending trend, confirming a loss of bullish structure. Additionally, there is a strong overhead resistance zone, where prior distribution occurred. Current price action shows diminishing buying pressure and lack of follow-through, aligning with classic momentum and trend exhaustion signals supported by RSI divergence, trendline failure, and price–structure analysis.
🎯 TP: 0.335
🛡️ SL: 0.09852
📊 RR: 1 : 6
Trade thesis: multi-timeframe overbought conditions + bearish divergence on M15 + breakdown of the uptrend and strong overhead resistance, forming a high-probability short setup with an attractive risk–reward profile.
Bearishdivergence

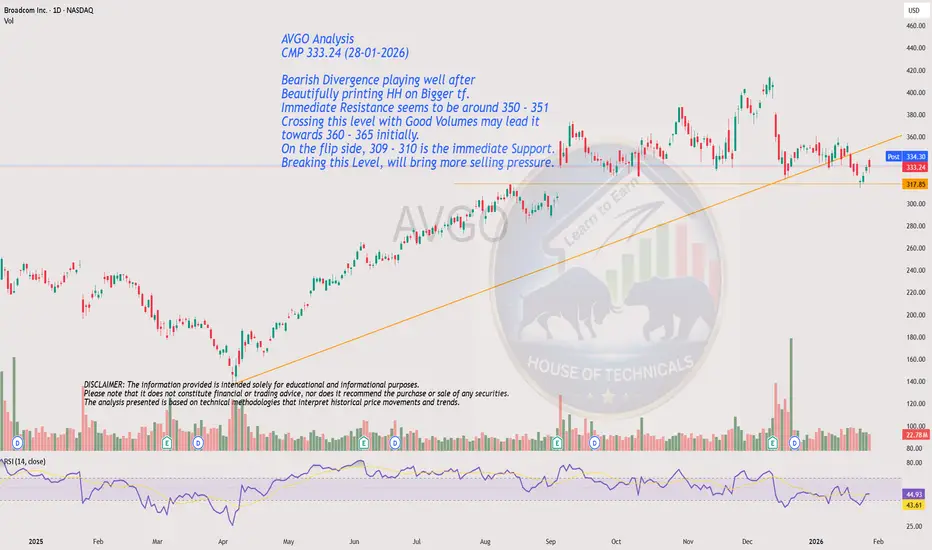
Beautifully printing HH on Bigger tf.AVGO Analysis
CMP 333.24 (28-01-2026)
Bearish Divergence playing well after
Beautifully printing HH on Bigger tf.
Immediate Resistance seems to be around 350 - 351
Crossing this level with Good Volumes may lead it
towards 360 - 365 initially.
On the flip side, 309 - 310 is the immediate Support.
Breaking this Level, will bring more selling pressure.
Bearish Divergence Playing Well!KSE100 Closed at 182338.12 (29-01-2026)
Bearish Divergence played well. Also there is Bearish Divergence in volumes.
Immediate Support seems around 179500 - 181000
Weekly Closing above blue trendline may bring some positivity in upcoming week.
Index still has the potential to touch 195,000 - 200,000 & then 210,000 but only
if it Crosses & Sustains 190000 -191500 with Good Volumes.

Continuously making HH HL but now..AAPL Analysis
CMP 256.44 (28-01-2026)
Continuously making HH HL.
Now Bearish Divergence on bigger tf; Cautious Approach should be taken.
Trading in a Channel with Channel bottom around 223 - 226 & Channel top around 300 - 304.
Before Channel Support, an immediate support is also available around 246 - 248.

GOLD – 4H | Bearish Divergence – Pullback or Continuation?Gold ( OANDA:XAUUSD ) remains in a broader uptrend on the 4H timeframe, printing higher highs and higher lows while respecting the ascending channel structure. However, recent price action suggests the upside momentum may be weakening near a key resistance zone at 4640.
Price is currently consolidating between 4640 and 4570, showing clear signs of accumulation. At the same time, a bearish divergence on RSI is visible, indicating declining momentum despite price holding near highs. This divergence aligns with a rising wedge formation, which often precedes corrective or reversal moves when it appears late in an uptrend.
From a structure perspective, the market is approaching a decision point.
A clean break and 4H close above the 4650 zone would invalidate the immediate bearish setup and could open the path toward the 4700 area.
On the downside, a 4H close below 4570, accompanied by a clear breakdown from the accumulation range, would confirm weakness and expose 4500, with room for further downside.
Adding to the confluence, the higher-timeframe structure also shows a bearish harmonic AB=CD pattern, reinforcing the idea of a potential pullback or corrective phase..
Fundamentally, gold remains strong overall, but from a technical standpoint, a pullback within the trend appears increasingly likely.
Watching price action closely for confirmation.
Bias remains short-term bearish unless invalidated.

Price has broken the ascending trend - RIVER🐻 SHORT – RIVER
This is a final, disciplined short, not driven by emotion. On the 4H timeframe, a clear bearish divergence is confirmed. Price has broken the ascending trend, completed a pullback retest, and is now resuming to the downside—classic trend-break continuation behavior. Momentum has shifted decisively in favor of sellers.
🎯 TP: 3.868
🛡️ SL: 24.429
📊 RR: 1 : 4
A clean short setup: 4H bearish divergence + trend break + failed retest → downside continuation with controlled risk.

A clear bearish divergence - IP🐻 SHORT – IP
A clear bearish divergence is confirmed on the 15m chart, while the 1H and 4H timeframes are distinctly overbought. RSI has rolled over and is trending sharply lower, signaling momentum exhaustion. This is a high-probability setup I favor, with conditions aligned for a swift downside move.
🎯 TP: 2.036
🛡️ SL: 2.713
📊 RR: 1 : 6.96
A premium short setup: multi-timeframe overbought + bearish divergence + RSI rollover → strong sell-off potential.

Rare Bearish Divergence - RIVER🐻 SHORT – RIVER
After a brief pause, I reassessed RIVER on the 4H chart. Higher timeframes (4H, 1D) are severely overbought. On 4H, a clear and rare bearish divergence is present, signaling momentum exhaustion. Price is pushing higher despite declining volume, an unhealthy structure that often precedes a sharp sell-off.
🎯 TP: 1.628
🛡️ SL: 17.972
📊 RR: 1 : 9.2
A high-conviction short: multi-timeframe overbought + bearish divergence + falling volume → elevated probability of rapid downside.

Bearish Divergence -GUN🐻 SHORT – GUN
A clear bearish divergence has formed on the 1H chart, while the 4H timeframe is distinctly overbought, signaling momentum exhaustion. This is a setup I strongly favor: stretched price, weakening momentum, and elevated risk of a swift sell-off.
🎯 TP: 0.01405
🛡️ SL: 0.02857
📊 RR: 1 : 5.82
A high-quality short: HTF overbought + bearish divergence → strong downside potential with attractive risk–reward.

SP-500 Bearish Indications- Overall Market AnalysisDaily Time Frame- Rising Wedge is a bearish reversal pattern. If the Daily breaks out of this pattern at any point towards the downside we should see price reach the previous support levels around 6840.00.
4H Time Frame- Created Bearish Divergence on the Relative Strength Index indicator (RSI). Higher highs are being made in price but lower highs on indicator.
1H time Frame and down has a head and shoulders pattern. Currently sitting at right shoulder. This could be bearish indication for today market.

$GOLD Bearish Engulfing Weekly CloseSlight bearish engulfing on the TVC:GOLD weekly close with bearish divergence.
The rotation into CRYPTOCAP:BTC could finally be happening 🥹
Will post TA on that soon.

Strong bearish divergences All Time - RIVER🐻 SHORT – RIVER
RIVER is severely overbought across all timeframes. Strong bearish divergences are present on 15m, 1H, 4H, and 1D, with the 1H setup being exceptionally rare, signaling extreme momentum exhaustion. Price is attempting to push higher in an unnatural manner, which often precedes a sharp and rapid sell-off.
🎯 TP: 3.7
🛡️ SL: 15.79
📊 RR: 1 : 9
A high-risk, high-reward short: multi-timeframe overbought + broad bearish divergence → elevated probability of a fast downside move.

Strong bearish divergence - RIVER🐻 SHORT – RIVER
Strong bearish divergence is confirmed across 15m, 4H, and 1D, while RSI shows extreme overbought conditions on all these timeframes. Price has expanded aggressively, signaling momentum exhaustion and a structurally unhealthy move. With multi-timeframe confluence, the probability of a sharp mean reversion and sell-off is high.
🎯 TP: 3.986
🛡️ SL: 11.607
📊 RR: 1 : 6.42
A textbook short setup: multi-timeframe divergence + extreme overbought → high downside potential with asymmetric reward.

Extreme Bearsish Divergence - LIGHT🐻 SHORT – LIGHT
LIGHT is showing clear overbought conditions across multiple timeframes. On the 1H chart, the combination of extreme overbought RSI and a rare bearish divergence signals momentum exhaustion. Price is rising and holding in an unnatural, unstable manner, which significantly increases the risk of a sharp sell-off.
🎯 TP: 0.2881
🛡️ SL: 2.5894
📊 RR: 1 : 6.5
A high-conviction short setup: multi-timeframe overbought + strong bearish divergence → elevated probability of a fast downside move.

Bearish Divergence - PIERVESE🐻 SHORT – PIEVERSE
Strong bearish divergence is forming on the 15M timeframe, while RSI remains heavily overbought on both the 1H and 4H charts. Price has extended far beyond fair value, signaling exhaustion and an unhealthy rally. This multi-timeframe confluence significantly increases the probability of a sharp sell-off.
🎯 TP: 0.4867
🛡️ SL: 0.7005
📊 RR: 1 : 7.15
A high-conviction short: multi-timeframe overbought conditions + bearish divergence → elevated reversal risk with asymmetric reward.

Bearish Divergence - ZBT🐻 SHORT – ZBT
A strong bearish divergence is confirmed on the 15m timeframe, while price remains overbought on both the 1H and 4H charts—most notably the 4H RSI reaching 95. This overextended rally signals momentum exhaustion. Such an unhealthy structure typically precedes distribution and a sharp sell-off. I am confident in a downside move.
🎯 TP: 0.0743
🛡️ SL: 0.1646
📊 RR: 1 : 5.35
A high-quality short setup: multi-timeframe overbought conditions + bearish divergence → elevated probability of a strong correction.

Is AVGO’s drop over yet?Oracle AVGO — Price Analysis
Chart A (Daily):
Price had been oscillating within an 80-day channel, and after failing to reach the channel’s upper boundary due to repeated divergences, it finally broke below the bullish channel with two strong, high-volume daily candles—the highest selling volume seen on this chart in the past 68 days—and closed below the channel.
Chart B (4H):
This structure is also visible on the 4-hour chart as a wedge pattern, where price initially experienced a fake breakout to the upside and has now broken the lower boundary of the wedge.
Outlook:
This corrective move could potentially continue at least to the gap zone highlighted on the chart, which is a significant gap, and possibly extend further to the support zone at the lower end of the extended channel. Once price reaches these areas, we should watch for potential reactions.
Note: This analysis will be updated as the situation develops.
Follow me on TradingView for more analyses and live stock trades.
NASDAQ:AVGO

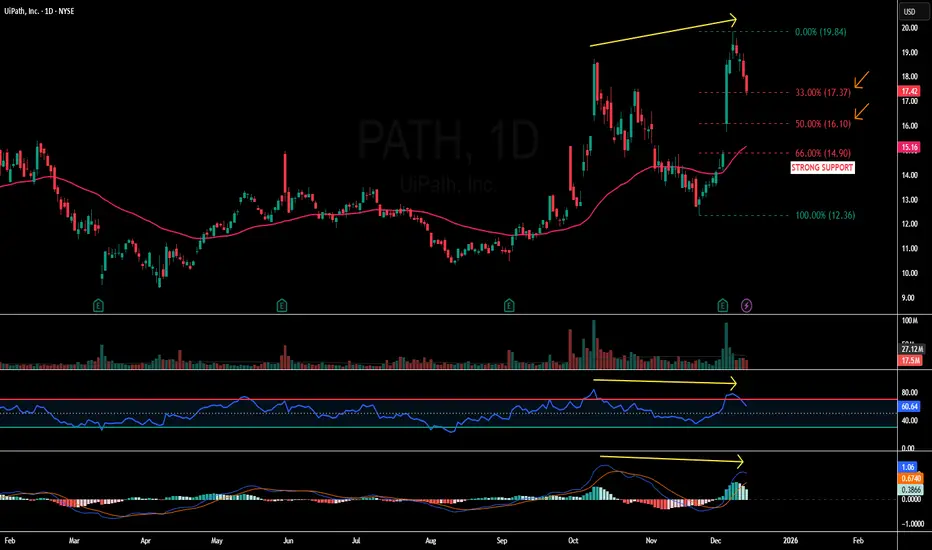
PATH - 14.90 – The Line That MattersPATH - CURRENT PRICE : 17.42
UiPATH (PATH) – Previous Targets Achieved, Buy-on-Dips Setup After Healthy Pullback
The previous technical buy call on UiPATH has successfully achieved all stated upside targets (refer to the earlier analysis via the shared link for reading context). Following this strong rally, the stock has now entered a pullback phase, which is technically expected after an extended upside move.
The current retracement is accompanied by a bearish divergence between price and momentum indicators (RSI & MACD) , as highlighted by the yellow arrows on the chart. Bearish divergence occurs when price makes a higher high while momentum indicators fail to confirm with higher highs, often signaling short-term exhaustion and a corrective move rather than a trend reversal. This explains the ongoing pullback and supports the view that the decline is corrective in nature.
From a structural perspective, the pullback remains constructive and healthy. Price has retraced approximately 33% of the prior advance, which aligns well with Dow Theory, where strong trends commonly retrace one-third or one-half before resuming the primary trend. Importantly, price continues to trade above the 50-day EMA, while both RSI and MACD remain in bullish territory, indicating that the broader bullish momentum is still intact despite near-term consolidation.
A critical level to watch is 14.90, which serves as STRONG SUPPORT. This level represents a two-thirds (≈66%) retracement under Dow Theory, coincides with a previous gap-up demand zone, and is located near the rising 50-day EMA, creating a strong confluence of technical support.
Trading Plan (Buy-on-Dips Approach):
At current levels, traders may consider initiating HALF of the intended position.
If price retraces further toward the 50% retracement level, the remaining half position may be added, as this remains a healthy pullback within an uptrend.
A decisive break below 14.90 (66% level) would invalidate the setup and should be treated as a cut-loss level.
As long as price holds above this support zone, the pullback can be viewed as a buy-the-dip opportunity, with the potential for the primary uptrend to resume.
FIRST TARGET : 18.50
SECOND TARGET : 19.80
SUPPORT : 14.90
Gold 4H: Bearish Scenario
Price is riding a clean rising trendline from the October lows, connecting multiple higher swing lows.
A break and retest of this blue trendline would signal fading momentum and open the door for a deeper correction toward horizontal support.
🧱 Why 3,947 is strong support
3,947 marks the previous consolidation base where buyers stepped in aggressively after the last sharp sell‑off, turning it into a clear demand zone.
It also aligns with the last major 4H swing low, so many stop‑losses and resting buy orders are likely clustered there, making it a natural magnet if the trendline fails.
📉 Bearish divergence
While price made higher highs on the 4H chart, the RSI printed lower highs, creating a clear bearish divergence.
This divergence suggests buyers are losing strength, increasing the probability of a trendline break and a move down into the 3,947 support area before any new major leg higher.

Bearish Divergence on Weekly TF.Bearish Divergence on Weekly TF.
Resistance lies around 225 - 235
Currently moving in a Rectangular Channel.
Crossing 222 - 223 will trigger more positivity
towards 235 - 240 initially and then around 250-260.

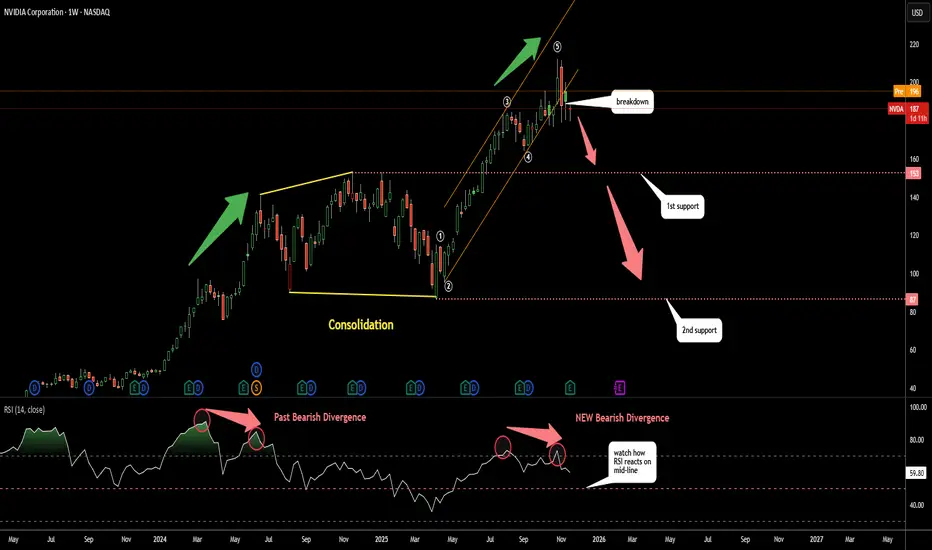
Nvdia (NVDA): How Deep It Can Dip?The RSI is not buying the hype as it shows clear Bearish Divergence
This aligns with the current impulse wave count suggesting the 5 wave structure may now be complete and the orange uptrend has been broken
Last year a similar Bearish Divergence triggered a large consolidation phase marked in yellow
It may repeat again
First support is at 153 the top of the previous consolidation
Second support is at 87 the bottom of that consolidation
NASDAQ (NQ1!) – Bearish Divergence Potential PullbackOn the 1-hour chart, a clear bearish divergence has formed at recent highs, aligning with loss of bullish momentum and price rejection near the upper trend channel. The short-term structure suggests sellers may gain control, with potential retracement zones around the 0.5–0.618 FIB levels and an unfilled GAP below.
If price confirms continuation after a minor relief bounce, we could see a corrective wave unfold before the broader uptrend resumes.
Bias: Short-term Bearish – looking for retracement opportunities toward key support levels before potential trend continuation.

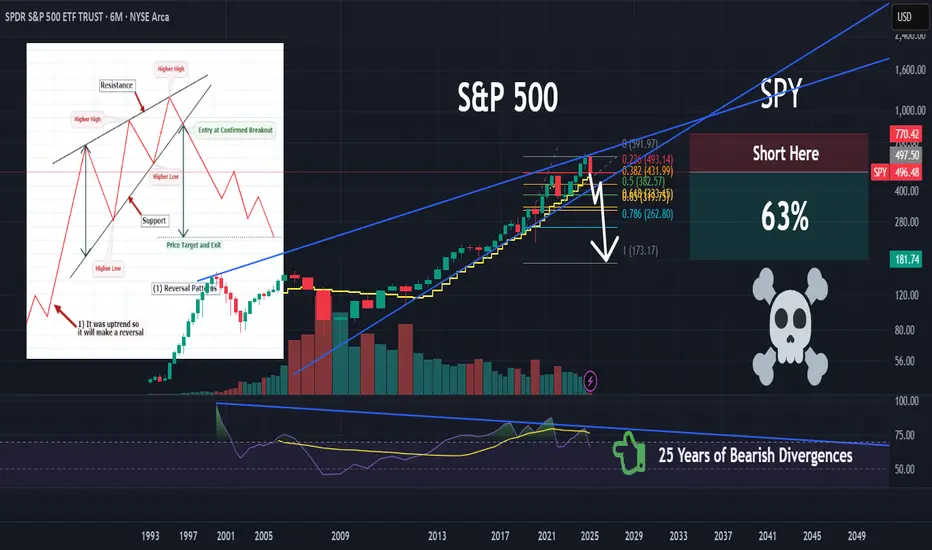
SPY | Things Could Get Ugly | ShortSPDR S&P 500 ETF Trust seeks to provide investment results that, before expenses, correspond generally to the price and yield performance of the S&P 500 Index. The Trust seeks to achieve its investment objective by holding a portfolio of the common stocks that are included in the index (the "Portfolio"), with the weight of each stock in the Portfolio substantially corresponding to the weight of such stock in the index.