XAUUAD READY FOR PULLBACK (READ CAPTION)Hi traders what do you think about gold
Gold (XAUUSD) is currently forming a sell retest setup, where price is retracing upward into key resistance zones before a potential bearish continuation. This structure supports a sell-on-retest strategy.
🔹 Resistance Zone: 4527–4531
This is the primary sell zone where price is expected to face rejection.
If the market retests this zone and shows bearish price action (rejection wicks or bearish candles), it confirms seller dominance.
🔹 Second Resistance: 4555
This level represents the upper resistance and invalidation zone.
A strong rejection from 4555 would further strengthen the bearish outlook, while a sustained break above it may weaken the sell setup.
🔹 Support: 4496
This is the first downside target where price may pause or form a minor bounce.
A confirmed break below 4496 signals continuation of bearish momentum.
🔹 Demand Zone: 4457
This is the main downside target and demand area.
If price breaks below 4496, Gold is likely to move toward 4457, where buyers may step in for a reaction or short-term consolidation.
📉 Market Outlook (Retest Logic)
Retracement into 4527–4531 → Sell opportunity
Rejection from resistance → Confirms bearish continuation
Break below 4496 → Opens path toward 4457 demand zone
Demand zone reaction will determine next move
The overall structure favors a bearish retest → continuation setup, unless price breaks and holds above 4555
please don't forget to like comment and follow thank you
Bearishsetup

ENA / USDT – Short Bias (HTF + Confluence)ENA is currently trading below the weekly support level, which keeps the higher-timeframe bias bearish.
As long as price remains below this weekly level, longs are high risk.
On the 1H timeframe, price has retraced into a clear sell-side zone, aligning with:
Prior resistance
A clean bearish order block
Weak reaction on the retrace (no impulsive bullish displacement)
📉 Market context confirmation:
Total Market Cap still shows bearish structure, supporting downside continuation across altcoins.
Key thesis:
Weekly support flipt in to resistance
No bullish deviation confirmed
HTF + LTF structure align bearish
ENA only turns bullish if:
➡️ Price deviates below the level,
➡️ Reclaims the weekly level as support,
➡️ And shows strong bullish displacement (as discussed in the weekly analysis).
Until then, rallies are considered sell opportunities.
Target idea:
Liquidity draw towards equal lows (EQL) remains likely if resistance holds.
Not financial advice. Always manage risk.
Do you think ENA will reject from resistance or reclaim the weekly level first? 👀📉
MrC

Neckline Breaks and Trader Nerves: A Quick Guide to Bearish H&S The head and shoulders pattern is like the market’s way of clearing its throat and saying, “Things might be changing up here.” Once that neckline snaps, traders often sit up straighter — not because something magical happened, but because the chart finally drew a clean line between “maybe” and “now it matters.”
In this ZS (Soybean Futures) example, price slipped under the neckline and started wandering toward lower ground. Traders who work with this pattern usually focus on three things:
A possible bounce back toward the neckline (because markets love second chances),
A clear invalidation level (in this case, above 1136),
A logical downside objective such as the gap-and-support combo near 1070'4.
That simple trio turns a chaotic chart into a calm plan.
Contract specs matter too. The ZS contract moves in bigger bites:
Tick: 1/4 of one cent (0.0025) per bushel = $12.50 per contract
Margin: $2,000 per contract
The MZS (Micro Soybean Futures) contract takes smaller ones:
Tick: 0.0050 per bushel = $2.50 per contract
Margin: $200 per contract
Traders who want more precision sometimes choose the micro so their stop-loss distance and account size stay on speaking terms. Either way, the chart sets the idea, but the contract size sets the comfort level.
And of course, the golden rule in pattern-based trading: the market can still do whatever it wants. That’s why traders define their exit if wrong, their objective if right, and their size before clicking anything. A head and shoulders isn't about predicting — it's about organizing.
The chart example ties it all together: neckline break, resistance overhead, downside target below. Simple, structured, and practical — just the way traders like it.
Want More Depth?
If you’d like to go deeper into the building blocks of trading, check out our From Mystery to Mastery trilogy, three cornerstone articles that complement this one:
🔗 From Mystery to Mastery: Trading Essentials
🔗 From Mystery to Mastery: Futures Explained
🔗 From Mystery to Mastery: Options Explained
When charting futures, the data provided could be delayed. Traders working with the ticker symbols discussed in this idea may prefer to use CME Group real-time data plan on TradingView: www.tradingview.com - This consideration is particularly important for shorter-term traders, whereas it may be less critical for those focused on longer-term trading strategies.
General Disclaimer:
The trade ideas presented herein are solely for illustrative purposes forming a part of a case study intended to demonstrate key principles in risk management within the context of the specific market scenarios discussed. These ideas are not to be interpreted as investment recommendations or financial advice. They do not endorse or promote any specific trading strategies, financial products, or services. The information provided is based on data believed to be reliable; however, its accuracy or completeness cannot be guaranteed. Trading in financial markets involves risks, including the potential loss of principal. Each individual should conduct their own research and consult with professional financial advisors before making any investment decisions. The author or publisher of this content bears no responsibility for any actions taken based on the information provided or for any resultant financial or other losses.

XAUUSD(GOLD) BEARISH OR TRAP (READ CAPTION)Hi traders what do you think about gold
Gold (XAUUSD) is currently forming a bearish trade setup, showing weakness below the major resistance zone 4217–4230. This area has rejected price multiple times, indicating strong seller presence.
🔹 Resistance Zone: 4217–4230
This is the main bearish rejection zone.
As long as price stays below 4230, the market remains in a bearish bias.
Any retest of this zone can act as a selling opportunity for continuation moves.
🔹 Support Level: 4180
This is the first support level where short-term buyers may attempt to react.
A clean break below 4180 will confirm further downside continuation.
🔹 Demand Zone: 4150
This is the strong demand area where buyers are expected to become active.
If price drops into 4150, the market may show a bullish bounce, but overall sentiment remains bearish until major resistance breaks.
📉 Market Outlook
Below 4217–4230 → Market remains bearish
Break below 4180 → Opens the path toward 4150 demand zone
First target for sellers → 4180
Second target → 4150 demand zone
This structure shows a clean bearish retracement + resistance rejection setup, ideal for downside continuation trades.


META — Possible Macro Peak, Bearish Year AheadMeta may have completed its long-term C wave after reaching new all-time highs at the top of the macro channel.
The structure now shows emerging bearish sequences on lower timeframes , hinting that the next yearly cycle could be corrective or bearish rather than impulsive.
While the theoretical WCL sits far below (around 350–400), such a deep retracement would imply a 50% drop — an extreme but technical possibility.
A more realistic path could be a 20–30% macro correction as the market digests Meta’s extended rally and rebalances valuation.
Key Points:
Macro C wave completed at the upper channel boundary.
Lower timeframe sequences turning bearish.
WCL remains the ultimate downside target, though not the base case.
Expect a potentially bearish or corrective year ahead for Meta, within the long-term bullish structure.
Invalidation:
If price reclaims the 780–800 zone and breaks above the red B high, bearish structure fails.

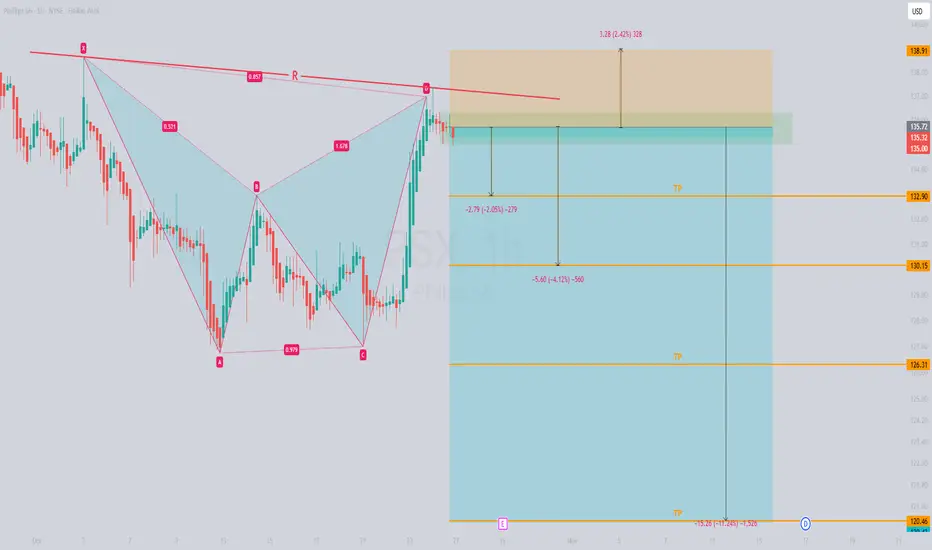
PSX (Phillips 66) Alert: Bearish Harmonic Setup Ready to Drop!🚀 PSX (Phillips 66) Alert: Bearish Harmonic Setup Ready to Drop! 🚀
Traders, eyes on the prize! 🔥 The finance card above shows NYSE:PSX (Phillips 66) carving out a textbook bearish harmonic pattern on the 1-hour chart, signaling a potential downward move. We’re expecting this stock to kick off a juicy bearish trend, but let’s hold tight until the U.S. market opens on Monday to confirm the action. 📉
📊 Setup Breakdown:
Timeframe: 1-hour – perfect for catching this harmonic wave.
Key Move: Price is poised for a breakdown from the harmonic pattern’s resistance zone. Watch for confirmation post-market open on Monday!
Stop Loss: Set at a tight 2.42% above entry – keeping risk in check.
Profit Targets: First TP at 2% profit – a solid, low-risk win with proper risk management. If this setup hits full throttle, we’re eyeing over 11% gains! 💰
This is a high-probability trade with disciplined risk-reward, so don’t sleep on it! Phillips 66 is primed for a move – let’s ride the bearish wave! 🐻
⚠️ Disclaimer: Not financial advice – always DYOR and trade smart. Stocks can be volatile, so manage your risk like a pro!
🚀 Epic Analysis + Signals? Follow NOW! ✅
📊 Craving a Golden Chart? Smash BOOST! ✅
💬 Got ideas? Drop a COMMENT – we reply to the best! ✅
Follow = Profits | Boost = Gold Chart | Comment = VIP Access! 😎
Your Gold is about to melt !Hey Traders!
Gold is showing similar pattern to its last bull market which lasted 10 years and followed by a bear market which lasted 3 years, well guess what ! We've just finished the 10 years for the current bull market and I think its the time to roach out xD
It might pump a little more but its definitely going down soon, after all any bull market doesn't last forever and 10 years is a lot of full market especially when we see a similar pattern in the chart History.
Stay safe and let me know what do you guys think about this ?

GBPAUD potential SELL setupBearish Breakdown Setup
Summary
Analysing Price action from yesterday we have got a very nice distribution leg push that broke down below our accumulation zone a good indication of downside momentum, therefore the anticipation is that price will retest our BOS an ideal zone to look for SELL setups.
📉 GBPAUD Daily Breakdown Potential setup
🔴 Distribution leg: 2.06875 - 2.05697
📉 Sell level: 2.06423 (Confirmed Break)
🎯 Target 1: R:R 1:2
🎯 Target 2: R:R 1:3
🎯 Target 3: R:R 1:4
🛑 Stop Loss: Above Resistance Zone
🔍 Watch: Break above resistance zone invalidates idea
LIKE or COMMENT if this idea sparks your interest, or share your thoughts below!
FOLLOW to keep up with fresh ideas.
Tidypips: "Keep It Clean, Trade Mean!"

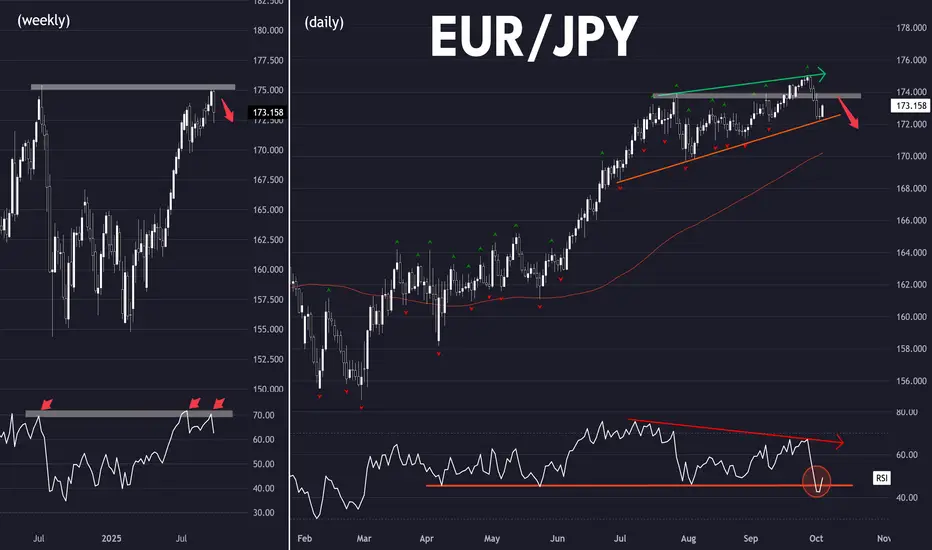
Getting in early on a trend reversal (EUR/JPY)Setup
Bearish: Potential long term top.
Bearish engulfing candlestick from multi-year highs
RSI has dropped from 70 overbought
Signal
Fakeout: Looking for rebound to stall near the former resistance at 174.
RSI bearish divergence, taken out support
Caution: uptrend line has held so far. A break would confirm trend reversal.
Too early to trade the reversal?
Would you weait for a breakdown first ?
Let's discuss
Ta, Jasper
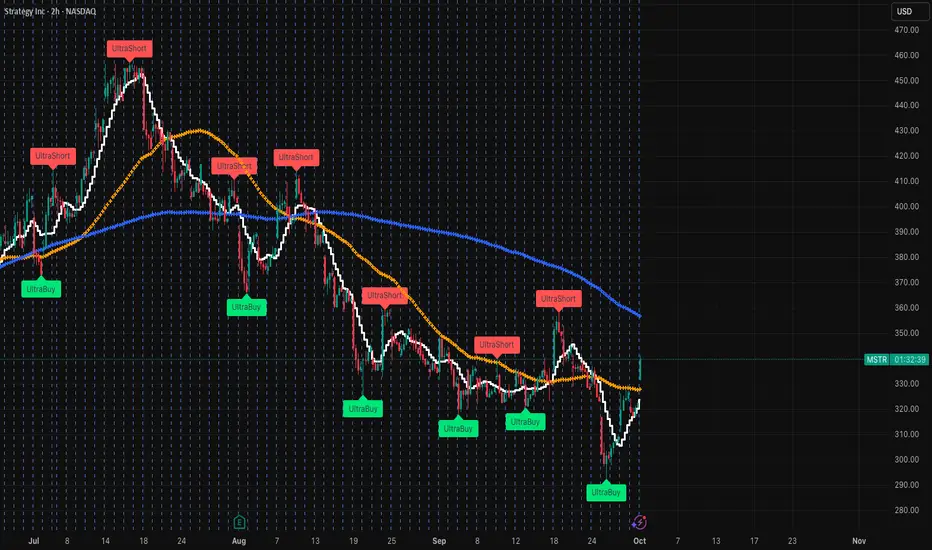
MSTR is still in a downward channelWhile it looks promising that MSTR is making some small gains, it's still in a very real downward channel. These type of gains are typically very short lived as many in this space are short term / profit takers. Technicals and soon UltraShort signals are confirm this, but would not bet the fam on any of this f&ckery!
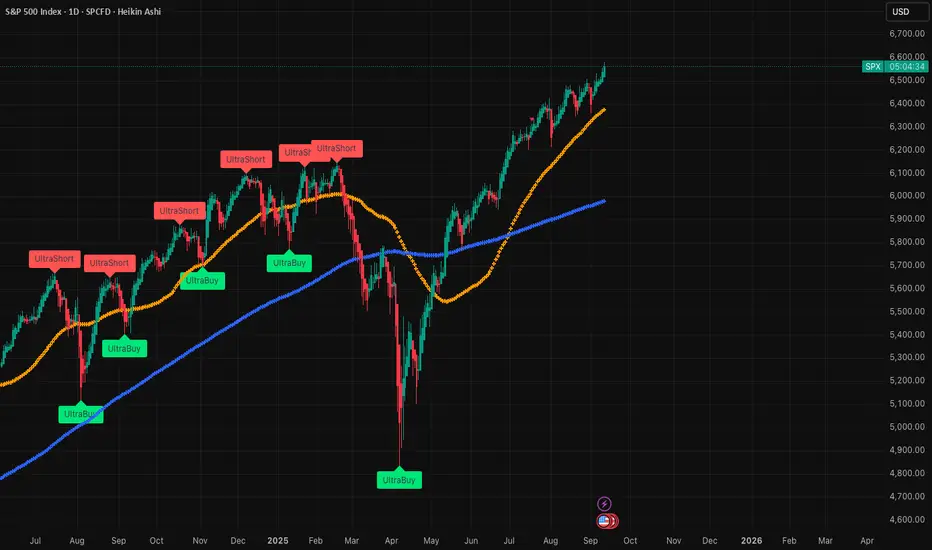
Bear trap....SPX to fall soonToday was somewhat decent, but let's not get too giddy! There's looming Gov shutdown on Wed and a few sizable calls on the VIX on the tape. We can see technicals showing a decline, at least in the short term, and I guess we'll see what happens post-Wed. One thing is for sure is that we are overdue a nice healthy pullback. Would not bet the farm on AI esp. with astronomical CAPEX, and highest concentration ever in the market. Best of luck!

Can't say I didn't warn you! BTC and VIXI hate to say it, but it will be worse than I thought! I've been telling folks to watch out as history repeats itself and the market is way too hot esp. in this crappy environment. There is more room to bleed. If you have a position, take the inverse like this second! CBOE:UVIX CBOE:MSTZ $ BTCZ could be nice plays

Pull back tease, but still bearing SPX!There's a bit of a pull back taking place, but I'm not buying it! There's a lot of f&ckery taking place and no lipstick will make this pig look pretty. Fundamentals are weak and volatility is spiking, long overdue! Nice inverse plays CBOE:UVIX CBOE:MSTZ

NFLX sell on OPEX (9/19)?Hmmmm.... well this is one that I'll be watching tomorrow.
Noted in the video that
* we broke down out of the rising channel; 2 rejections
* below RSI signal line & 50 mark
* double reject at fib .618
* bearish engulfing close
* OPEX tomorrow 9/19
so that's what i'm watching. happy trading to you.
be careful tomorrow.

Good time to get out of the MARKET (Too Heated)The market has never been this expensive and retailers are being the exit liquidity for whales / institutions. Almost like many people are just sitting a sipping away on an active volcano. The market could be jumping for a few days, but a rate cut confirms that the market is weak and needs a boost / help. Unfortunately, it's too little too late. Most macros show a clear sign of stress, which is not being reflected in the market (for now). Don't get too complacent...the VIX will spike at astronomical levels when the hammer falls. Best of luck!
Who's ready to lose money (again) on BTC?The ups and downs are becoming just to obvious at this point. BTC struggling to make substantial progress on the price moves now that major whales have moved on due to buying at the TOP. What could go wrong? Diminishing YoY returns, high transaction cost, doesn't solve any real problems, and ultra high volatility. Historically, we are due very soon for a major correction and BTC will very likely come down substantially (next support levels before 100k is around 70k). Not anti-tech or BTC! Just calling out technicals, fundamentals, and historical behavior with tulip-type of hype and have seen many many people lose money from BTC and digital assets (remember NFTs, FTX, Trump's coin that was rugged etc...). Proceed with caution, if you're up on BTC, just sell and park for a breather. There is no escaping macro trends and a big one is coming. We are not at levels not seen since the dot.com bubble, and this one will be harder.

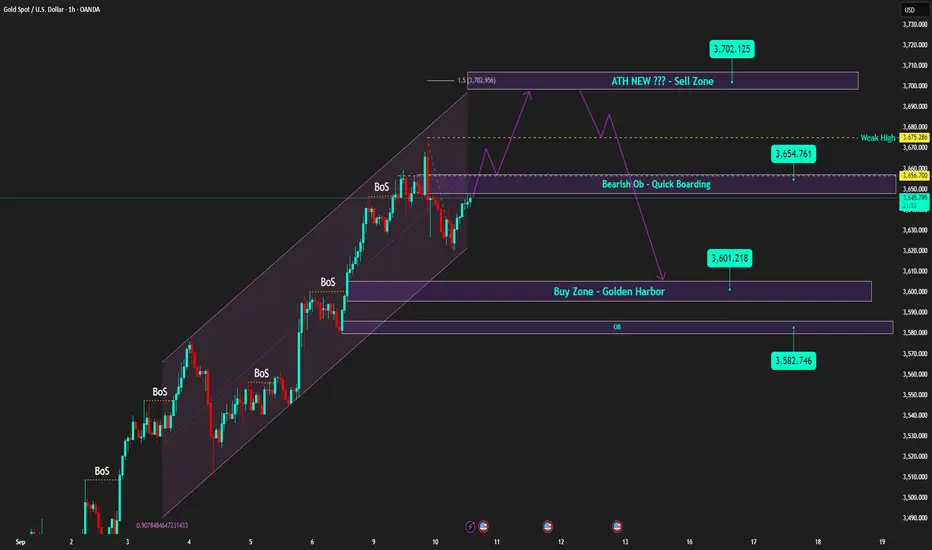
Gold - Caution ahead of US PPI report | Priority on Sell setups🟡 XAU/USD – 10/09 | Captain Vincent ⚓
🔎 Captain’s Log – Market Context
US 10-year bond yields rebound, signaling the market is awaiting key inflation data.
At 07:30, US PPI report will be released – a crucial figure that could strongly influence FED rate expectations.
Investors are also eyeing US CPI in the coming days to assess the inflation outlook.
The US Supreme Court accepted Trump’s appeal, but this news has not yet had a notable impact on Gold.
⏩ Captain’s Summary: Ahead of inflation data, Gold often tends to correct lower due to cautious sentiment.
📈 Captain’s Chart – Technical Analysis
Storm Breaker (Key Resistance):
Bearish OB: 3654 – 3660 (short-term upper cap)
ATH Watchtower: 3700 – 3702 (Sell Zone – possible new ATH test)
Golden Harbor (Strong Support):
Buy Zone: 3601 – 3602
OB Dock: 3582 – 3585
Currently, price is around 3640 – 3645, after a technical rebound from support. High probability that Gold will retest nearby resistance before a downward correction.
🎯 Captain’s Map – Trade Scenarios
⚡ Quick Boarding (SELL – Daily Priority)
Entry 1: 3654 – 3660
SL: 3668
TP: 3654 → 3650 → 3618 → 3610
Entry 2 – ATH Test: 3701 – 3703
SL: 3711
TP: 3688 → 3675 → 3665 → 365x
✅ Golden Harbor (BUY – Only at deep support)
Buy Zone: 3601 – 3603
SL: 3592
TP: 3610 → 3620 → 3630
⚓ Captain’s Note
“The golden ship faces turbulent seas today as it sails near Storm Breaker 🌊 (3654 – 3660) . Before the fierce winds called US PPI , sailors should prioritize dropping anchor with short-term SELL positions at resistance. Golden Harbor 🏝️ (3601 – 3603) remains a safe haven below, but only when the ship corrects deeply should it dock. On this voyage, Quick Boarding 🚤 is for scalp maneuvers, while the main current is still steered by the stormy waves of inflation.”
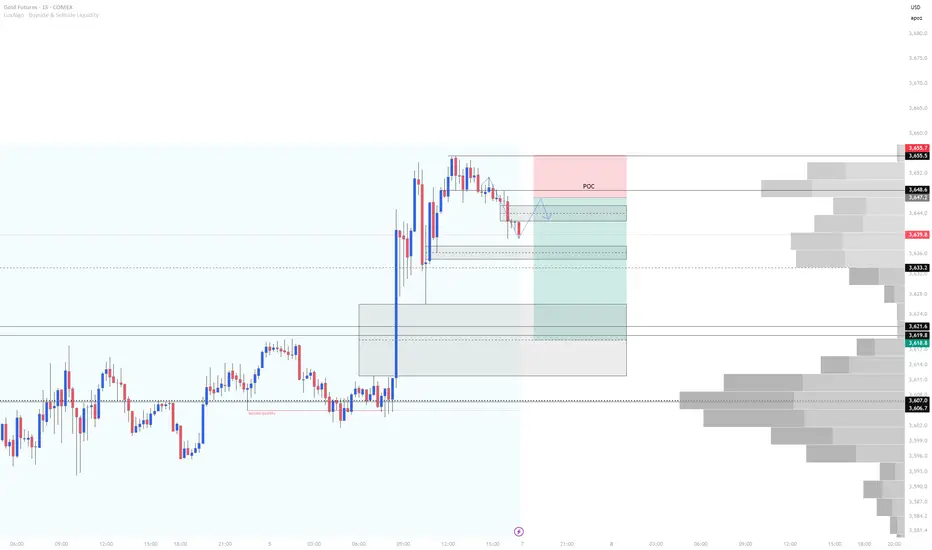
Gold Futures Short Into Asia 9/7/25Based on the current Fair Value Gap (FVG), Order Block (OB), and the liquidity resting below, I anticipate gold will retrace toward the Point of Control (POC) identified on the volume profile. This would provide an ideal setup for short-term selling opportunities during tonight’s PM session.
My expectation is for price to open lower, push into the 3658 range, and present a bearish entry signal. From there, I’ll be targeting shorts toward the equilibrium of the FVG around 3619, which also aligns closely with previous session highs and lows—adding confluence to the setup.
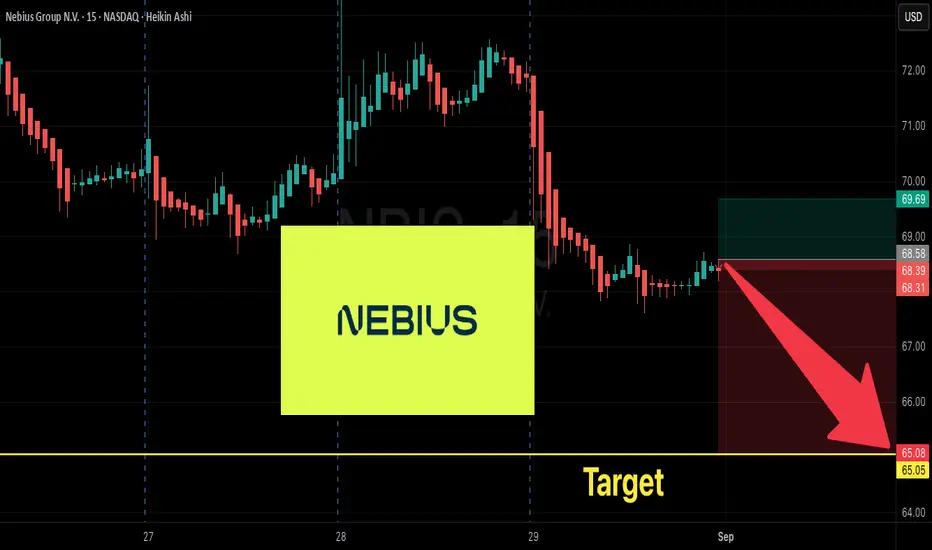
NBIS Weekly Put Alert | $65 Targeting Weak Momentum
# 🐻 NBIS Weekly Put Play? | Neutral-to-Bearish Setup (Sep 1, 2025) 📉
📊 **Summary:**
Most models see NBIS as **neutral-to-weak** this week — RSI falling, volume light, and options flow neutral.
👉 Only **Claude/Anthropic** calls for a bearish weekly put, citing overbought weekly RSI + weak institutional volume.
---
## ✅ Trade Idea (from Claude’s model)
* 🎯 **Instrument:** NBIS
* 🔀 **Direction:** PUT (Short bias)
* 💵 **Entry Price:** \~0.95 (accept up to 1.00)
* 🎯 **Profit Target:** 1.40 (+47%)
* 🛑 **Stop Loss:** 0.47 (–50%)
* 📅 **Expiry:** 2025-09-05
* 📈 **Confidence:** 65%
* ⏰ **Entry Timing:** Market Open
---
## ⚠️ Risks
* 🌀 Range-bound chop → premium decay
* 📉 Bounce risk near **\$67.25 support**
* 🕒 Time decay: only 4 days left
* ⚡ Gamma spikes → faster moves near expiry
---
## 📌 Consensus Call
* 🟨 **Majority models:** Stay sidelined (neutral view)
* 🟥 **Claude:** Take a small bearish shot with \$65 puts
---
💡 **Takeaway:**
This is a **high-risk, short-dated weekly play**. Most signals are neutral, but if you like fading weakness → this put offers a controlled risk bet. Position **small**.
---
\#️⃣ **Tags:**
\#NBIS #OptionsTrading #PutPlay #BearishSetup #RSI #WeeklyOptions #TradingSignal #MarketAnalysis #NeutralBias
$ES Futures: Bearish Breakdown Ahead? Short Setup Inside
## 🔻 ES Futures Bearish Setup: Shorting into Weakness (Aug 21, 2025) 🔻
### 🏦 Market Outlook
* 📉 **Bias:** Bearish sentiment dominates
* 🔎 **Tech drag** + weak momentum = downside risk
* ⚠️ Key support in focus: 6296–6298 zone
---
### 📊 Trade Idea (SHORT)
* 🎯 **Instrument:** ES Futures
* 📉 **Direction:** SHORT
* 💰 **Entry:** 6369.75 (near market)
* 🛑 **Stop Loss:** 6390.00
* 🎯 **Target:** 6300.00
* 📊 **Size:** 1 contract (\$50/pt)
* 💪 **Confidence:** 65%
* ⏰ **Timing:** Market Open
---
### ⚠️ Risk Watch
* 🌀 Low volume may cause chop
* 📉 Bounce risk near 6296–6298
* 🌍 Macro catalysts could shift flows
---
🔥 Hashtags for Reach 🔥
\#ESFutures #SP500 #FuturesTrading #DayTrading #SwingTrading #SPX #MarketOutlook #BearishSetup

SCENARIO STUDY: Bullish or Bearish?Hello fellow traders! Here’s a fresh, USD/JPY plan that blends 4-hour technicals with today’s macro/news flow, plus the most recent trader and bank sentiment. Time to get happy!
USD/JPY for Aug 15, 2025, U.S. morning/afternoon
4H structure: After a slide that tested ~146.2–146.4 support, the USD/JPY keeps running into 147.8 and 148.5 as notable 4H hurdles.
Macro/news today: U.S. PPI (July) surprised hotter, cooling talk of a 50 bp Fed cut (market leans 25 bp for Sep 17); Japan Q2 GDP beat aided the yen and BoJ-hike chatter.
BoJ backdrop: July meeting opinions/outlook show a cautious tightening bias and discussion of resuming hikes; 10-yr JGB around ~1.5%.
Positioning & sentiment (latest):
CFTC JPY (non-commercial) net longs have fallen from mid-July peaks to ~82k (Aug 8). Retail (spot) sits near 54% long / 46% short.
Banks’ bias (based on recent published views):
UBS CIO guides for USD/JPY drifting lower through year-end (~140 by Dec 2025) as BoJ tightens gradually, and J.P. Morgan Research also expects weaker USD into late-2025 (USD/JPY ~141 Sep, 140 Dec).
4-hour levels to mark
Support: 146.20–146.40, then ~146.00 (deeper swing shelf).
Resistance: 147.80, 148.50 (recent 4H/spot pivot and swing high).
Scenario A — Bullish (rebound off support / corrective pop)
Why it could play out: Hotter U.S. PPI trimmed aggressive-cut bets; if incoming U.S. data/fedspeak doesn’t further dent yields, a corrective USD bounce can lift price from support toward overhead supply! Go Bulls? :D
Bullish Plan (4H execution):
Entry: 146.40–146.70 on a 4H bullish candle or RSI divergence near S1. (Structure band per the 4H map.)
Stop: 145.95 (clean break of the lower shelf).
Take Profit 1: 147.80 (first supply).
Take Profit 2: 148.50 (recent high / strong supply).
Respect Supports: 146.40–146.20, then 146.00.
Resistances to fade/scale: 147.80, 148.50.
Indicative R:R: from 146.60 risk ~65 pips to stop for ~+120 pips to TP2 (≈1:1.8), +120–190 pips if extension through 148.5.
Scenario B — Bearish (trend continuation from resistance)
Why it could play out: 4H downswing remains intact below 147.8/148.5; BoJ tone leans cautious-hawkish, Japan data firmed (GDP), while CFTC shows less crowded JPY longs (reduced squeeze risk). UBS/JPM public pieces lean medium-term lower USD/JPY.
Bearish Plan (4H execution):
Entry: 147.80–148.00 on a 4H rejection wick / failure swing at R1.
Stop: 148.60 (invalidate above R2 swing high).
TP1: 147.00 (recent intraday base).
TP2: 146.20–146.40 (key 4H demand).
Resistances to lean on: 147.80, 148.50.
Supports to target: 147.00, 146.20–146.40, then ~146.00 if momentum accelerates. Go Bears? :D
BUT WAIT..... Which is more probable now?
As for the team here at How To (dot) Forex, we are collectively leaning bearish (Scenario B) over the next few sessions. And, here is why....
Structure: Price remains capped beneath 147.8/148.5 on the 4H map.
Macro skew: Hot PPI pared back “big cut” bets but markets still favor a 25 bp cut; meanwhile Japan GDP beat + BoJ talk of possible resuming hikes is JPY-supportive.
Sentiment: Retail near 50/50 (slight long) and CFTC net JPY longs off the highs → fewer asymmetric squeeze dynamics for upside USD.
What are the banks saying?
Recent UBS and JPM predictions point to lower USD/JPY into year-end, aligning with fade-rallies bias unless price reclaims R2 decisively.
_________________________________________________
OPINION AND COMMENTARY:
we prefer fade-rally shorts into 147.8–148.0 unless a 4H close above 148.5 flips bias. If you see a strong 4H basing signal at 146.2–146.4, the bullish corrective setup is valid — just keep targets conservative at 147.8/148.5.
If you have questions, or want to see a specific type of analysis not presented here, leave us a comment below. Thank you for reading. We appreciate your support. Happy trading!
_________________________________________________
DISCLAIMER: This analysis was conducted by our in-house team of multi-level traders. We are not responsible for any losses you may incur. Always do you own research before trading. If you are new to trading, consider practicing with a free paper trading account. Ask your broker for details.

TRADE PLAN: Bulls vs BearsHello, fellow traders! We've created a 2-scenario trade plan based on the most recent technical, macro, and trader sentiment using 4 hour charts - because we love you!
1. BULLISH SCENARIO — rebound from support
Price is oversold on the 4H RSI and nearing key support (146.4–147.0). Fed easing expectations are already priced in, so any upside surprise in U.S. data, or lack of follow-through selling, could trigger a corrective rally.
TRADE PLAN:
Entry: 146.40–147.00 (look for a 4H bullish candle or RSI divergence confirmation)
Stop: Below 146.00 (clear break under the next support cluster)
Target 1 (Partial trade plan): 147.80 (local resistance)
Target 2 (Full trade plan): 148.50 (Aug 12 high)
SUPPORT LEVELS:
Support 1: 146.40–147.00
Support 2: 146.00
RESISTANCE LEVELS:
Resistance 1: 147.80
Resistance 2: 148.50
RISK/REWARD: ~1:2 from midpoint entry (146.70), risking 70 pips for 140 pips potential.
__________________________________________________
2. BEARISH SCENARIO — continuation lower
The pair remains in a short-term 4H downtrend after failing above 148.5. Softer U.S. CPI reinforced Fed cut odds, while Japan’s inflation remains >2% with a mildly hawkish BoJ bias — supportive for yen strength.
TRADE PLAN:
Entry: 147.80–148.00 (sell into a retest of broken support / 4H resistance)
Stop: Above 148.50 (invalidated if breakout above Aug 12 high)
Target 1 (Partial TP): 147.00 (intraday swing low area)
Target 2 (Full TP): 146.00 (deeper swing support)
RESISTANCE LEVELS:
Resistance 1: 147.80
Resistance 2: 148.50
SUPPORT LEVELS:
Support 1: 147.00
Support 2: 146.00
Support 3: 145.80
RISK/REWARD: ~1:2.5 from midpoint entry (147.90), risking 60 pips for 150 pips potential.
_________________________________________
PROBABILITY ASSESSMENT (based on our most current data)
Bearish case is slightly more probable near-term because macro backdrop favors JPY (BoJ gradually normalizing, U.S. rate cut expectations rising).
Price action still in 4H downswing with momentum (MACD) negative and resistance overhead. CFTC data shows yen longs reduced — less chance of a squeeze higher on short-covering. That said, oversold conditions mean bullish bounces are possible, but likely corrective rather than trend-changing unless U.S. data turns hawkish again.
We hope you found our analysis helpful and thank you for reading. Follow us here on TradingView for more up to date analysis. Happy trading!
__________________________________________
DISCLAIMER: Our analysis is not 100% absolute. We are not responsible for any losses incurred. Please be sure to do your own research before investing or trading.
