Bitcoin and Ethereum Likely To Move Up Before More DownTrading Fam,
Both BTC and ETH have broken major support levels to the downside. We are likely to see price move up to retest this previous support (now resistance) before further price movement to the downside resumes.
Take care.
✌️Stew
Bearish Trend Line

Bitcoin Crash Analysisits the same chart like last time in may that i uploaded when everyone was bullish i was bearish and here we are my words came out you can check my last btc analysis and since may i called bearish

Praj Industries - Looks Bearish Praj Industries - Looks Bearish, Looks like moving towards 250 levels.

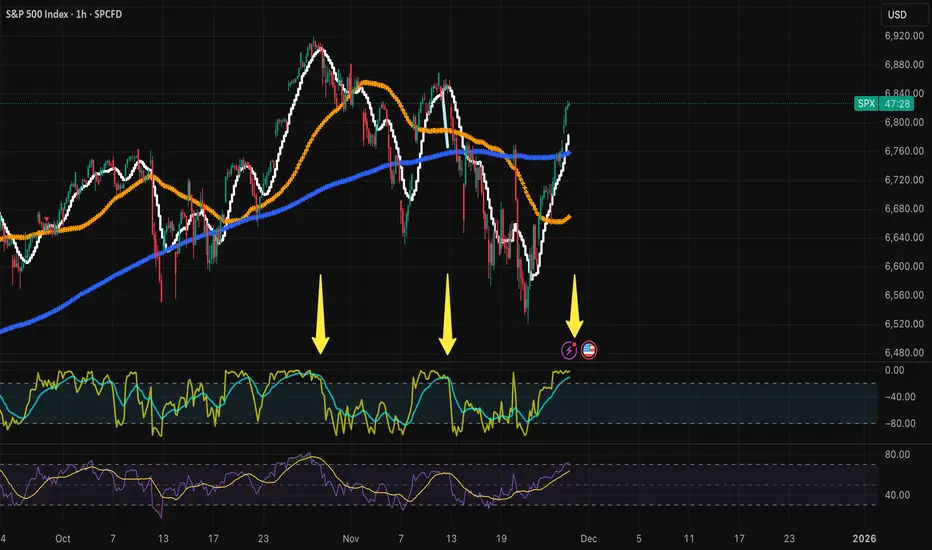
Rising Wedge Pattern S&P 500There is clear a Rising Wedge Pattern formed on S&P 500 4h chart .
There was even a retracement from all-time highs of 6979 back inside the wedge before the weekend.
My suggested SL is 7030-7050 and TP 6500-6550 for the short-to-mid term.
On a larger scale, there is also a huge channel that we are testing the top of right now:
Going all the way back to 2008..
It could easily end up like this:
So for longer term I can see 6100, 5500, 5000 and if recession hits than even 3500.
There has never been such a major Fed hiking and cutting cycle that did not eventually cause a recession. Also, the labor market is weaker than the headline numbers make it seem. Lots of massive downward revisions on NFP. Even the unemployment number is growing slowly, mostly because Labor Force Participation is dropping. If we account for that, then the real unemployment rate is more like 5.5%.
Here are some more examples of rising wedges going back to the pandemic:

XAU/USD | Bearish When $4,425 Confluence Support Is Breached⚡Critical Confluence Level ($4,425)
⚡Key Support: The $4,425 level is currently a key focus as it represents the confluence point between the 100-hour SMA and the 38.2% Fibonacci Retracement of the recent price rally.
⚡Breakout Scenario: If the price closes decisively below this level, it is expected to trigger further technical selling, which could drag Gold down towards the psychological level of $4,400.
⚡Stability: Holding the price above the 38.2% level is crucial to stabilize the faltering market sentiment.

ETH/USD: Repeated Death Cross Patterns Signal Major CorrectionOverview
This weekly (1W) chart of Ethereum (ETH/USD) highlights a recurring bearish phenomenon. By disabling the candle wicks, the focus shifts strictly to closing prices and structural trends, filtering out market noise. The primary thesis is that Ethereum is entering a significant downward phase triggered by a "Death Cross."
Key Technical Observations
The Death Cross Sequence: The chart identifies three distinct "Death Cross" events (labeled 1, 2, and 3). This occurs when a shorter-term moving average crosses below a long-term moving average, signaling a shift in momentum from bullish to bearish.
Death Cross 3 (Current): We are currently witnessing a new crossing at the local peak. Historically, as shown in previous circles, this has led to substantial price devaluations.
Price Projection: A white arrow indicates a projected path downward. This suggests that the current rejection from the resistance level is likely to lead ETH toward the long-term ascending support line (the blue trendline at the bottom).
RSI Divergence: The Relative Strength Index (RSI) at the bottom shows "Bear" labels, indicating bearish divergence or overbought conditions that have failed to maintain upward momentum. This confirms the exhaustion of buyers.
Target Zone
The analysis suggests a move toward the primary support trendline, which has been holding since 2022. Depending on the speed of the drop, the target area sits roughly between the $2,000 and $2,200 levels.
Conclusion
The structural setup is heavily bearish. Unless ETH can reclaim the moving averages and invalidate the cross, a retest of the multi-year support line seems inevitable.

Silver continues to drop....I told you soSilver is moving in a downward channel. The reasons are obvious 1) China sets export limits 2) exchange set higher margin requirements 3) let's look at every single jump in silver historically: it has always ended up in a massive crash! Listen to mainstream and just like pigs you get slaughtered! I could be wrong, but mostly right :) this won't end well and the market will correct itself. Remember that precious metals was the last bastion of "getting back to fundamentals" because of inflation and decreasing value of the dollar.
I typically take ETF inverse positions because the economy is full of f&ckery and don't believe there is an upside. Best of luck!

Gravity is strong in the market, don't be fooled. Crash coming!We've established that the AI is hype and circular economics doesn't necessarily help the largest company in the world and it's trading down atm. Now people are rotating to precious metals because the level of trust is so low that surely silver should only go up, right? WRONG!
It's not in the best interest of banks / exchanges and as I've mentioned correctly all along, silver will go down and so will gold. Maybe not permanently, but definitely not going up in a straight line and uncertain on the timing, but there will be a lot of hurting and damage in the economy in 2026. If you're up, sell! That's why Berkshire is doing and they are typically smarter than most retail investors.
Best of luck and happy 2026!

Silver has never had a YE close above $31..we'll seeWe are getting into a nasty downward channel, and historically SLV tanks quite hard after reaching ATH. What supports this? 1) It's already dropped 10% yesterday, what we're seeing are dumb retailers chasing FOMO. They will always be exit liquidity! 2) China new restrictions, they process 40-50% of all silver globally - kinda a big deal. Maybe silver act of 1934 is coming back to haunt us (boo!) 3) History repeats itself, it tanks every single time historically. You can talk yourself out of it, but there simply isn't enough silver to go around and banks will do everything to save themselves at your expenses 4) exchanges adding force majeure language so they can save themselves on Dec 26th while people were chilling at home with their families. What does this mean? They don't need to honor the market / spot prices and you are NOT buying physical silver that's for sure. There's a lot of f$ckery happening....the only opportunity here is ZSL IMHO
Best of luck...PS I called this out weeks ago, and still believe that we are going to continue going down. Target around $50 and I'm being conservative.

Silver crash....I told you this would happen!Silver has been ripping up with little resistance. However, silver is a physical good so when supply is restricted it doesn't mean it's scarce, it means that trust is broken esp. now that China is restricting exports. Why does that matter? Well, they process about 40-50% of all silver globally - kinda a big deal! What else? new capital requirements and force majeure meaning that they don't need to honor spot / futures prices anymore. Historically, silver has crashed every single time very aggressively. Next resistance level is sitting anywhere between $50-60 and I'm being conservative. ZSL is a nice play to take advantage of this situation.
Best of luck!

Double top....TSLA going downBeen watching this for a bit and when I see this level of volatility and double-top forming, we can see that it will drop like a hammer soon. Take TSLZ (inverse). Do your own research! I just made 27% on my last trade, I eat crayons :)

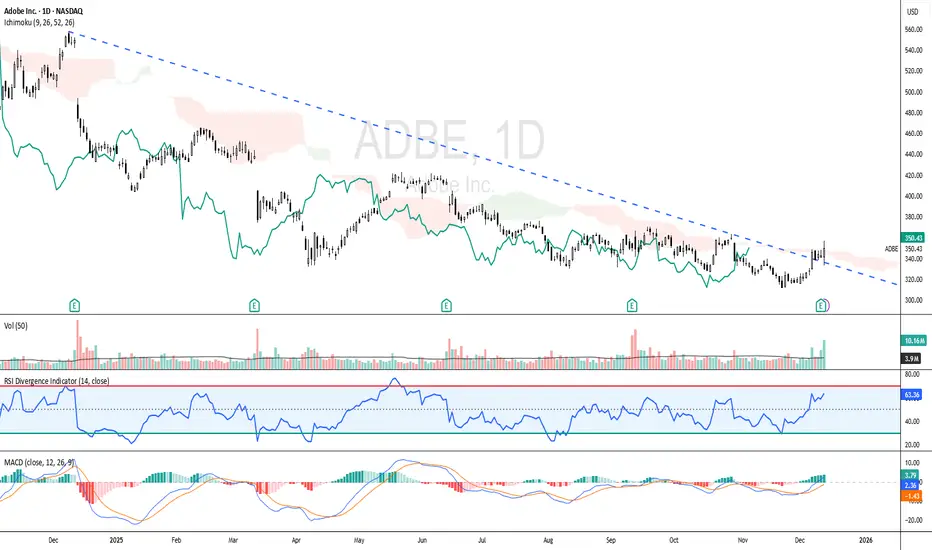
ADOBE - Short-term Bullish SetupADBE - CURRENT PRICE : 350.43
🔼 Short-term bullish outlook as price breaks above the downtrend line, signalling a potential trend reversal. 💪 RSI remains bullish above the mid-line, while MACD shows a positive crossover 📈, strengthening the upside momentum. ☁️ The Ichimoku Chikou Span (green line) is now above past candlesticks, supporting a shift toward bullish sentiment. Increasing volume on the breakout indicates strong buyer participation. If momentum continues, upside targets are at 170 and 190, with 130 as the key support to monitor.
ENTRY PRICE : 348.00 - 350.43
FIRST TARGET : 170.00
SECOND TARGET : 190.00
SUPPORT : 130.00
ZEC - HYPE IS OVERPrivacy narrative Hype is over on CRYPTOCAP:ZEC 🚨
Money rotation ongoing & HTF momentum is shifting.
After the 2000%+ bull wave, Seeing Another 20 to 40% bearish correction wave looks more than realistic📉

CRM - Minor Downtrend Line Broken!CRM - CURRENT PRICE : 260.57
CRM previously entered a downtrend following a double-top reversal , which pushed the stock into a prolonged bearish trend. However, current price action shows early signs of trend change as CRM successfully breaks above the minor downtrend line with strong momentum.
Momentum indicators are confirming the shift:
⚡RSI has turned bullish and moved decisively above 50
⚡MACD shows a bullish crossover with improving histogram
With improving trend structure and bullish indicators, CRM may continue its upward recovery. Price may extend toward 278.00 and 296.00 as long as it stays above 242.00 (near EMA 50).
ENTRY PRICE : 260.57
FIRST TARGET : 278.00
SECOND TARGET : 296.00
SUPPORT : 242.00

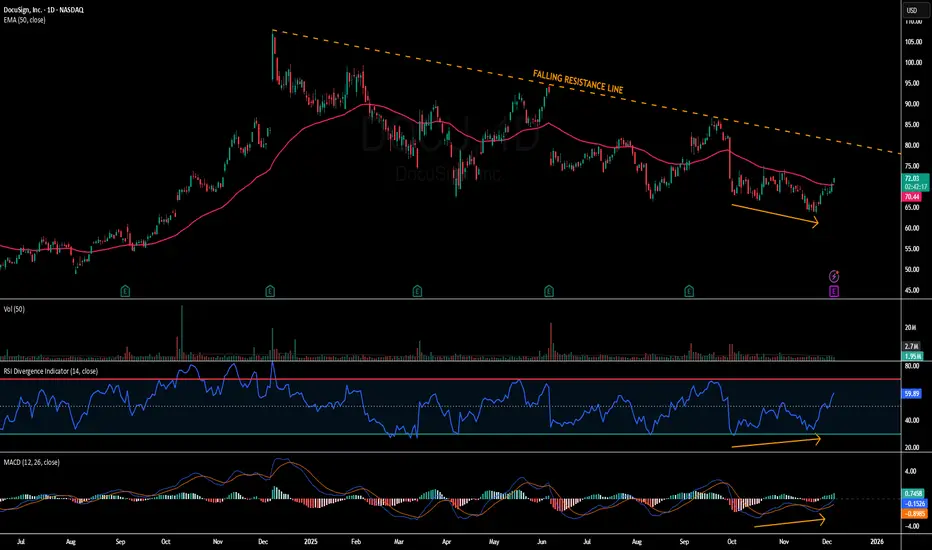
DOCU - Trendline Resistance in FocusDOCU - CURRENT PRICE : 71.87
Short-term outlook for DOCU is bullish as price moves above the EMA50, supported by RSI holding above 50 and bullish divergence in both RSI and MACD (look at orange arrows). Momentum continues to improve with a MACD bullish crossover, positioning DOCU for a move toward the long-term downtrend line. First target is $79 near trendline resistance, with a potential extension to $85, while $65 remains the key support and invalidation level.
ENTRY PRICE : 70.00 - 71.87
FIRST TARGET : 79.00
SECOND TARGET : 85.00
SUPPORT : 65.00
BTC pump is a short squeeze....watch outNo one is buying the "dip" esp when it's on a massive downward trend. What we're witnessing is a classic short squeeze, which won't last long. Do not expect this to keep just going up because it likely won't and back to low 80k or below. Best of luck and always do your own due diligence!

Bulls don't get too comfortable....fundamentals still not goodHave been tracking the swings recently and macros and it's worth noting that the fundamentals of the economy are still weak. The upcoming rate reduction is already priced in, and it won't change the employment / defaults / private credit environment and inflation. Expect a dip very very soon and red across the board. The economy is being propped up with hot air and it's just not sustainable. All the macros are screaming red and people are ignoring until it's too late.
#SQQQ could be an interesting hedge, but would pull out now from any long positions as the AI bubble is showing big cracks and people are deciding to look the other way until they get wiped out.
TAO - Bearish structure GETTEX:TAO - update:
Im also bearish here 📉 - Bearish channel
Support looks weak, buy pressure is absent.
Monthly view looks pretty scary, and lower Key demand zone might be visited again 📉
Medium term: 210$ - 205$ support likely 🎯
Key resistances :
295 - 310 - 340 - 460 - 510

Bitcoin Daily Analysis #13 – November 17, 2025Welcome to another Bitcoin analysis — and apologies for the delay.
As we can see, our bearish scenario has strengthened, and on the daily timeframe, BTC has officially turned downward 📉.
It’s still unclear whether this move is just a correction wave or a full trend reversal, but based on the candle volume, there’s potential for deeper pullbacks ahead.
If Bitcoin reclaims the 106,000 zone and holds strongly above it, the bullish outlook can return 🔄📈.
But if we get rejected from this level once more, we can safely say the trend has shifted into a clear downtrend.
There’s solid buying orders around the 90,000 zone, and we need to see how price reacts there.
A break below this level would make the bullish scenario much harder to achieve 🚨.
Additionally, after building a consolidation box in this region — or waiting for clearer structure — there may be an opportunity to take a short position 📉🟥.
Disclaimer:
This content is for informational purposes only and does not constitute financial or investment advice. © DIBAPRISM
Larry D.Kohn

XRP - BEARISH XRP - price update: 🟥
Double top MOTHLY - Deeper correction awaited?📉
Bearish breakout loading! ? 🟥
Very neutral on each time frame.
The 2.100$ weekly support is holding for now.
I don't like the weekly / daily configuration, hence I anticipate a bearish breakout to visit the SSB weekly (monthly support) around 1.90 - 1.880$ 📉
Technically:
The 50% fib support W/M has been tested many times.
It looks like a slow descending channel (bearish accumulation to me) 📉
A Weekly candle close under 1.90$ could be pretty bearish! 🔴
🎯Medium term outlook:
📉Bearish setup and key levels in my charts
Long term play:
📈Overall, I remain bullish above monthly uptrend and 1.600$ demand zone. A breakout under 2.00$ could lead to a sharp correction toward this level! 📉
💡Keep in mind that Liquidities from #XRP could outflow into others #ALTS. (money rotation from large cap to low caps).

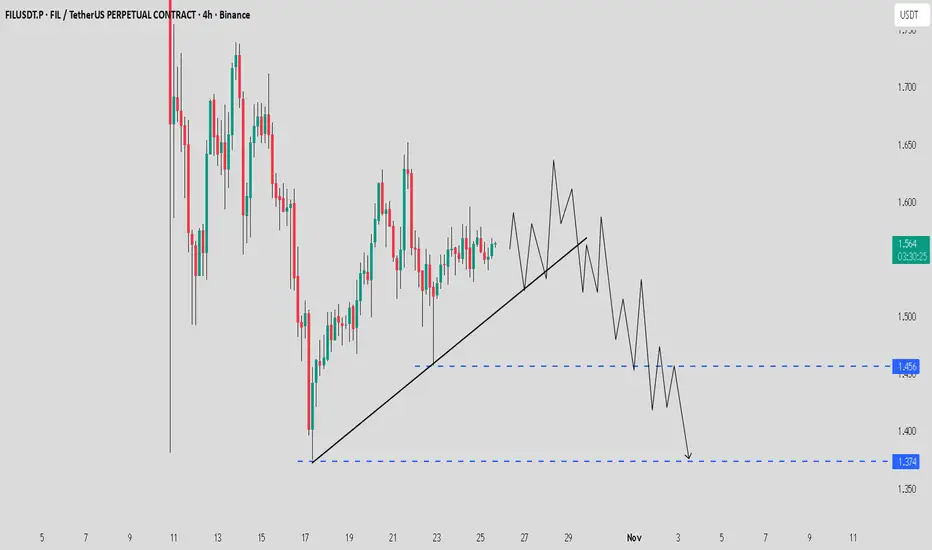
FIL / USDT Eyeing liquidity zone- Possible Reversal setup AheadFIL is showing signs of weakness and appears to be seeking liquidity below the $1.45 – $1.37 zone. If price dips into this area and absorbs liquidity, a potential reversal and trend shift to the upside could follow.
Stay patient, manage risk wisely, and watch how price reacts around the key liquidity zone.
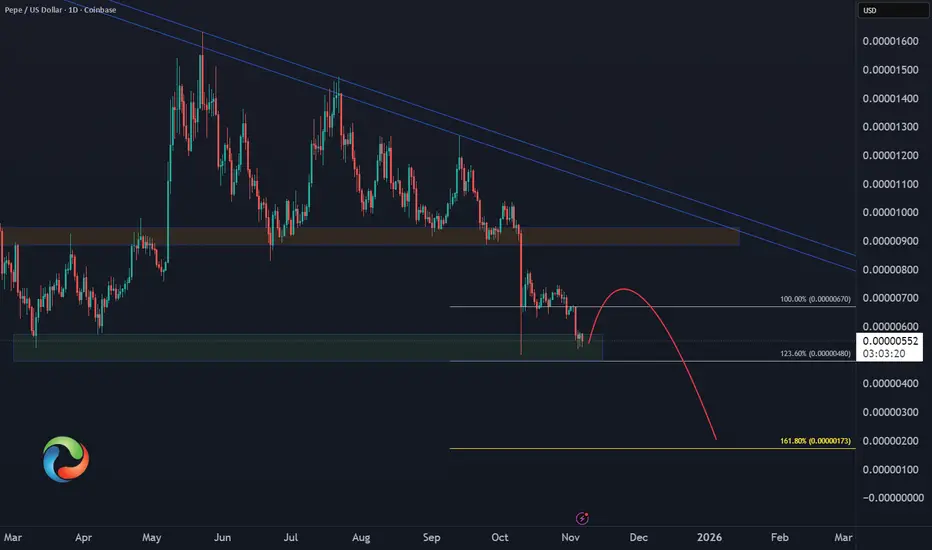
PEPE – Relief Rally, Then More Pain?CRYPTO:PEPEUSD is still testing the 2025 lows, which could trigger a short-term bounce in the coming weeks. However, unless the rally breaks above the October high, the structure suggests this is just a corrective move before further downside resumes.
📉 Key Levels to Watch:
Support: 2025 lows – potential bounce zone
Resistance: October high – likely cap for relief rally
Outlook: Bearish continuation favored unless bulls reclaim key resistance
BTC to fall below 100kNot something to celebrate, but I've been saying this for months now. BTC will fall and very hard. People are just not used to this level of volatility. All key technicals have been broken. It might wiggle back some, but it's pointless. If you're up, get out now as it will continue to bleed. Wait for real momentum and always trade with the flow NEVER against it (like now).
Hedging strategies....BTCZ / MSTZ. Always do your own DD :) Best of luck.
