Beartrap

Bitcoin Video Update - ⚠️VOLATILITY ALERT⚠️Updated video on Bitcoin.
We have had a 'nice' combination of Bull Trap-Bear Trap with the price going sideways and scaring away buyers and sellers but volatility is about to kick in.
Take a look at the video and let me know your thoughts.
the FXPROFESSOR

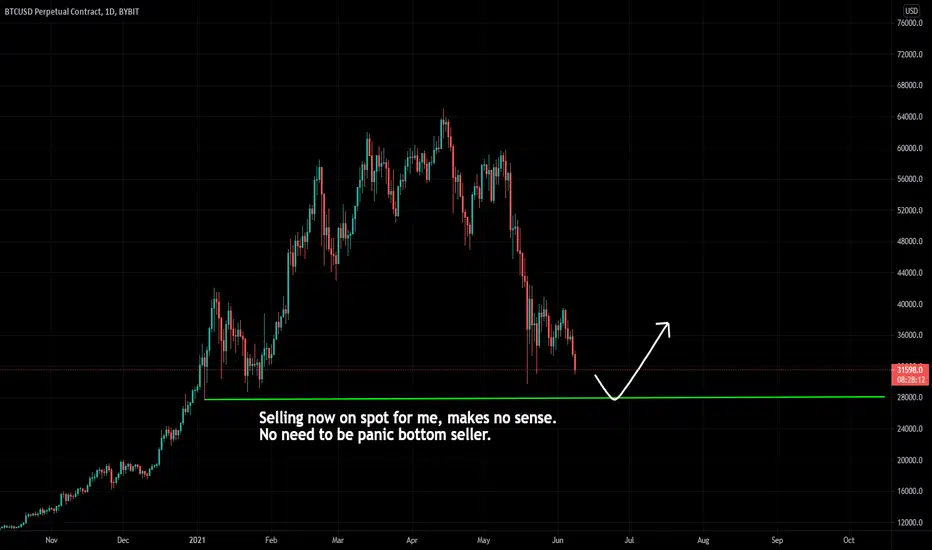
I believe this is not bear marketEven after 50% + correction i believe this is not end of bull market. If we zoom and look at daily chart we can see clearly wyckoff theory and manipulated move. I believe whales are just trying to panic newbies and retail to sell. Miners are still not selling, stock to flow is showing to us this is not end or even close to peak, a lot inflow of stable coins to exchanges, a lot of adresses more than 1000+ bitcoins are adding more. I refuse to sell in this dip even if this is beginning of bear market. I believe we can reach $200-400k range in middle of 2022 per bitcoin. I think this is just bear trap before real gains.

Quick BTC Update - Buy the dip?!Here's a quick update on BTC 4 hr chart. As we can see, the price is right now in a falling channel which also represents the current downtrend. The 30k level is very important to hold - if it breaks, then we are looking for some support at 27k and then some bigger support at 24k level. When we break the falling channel, the price will probably go back up.
In every bull run, you have these 40-50% pullbacks and they are the beginning of new big uptrends. BTC will probably go to 80k in its next big run up, and those who aren't buying this dip, will regret later (Not Financial advice!).
BTC will rise again and we might not see these current prices for a long time when BTC goes back up.
The bull market is not over yet - the historical data doesn’t show that the bull market is over.
And what if I told you that the whales are smarter than you? They are pushing the price down by spreading some FUD, so that they can buy cheap.

BTC Turns bearish on Daily - ShortBitcoin has dropped below the 20week and 200day moving averages for the first time since April 47th, 2020. With a triple bearish divergence, a break of the pitch fork trend and floating below the 20wk MA..I cannot help, but read this as bearish in the short term until we secure a weekly close back above the 20wk MA. Not sure how much lower we could go, there is no telling. How much longer until we reverse, unsure. Is this the end of the bull run? I don't want to believe so, but you cannot deny the chart. There is aways time to return when the whales give us a bullish sign that things are reversing, but I don't see on the chart right now. I remain bullish in the LONG. This is not financial advice, It is only my opinion.

Bitcoin My chart update from July 2020.
Bitcoin touched the 200 ema after months without enough strength to break it. this may have been a good buy point to continue the bullrun, if bitcoin break 200 ema bullrun ending for me

GBPCHF a bear trap 🦐GBPCHF after a few tests of the support area attempt to break below creating a bear trap with a false breakout.
The price is now moving in a bullish price action and according to Plancton's strategy if the market will break above the resistance area we will set a nice long order according to Plancton's strategy.
--––
Follow the Shrimp 🦐
Keep in mind.
🟣 Purple structure -> Monthly structure.
🔴 Red structure -> Weekly structure.
🔵 Blue structure -> Daily structure.
🟡 Yellow structure -> 4h structure.
⚫️ Black structure -> <4h structure.
Here is the Plancton0618 technical analysis , please comment below if you have any question.
The ENTRY in the market will be taken only if the condition of the Plancton0618 strategy will trigger.

Begginer guideLets take a look and debate if this is valid. Bear trap is questionable. Only for begginers like me, but every comment will be apriciated!


YMM2021. Possible Bull Trap happening now.Price is looking like it's responding better to bull sentiment at the moment, but there was a massive selloff on high volume, followed by a responsive move on relative low volume. Now price is back at the area of the moveout. I feel like this is a bull trap, and I think Dow is about to get slaughtered.
This might not happen. But, wouldn't it be cool if it did?

We told you this was happening to BTCWell it happened as predicted. You can refer back to this graph that we told you nobody else was showing you. The break down is currently touching exactly on the break down points we charted over a week ago. This all for informational purposes only, but we give you the tools to make very good informed decisions. We are still in a bull market and as has happened before we see massive corrections and bounces to the upside. All weak hands will be shaken out here. We need to watch to see what price action does from here to chart out the next moves. Make sure to share this chart and like it so we can keep providing them to you for free. HAPPY TRADING.


Expanding Megaphone to break UpChart says all. Bear Trap forming, don't get caught!
Indicators are rising, probably got a retest dip to the TL and then bounce like mad. Be ready!
Trade at ur own risk, not advice; GLTA!

Bear trap?! Can it bounce here?! Stay Tuned!!Chart says all. IF price follows Jan pullback form, we gonna get a strong bounce to new ATH from here. Else; The End...
NB: An EW impulsive wave completed in MFI outflow on 2/25; RSI could bounce from its TL here, might be a Bear Trap.
IF price is in Bear Impulsive Trend, ship is goin down bowfirst. We had both Bear and Bull traps twice this week already!
Trade with care! Do not leave positions unattended!!
NOT advice, trade at ur own risk, GLTA!!!

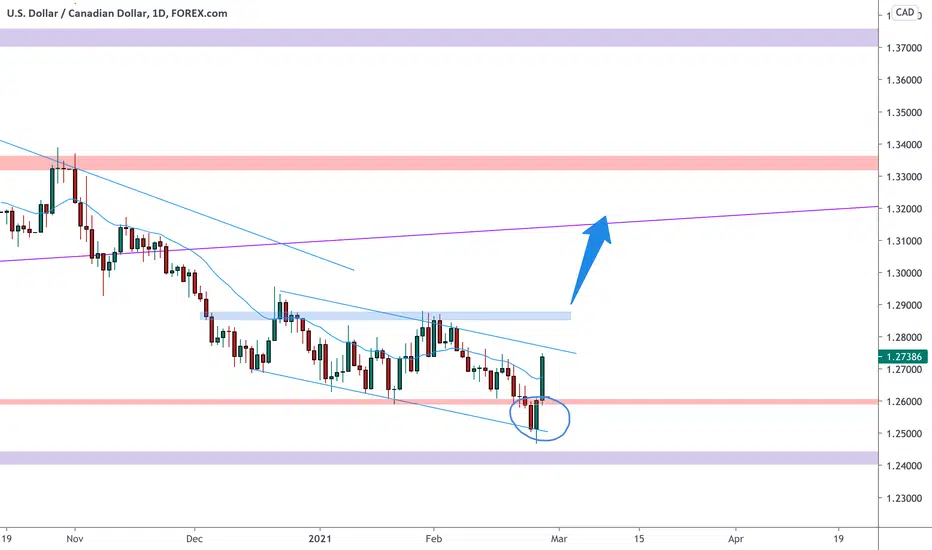
USCAD on a false breakout 🦐USDCAD after the false breakout below the weekly support moved back above and close the weekly candle with a double bottom higher close candle formation.
The market is moving inside a minor descending channel and now is testing the upper trendline.
According to Plancton's strategy, if the price will break above during next week, we can set a nice long order.
–––––
Follow the Shrimp 🦐
Keep in mind.
🟣 Purple structure -> Monthly structure.
🔴 Red structure -> Weekly structure.
🔵 Blue structure -> Daily structure.
🟡 Yellow structure -> 4h structure.
⚫️ Black structure -> <4h structure.
Here is the Plancton0618 technical analysis , please comment below if you have any question.
The ENTRY in the market will be taken only if the condition of the Plancton0618 strategy will trigger.
NOIA/BTC - Buy ItThis is a bear trap. The price is going to blow up when purple resistance is broken.
Don't miss out
Thanks

Bitcoin in 2021Here I take two previous, patterned moves from 2017 and fit to current structure (fractal around June 2017). This gives me the ability to approximate its growth or decline over the next year. I then use these two situations to plot a general trajectory (dotted line). Finally, I estimate the curve for the 21 week moving average.
I foresee the possibility of a drop down between the 50 day and 100 day moving average on the daily time chart. My target buy region is between $30K and $26K.


Syntropy - UpdateI've already made a few posts on NOIA. If you haven't seen them, go check them out
NOIA has formed a big head and shoulders top. Its a bearish pattern, However, I am still going to add to my long position.
I think this pattern is going to fail and result in a bear trap that will launch the price much higher. The last rally came after a bear trap and I think its going to happen again.
Thanks

ETH/BTC - Bear Trap??Im really torn here. I have re-entered a small long position that I plan on holding onto for the remainder of this run. ETH is one of the few alts that I own right now. I've sold most them for BTC.
With that being said, I am still leaning bullish. We will see.
Thanks

BTC/USD - Bear TrapBitcoin looks very over extended right now. I think it still has room to run, but I am not adding up here. I think its going to retest 20K at some point. Altcoins are a better bet right now. Especially ETH.
Price Target - $25,400

XAUUSD Roadmap II
Update to the original post.
Price pushed up more impulsively for the first wave than originally expected, so the pullback down to 1817 should be sufficient to generate fuel for the next push up.
Today's intraday fed-induced short-covering seems like a spark for another push.
