FireHoseReel | BNB Daily Analysis #19🔥 Welcome To FireHoseReel !
Let’s dive into BinanceCoin (BNB) analysis.
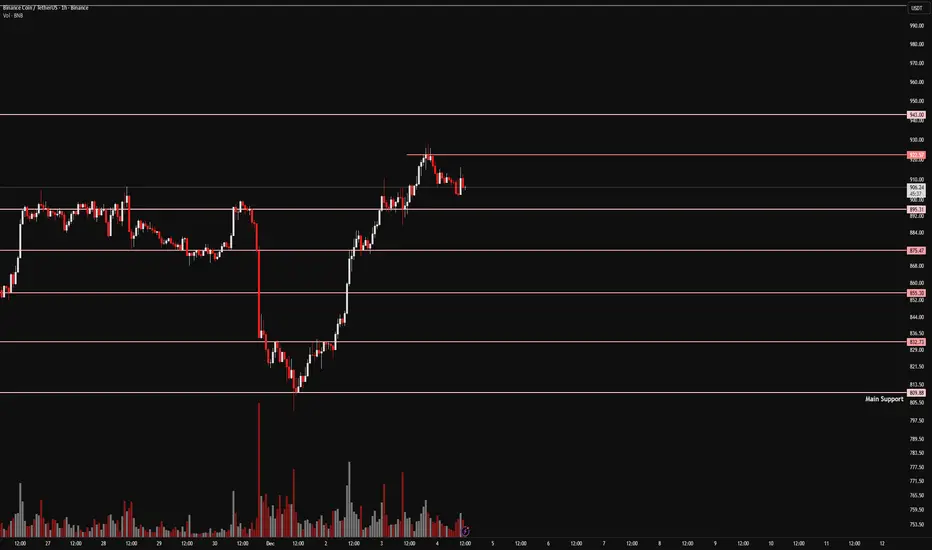
👀 BNB 4H Overview
BNB is currently trading inside a large 4H range box. A breakout from this box could trigger a major move.
The $922 level stands as both the top of the range and the 38% Fibonacci retracement of the previous bearish leg.
On the downside, $881 is acting as a freshly formed support zone.
📊 Volume Analysis
Volume slightly increased during the attempt to break $922, but buyers lacked enough strength and selling pressure followed.
A strong and sustained increase in volume will significantly raise the probability of a valid breakout.
✍️ BNB Trading Scenarios
🟢 Long Scenario 1:
A confirmed breakout above $922 creates a solid long opportunity.
Entry confirmation should come from a stable increase in buying volume.
🟢 Long Scenario 2:
You may enter on the 4th test using a stop-buy order with a wider stop, targeting around RR = 2.
⚠️ This type of entry should be executed with maximum 0.5% risk per trade to avoid heavy losses.
🔴 Short Scenario:
Since the broader structure behind price is strongly bearish, and the market previously experienced an aggressive drop from a distribution zone,
a break below the newly formed $881 support can activate a short position, confirmed by rising sell volume.
🧠 Protect your capital first. No setup is worth blowing your account. If risk isn’t controlled, profit means nothing. Trade with rules, not emotions.
Bep20

FireHoseReel | BNB Daily Analysis #15🔥 Welcome to FireHoseReel!
Let’s dive into the Binance Coin (BNB) analysis.
👀 BNB – 1H Overview
BNB has successfully activated its long trigger and is now moving higher.
At the moment, BNB is forming a higher low compared to the previous bottom, which strengthens the bullish structure and keeps the upside continuation in play.
📊 Volume Analysis
After the long trigger was activated, BNB volume increased strongly, supporting the upward move.
If buying pressure remains sustained, BNB can continue its rally toward the next key resistance zone.
✍️ BNB Trading Scenarios
🟢 Long Scenario
The main long trigger is already active.
However, the risk-on long trigger will activate with a break above the current high, offering a more aggressive continuation setup.
🔴 Short Scenario
If BNB forms a lower high and a lower low below the $895 level, strong selling pressure could emerge.
That said, on the 4H timeframe, there is still a high probability that this short scenario may fail.
FireHoseReel | BNB Daily Analysis #13🔥 Welcome to FireHoseReel !
Let’s dive into the Binance Coin ( BNB ) analysis.
👀 BNB – 1H Overview
After the recent decline, BNB has entered a new short-term structure and is now moving toward the $871 resistance with strong momentum and rising volume.
One or two clear reactions to this resistance, followed by a confirmed breakout, could activate our long trigger.
📊 Volume Analysis
Volume is the key factor to monitor here. During BNB’s corrective move after the bearish leg, buy volume was decreasing.
However, once the multi-timeframe resistance at $833 broke, buy volume expanded sharply, marking a sentiment shift that traders needed to react to.
✍️ BNB Trading Scenarios
Below are the active scenarios you can use alongside your own trading strategy:
🟢 Long Scenario
A break above $871 with rising buy volume can activate a long setup.
The second touch and breakout usually offers a better risk-to-reward with a tighter stop.
🔴 Short Scenario
The formation of bearish patterns such as failure swing, non-failure swing, or double top, confirmed by volume, can provide a valid short setup.
❤️ Risk Management & Emotional Discipline
Crypto trading is highly risky. Without proper risk management and emotional control, trading is no different from gambling.
Logic must always come before emotions. Learn to manage your trades—and enjoy the process with control and discipline.

FireHoseReel | CAKE at a Critical Support Zone🔥 Welcome To FireHoseReel !
Let's dive into Cake analysis, the native token of PancakeSwap DEX.
👀 CAKE – Short-Term Market Breakdown
After breaking its newly formed support at $2.342, CAKE moved sharply lower and formed a temporary support around $2.233.
A breakdown below $2.233 could activate the next major downside trigger.
📊 Volume Analysis
Selling pressure on CAKE has intensified aggressively.
In a single 4H candle, sellers dominated the market with heavy force.
If sell volume expands again, the current downtrend is likely to continue with momentum.
🔁 CAKE/BTC Perspective
The CAKE/BTC pair is still holding a bullish structure, but a loss of its current support could trigger a corrective phase in the BTC pair as well.
📌 Trading Scenario
This scenario can be used alongside your own trading strategy and risk management.
🔴 Short Scenario
Breakdown below the newly formed support at $2.233
Must be accompanied by a strong increase in sell volume
This could push CAKE lower and may also trigger a support breakdown on CAKE/BTC, adding further downside pressure.
❤️ Risk Management & Emotional Discipline
Crypto trading is highly risky. Without proper risk management and emotional control, trading is no different from gambling.
Logic must always come before emotions. Learn to manage your trades—and enjoy the process of trading with control and discipline.

FireHoseReel | BNB Daily Analysis #2😄 Hey! How’s everything? Hope you’re doing great!
🍾 Welcome to FireHoseReel — make sure to follow and enjoy the analysis along the way.
If you ever want a custom chart breakdown, just leave a comment and I’ve got you.
😎 Now let’s jump into the analysis of my favorite coin: BNB .
👀 BNB – 4H Timeframe
BNB recently gave us a short trigger on the 4-hour chart after breaking its key support at $896. Price dropped right toward our first target at $818, hit it cleanly, and is now stuck in a “mid-zone” with no clear direction.
Even on a multi-timeframe view, we currently don’t have any valid entry trigger, so we need to wait for new structure formation before planning the next move.
📊 Volume Analysis
Our volume indicator played a major role here:
Once the support broke and the short trigger activated — exactly as mentioned in yesterday’s analysis — sell pressure increased sharply.
Whales also started selling their BNB as soon as the support failed, and many traders used this opportunity to enter short positions.
Volume is still showing bearish pressure, and the last two 4H candles had a strong increase in selling activity, turning into clear downward momentum.
✔️ Now let’s analyze something different — BNB/BTC pair
On the 4H timeframe, this pair is still moving inside its trading range and has managed to maintain its relative strength against BTC.
However:
• A breakout above the range high at 0.010162 could trigger a strong bullish move
• A breakdown below the range low at 0.009800 could lead to a deeper correction in the BNB/USDT pair and accelerate the bearish momentum there
For now, the pair holds a bullish bias, but we need confirmation through an actual breakout.
✍️ Current Scenarios
We don’t have a new setup today, as yesterday’s short position already played out and is still valid.
For a new entry — long or short — we need BNB to build a fresh market structure and give us a clean trigger.
Until then, patience is the best strategy.
🛞 Risk Management & Disclaimer
Please remember to always use proper risk management and position sizing. Nothing in this analysis is financial advice. The market can change quickly, so always trade based on your own strategy, research, and risk tolerance. You are fully responsible for your own trades.
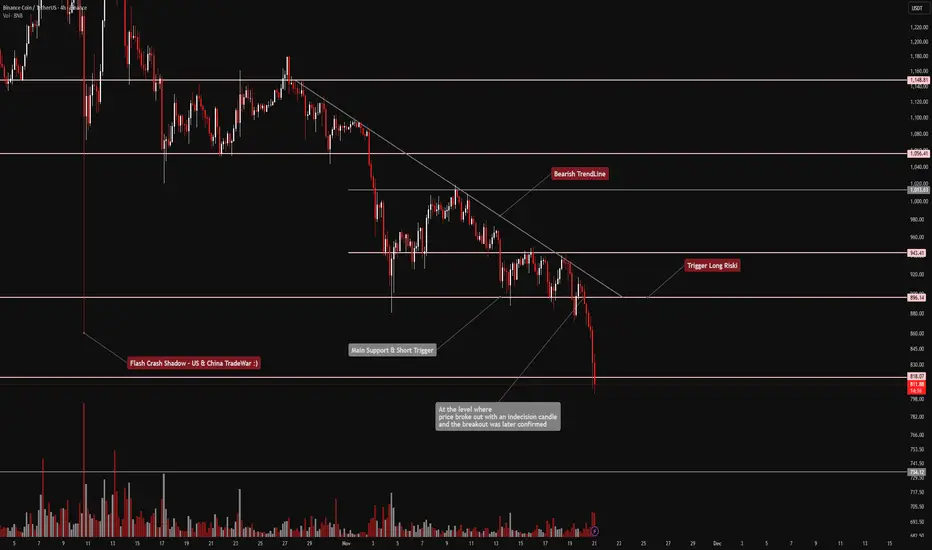
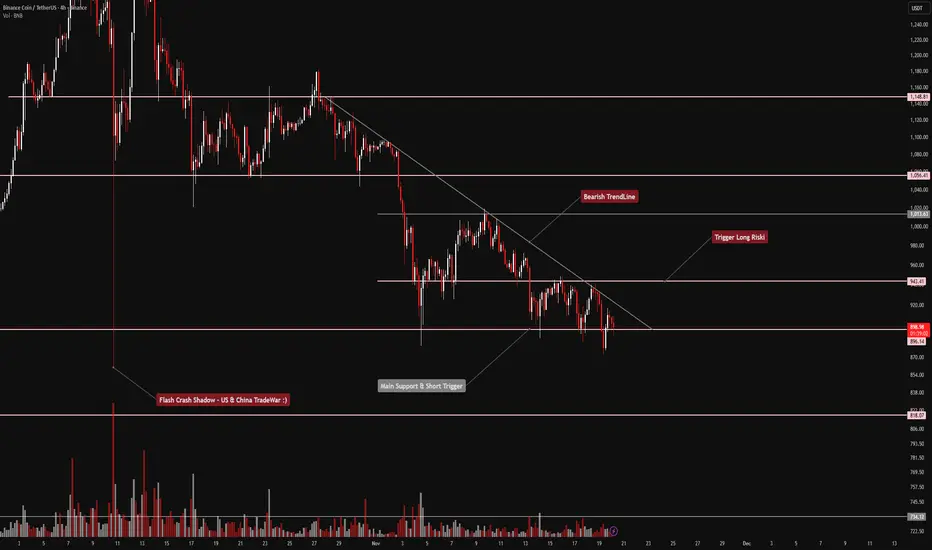
FireHoseReel | BNB Daily Analysis #1😄 Hey! How’s it going? You good?
🍾 Welcome to Fire Hose Reel!
Hit that follow button and enjoy the analysis ahead. And if you ever want a custom chart breakdown, just drop a comment — I got you.
😎 Let’s jump into the analysis of my favorite coin : BNB
👀 BNB on the 4-hour timeframe
After the recent flash crash in the market, BNB entered a corrective phase. A descending trendline (dynamic resistance) has formed, and every time price touches it, we see a retracement.
Right now, BNB is walking right along a major support zone. Losing this area could push price down toward the next support.
This key support sits around $896, and a breakdown below it could intensify the bearish trend, adding momentum to the downside and breaking price out of this triangle-shaped structure.
📊 Volume Indicator
Looking at the volume below the chart, every touch of the trendline has caused sellers to step in, sometimes even breaking strong support levels. When that happens, the volume bars spike upward, signaling increased selling pressure.
At the moment, if sell volume continues rising, BNB could lose the $896 support and move further downward.
✔️ Now let’s analyze something different — BNB/BTC pair
On the 4-hour timeframe, BNB/BTC hit an important resistance level and got heavily rejected, pushing price downward.
Here’s the key point:
BNB’s relative value against BTC is still higher, and just like the USDT pair, it’s sitting on a major support.
If this level breaks, maximum selling pressure could kick in and cause a strong drop.
✍️ Trading Scenarios (Long & Short)
🔼 Long Scenario
• A breakout above the descending trendline
• Confluence with the $943 resistance
• Strong buy volume confirming the breakout
This setup is a bit risky, since higher timeframes are still leaning bearish. Tight stop-loss & quick partial take-profits are recommended.
🔽 Short Scenario
The current level where price is hovering can act as a good support, but if this zone breaks with selling pressure, price could move downward.
That gives us a clean opportunity to open a short trade on the breakdown.
🛞 Risk Management & Disclaimer
Please remember to always use proper risk management and position sizing. Nothing in this analysis is financial advice. The market can change quickly, so make sure you trade based on your own strategy, research, and risk tolerance. You are fully responsible for your trades.
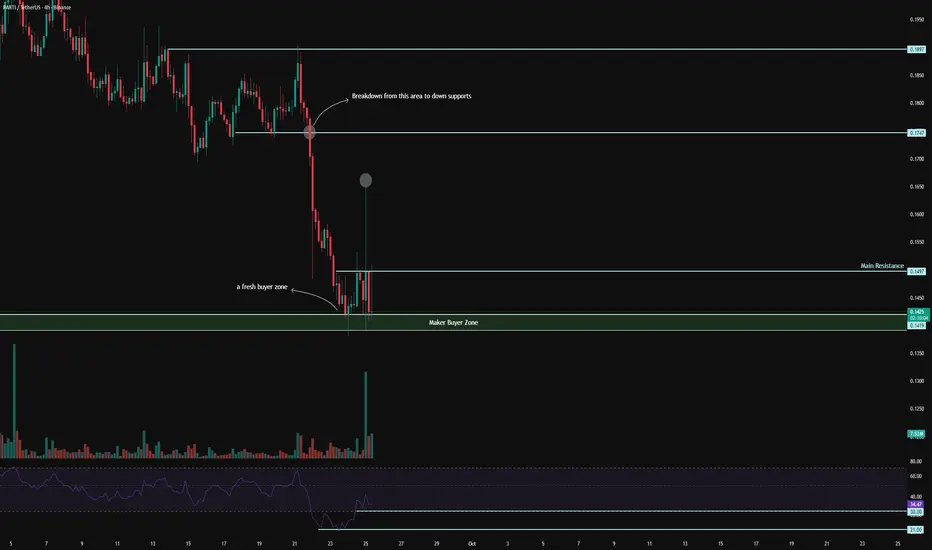
PARTI 4H Analysis - Key Triggers Ahead❄️ Welcome to the cryptos winter , I hope you’ve started your day well.
⏰ We’re analyzing PARTI on the 4-Hour timeframe.
👀 On the 4-hour timeframe, Coin Party has flashed a strong sell signal after losing support at 0.1747, and is now moving toward its lower support zones. The overall trend on higher timeframes remains heavily bearish, with capital inflows steadily exiting the asset in a step-by-step manner.
Meanwhile, a relatively strong micro-buyer zone had formed, which initially pushed the price upward upon contact, but heavy selling pressure soon drove it back down. This level now represents the last defensive support for maintaining price stability. Losing it could trigger a move toward the coin’s key initial-offer support — or, at best, bring it close to that zone.
🧮 On 4-hour timeframe RSI OscillatorFrom a timing perspective, after losing the 0.1419 floor, the coin has been under intense selling pressure for 2 days. It is currently emerging from the oversold zone, sitting just below the 50 resistance level. Key areas remain at 30 and 21; a cross below 30 could generate a volatility-driven target near 21.
🕯 The size, volume, and frequency of red candles are increasing, reflecting heavy selling pressure. Sellers are actively acting as ticker sellers, absorbing any upward moves. Each price attempt away from support meets with stronger sell pressure.
🧠 For new entries, there is a strong possibility of whale-driven sell waves. Patience is key: we wait for the RSI to retest the 30 zone, and upon a confirmed breakdown of the current support floor, we can consider opening short positions.
❤️ Disclaimer : This analysis is purely based on my personal opinion and I only trade if the stated triggers are activated .
BNB Price Action Trading- BNB sound dangerous with all the FUDs made by US government.
- But Binance is still from far the first exchange in the world by liquidity and trades volumes.
- they won't let go BNB so easily.
- it's still an easy trade for now if u play it wisely, and with strategy.
- No Danger, No Glory.
--------------------------------------------------------------
Trading Parts
--------------------------------------------------------------
- Buy : 200$ ish
- TP1 : Before 350$
- TP2 : Before 650$
--------------------------------------------------------------
- Stop Loss : 170$ ( don't touch anything under 170$ )
--------------------------------------------------------------
- Rebuy a big Dip : 50$ ish
--------------------------------------------------------------
Happy Tr4Ding !

TWT GLOBAL VISION ELLIOTT WAVEHi traders,
Want to present you my global vision of TWTUSDT (Trust Wallet Token)
TWT made a FULL IMPULSE (1-2-3-4-5) Cycle. It was complete in very clear way, even can say that its looks like a book example:
-Wave 4 was a clear triangle "abcde" with its own subwaves - each abc
-Wave 5 was a clear 5w impulse
NOW SOME TYPE OF GLOBAL CORRECTION IS HAPPENING ( ABC zigzag with its own subwaves IMHO)
-My point is that wave A was set in a shape of leading diagonal with its own 5 subwaves
-Now we are observing Wave B development
-Because Wave A was a 5w structure we can assume that whole ABC will be 5-3-5 structure
So I expect wave B will be structured in 3 waves and will end on one of the Fibo levels (50-61,8-78,6). It can become a complex Wave so it can be devided in its own abc structures.
Lets go step by step with market structure and always remember to control our risks first!

bake long ooportunitymarket is looking fresh and energy full. Bake could pump 10% to 3.3$, followed by a small retracement to then pump to 4.10$. bullish for the week


