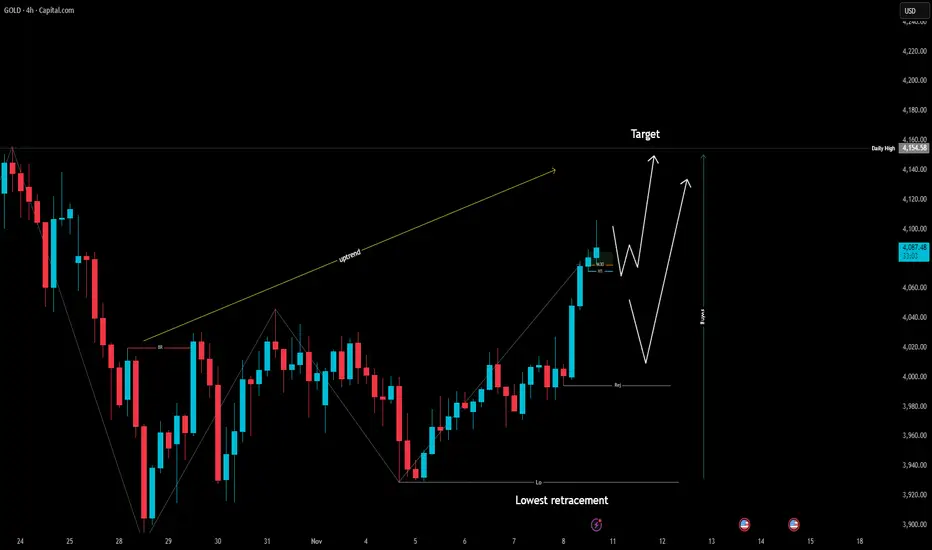
GOLD UPTRENDING GOLD ANALYSIS TODAY
Gold remains in an uptrend within the H4 timeframe after breaking the previous high at 4046.
If bullish momentum continues, the next target is the daily high around 4154.
Focus on buying opportunities as long as the market maintains its uptrend structure.
If the price pulls back, expect a retest of the M30 structure near 4030 — and if that level breaks, price may continue to drop toward the H4 rejection zone around 4000.
For selling opportunities, wait for a confirmed break below the M30 low to validate a potential reversal setup.
Beyond Technical Analysis
XAUUSDHello Traders! 👋
What are your thoughts on Gold?
The $3,900 level continues to act as a key support zone for gold, preventing further downside pressure for now.
Currently, the price is consolidating between the highlighted support and resistance levels, showing range-bound behavior in the short term.
We expect gold to form a short-term upward correction toward the resistance zone, followed by a bearish rejection from that level.
If price fails to hold above $3,900 zone and breaks below the support, a deeper decline toward lower levels could follow.
As long as the $3,900 support holds, gold is likely to remain in a sideways structure, but a confirmed breakdown would signal the start of a new bearish leg.
Don’t forget to like and share your thoughts in the comments! ❤️

$YM | Dow Futures Analysis | Long Scenario / IdeaAnalysis of today. We're currently in the dead center of two fairly strong levels with some bullish news premarket. Look to 'buy' at our green zone, and target the pink.

GOLD ANALYSIS BASED ON REAL SMART MONEY ORDERS (11/10/2025)💛 Welcome to Trade with DECRYPTERS! ( 11/10/2025)
Your trusted source for Smart Money insights, Real-Time Levels & Market Direction.
Let’s decode what’s driving GOLD this week 👇
#GoldSurge #GoldPrice #SafeHaven #PreciousMetals #CentralBankBuy #USDIndex #GoldTrading #GlobalMacro #USChinaTrade #FedWatch #MarketPulse #TradeWithDecrypters
📊 Market Pulse
Gold surged +1.85% to $4,074.92/oz on Nov 10, 2025, rebounding sharply from Friday’s ~$4,000 close.
This move came amid US-China trade talks, geopolitical tensions, and reduced Fed rate-cut expectations — fueling another wave of safe-haven demand.
💹 DXY (~100.20) ticked higher but capped further gains as traders weighed mixed Fed signals and trade optimism.
🏦 Central Banks continued heavy accumulation, with Q3 2025 demand hitting 1,313 tonnes ($146 B) — led by China’s 11th straight month of buying and Poland’s diversification push.
These flows continue to support prices even as the dollar firms.
🌍 Geopolitics & Safe-Haven Demand
⚔️ U.S.–China tensions + Mideast conflicts are boosting gold’s safe-haven appeal.
📈 ETF inflows stand at +619 tonnes YTD, while physical bar & coin demand jumped +17% YoY to 316 tonnes in Q3.
Investors remain defensive, building exposure across multiple gold-linked assets as volatility picks up.
🔎 What to Watch Next
📅 Nov 12 – U.S. CPI Report (~3.0% core expected)
→ Hotter data = Fed pause → short-term pressure on gold
📅 Nov 13 – U.S. PPI & Jobless Claims
→ Softer labor data = higher rate-cut odds → bullish for gold
⚡ Bonus Triggers:
Any U.S.–China trade breakthroughs or Middle East escalations could spark quick volatility spikes off nearby support zones.
🧭 Technical Framework (Smart Money Map)
💰 Current Price: ~$4,075 (+1.85% / 24h)
📉 Volatility Range: $4,020 – $4,100
Smart Money Sell Area: $4,080 – $4,100
→ Institutional resistance cluster – watch for rejection
Scalp Sell Zone: $4,050 – $4,065
→ Ideal for short-term liquidity fades
Scalp Buy Zone: $4,020 – $4,030
→ Minor bounce region
Smart Money Buy Pool: $3,980 – $4,000
→ Key accumulation zone for institutional bids
🎯 Conclusion – Bullish Bias with Pullback Risks
Gold’s strong rebound shows safe-haven and central-bank support still dominate, even as DXY limits upside.
Trend bias remains bullish, but expect controlled pullbacks within the current consolidation.
📊 Above $4,100 → targets $4,200 +
📉 Below $4,020 → tests $3,980–$4,000 buy zone
💬 Trade Smart — Trade with DECRYPTERS ⚡
Gold surge, safe-haven demand, central-bank buying, USD index, U.S.–China trade, Fed rate-cut expectations, geopolitical risk, ETF inflows, physical bullion, Smart Money map.

Understanding AI in Trading: How Machines Actually TradeWhat if you were one solid AI model away from the life you pictured, the dream house, and that shiny Lambo in the garage?
Can AI really level the playing field so retail traders operate like pros, or is it quietly widening the gap between individuals and institutions?
Let’s strip the hype, keep the power, and see how machines actually hit the market.
From Concept to Application
An AI trading system, or more precisely a machine learning system, learns from data. It processes massive historical datasets with hundreds of variables, indicators like RSI, MACD, or Bollinger Bands, as well as macro data such as interest rates, employment figures, or even alternative data. If it’s a number, the model can read it.
It works across different time horizons, from sub minute intraday data to decades of monthly charts. That range depends on the model’s design and the kind of patterns it is built to detect.
Once the data and time frames are defined, the machine uses math, linear algebra and optimization, to uncover relationships that humans usually miss. Whether it is a simple regression, a computer-vision network that “reads” price charts, or a multi-agent setup that delegates tasks between bots, the foundation is always the same: matrices and optimization. That’s how machines think.
Broadly speaking, machine intelligence is based on reproduction, not prediction. It doesn’t see the future; it measures the past and projects tendencies forward.
A Machine Learning Tool in Practice
Let me show you how this looks in real life through a model that completely reshaped how I trade. It's simple enough for any retail trader to use, yet solid and rigorous at its core.
For a better understanding, see the model chart here:
1. Discovering True Market Structure
The model builds what I call a main channel, a living corridor that learns how price naturally moves. The slope of this channel instantly shows if the market mood is bullish or bearish, while its angle reveals the strength behind that move.
The width of the channel speaks the language of risk. It shows how far price can deviate from its mean before breaking the pattern recognized by the machine. In simple terms, it measures how much turbulence the market can handle before the trend truly changes.
Think of it as Bollinger Bands on steroids: self-adjusting, smoother, and far more adaptive.
Around the price, you’ll see pale white dots, the model’s built-in risk sensors. They turn volatility into a visual map that shows where normal movement ends and real danger begins.
As long as price stays on one side of the dots, the trend remains intact. When it pushes through and the dots flip sides, that’s your early alert that a counter-move is coming, even if the main trend is still valid.
Those dots also serve as smart stop-placement guides. They adapt faster than the main channel, letting you protect profits without reacting to noise. It’s like having a smaller, agile pilot inside a bigger, steady aircraft.
When price crosses from below to above the dots, strength returns; when it drops below, momentum fades. That’s where AI logic meets classic technical analysis, confirming what your eyes sense and your instincts suspect.
2. Checking Sentiment in Motion
Below the chart, a lower panel acts like the emotional dashboard of the market. It shows not just what prices are doing, but what traders are feeling.
The histogram works as a health monitor. When it stays green, buyers dominate and the market is healthy. When it turns red, sellers take over and caution becomes the smart play.
Then comes the red line, the true heartbeat of machine intelligence. This is where AI shows its edge. The model constantly scans for contradictions within the trend, searching for anomalies that human eyes often miss.
When that red line suddenly collapses, it is the machine whispering that something unusual is forming, often signaling that a move is running out of steam and a sharp countertrend swing is near. Those moments are pure gold for taking profits or positioning early for a reversal, often with massive reward-to-risk potential.
For instance, in the chart attached, the red line collapsed just one day before BINANCE:BTCUSDT reached its all-time high. While price action was euphoric and traders were celebrating new records, the model flashed a silent warning. Days later, the market unraveled, triggering the largest liquidation event in crypto history.
3. Measuring the Health of the Phase
To simplify reading conditions, every candle on the chart is color-coded to match the current market phase:
Green means bullish momentum is on your side.
Yellow or orange signals transition, time for patience.
Red marks bearish pressure, a moment for defense.
These colors intentionally react slower than price, filtering out emotional whiplash. They confirm when a move is genuine and warn when enthusiasm is fading.
This visual layer gives you something most traders lack: context. In one glance, you can tell if the market is confident, cautious, or fearful, and align your decisions accordingly.
Can AI Really Close the Gap Between Retail and the Pros
The example above shows what happens when machine learning is used with intention. It doesn’t replace judgment; it amplifies it. It adds depth, color, and precision to analysis, turning raw data into clear, confident action.
Still, every trader wonders the same thing: is AI the holy grail everyone’s been chasing?
Here’s the truth. AI excels at spotting patterns in stable, predictable environments, that’s why your phone finishes your sentences and why ChatGPT feels almost magical. It operates in a world where rules rarely change.
The market is the opposite. It breathes, shifts, and reinvents itself daily. That constant change is what makes it fascinating, and what makes it hard for machines to predict with precision.
A trading model must relearn often. It adapts, forgets, and learns again. Its accuracy will never match that of a chatbot or an image generator because markets are alive. That’s where human judgment becomes essential. Only a person can see context, interpret uncertainty, and decide when a model has lost its edge, needs recalibration, or belongs in the trash bin.
This is why large institutions employ entire teams of quants to monitor and update their systems. Machine learning is not a one-time task; it’s a continuous process of evolution.
Bottom Line
AI in trading isn’t a crystal ball. It’s a mirror that reflects how markets behaved and projects those patterns into the near future. It doesn’t think or feel, but it can see relationships most traders miss.
Used correctly, AI gives retail traders access to capabilities once reserved for hedge funds and prop desks. You can now detect patterns hidden deep in the noise without needing a lab or a team of quants.
The key is to keep the roles clear. Let the machine handle the data. Let you handle the decisions. Use AI to frame probabilities, manage risk, and act with discipline. That’s how a retail trader turns AI hype into a real, measurable edge.

Reassessing Copper’s Strength in a Shifting Macro CycleGradual Demand Recovery, Tightening Inventories
Copper leans bullish after the recent decline. While demand is still uneven, it is setting itself up to boom over the following few months; factors like supply constraints and a softening dollar are also shifting the balance upward.
On the demand side: China’s official manufacturing PMI slipped to 49.0 in October, marking the seventh straight month of contraction, underscoring that the recovery remains fragile. Downstream restocking appears limited, and end-user demand remains wary.
Having said that, overall, the narrative of collapsing global demand, outside of China, is beginning to soften . The long-term projections are even more bullish, expecting global copper demand to rise by 40% by 2040.
Growth is being underpinned by:
• energy transition spending (grid upgrades, renewables)
• increasing digital/industrial usage (data centres, new infrastructure)
• regional growth in Asia (outside China)
Source: Reuters
Meanwhile, supply issues remain intact. The global refined copper market is now projected to face a 150,000-ton shortage in 2026, reversing the earlier forecast of a 209,000-ton surplus, as output growth slows.
Mine disruptions in Congo in June and those in Chile and Indonesia in the latter half of this year have already prompted the International Copper Study Group (ICSG) to revise yearly growth figures in mine production down to 1.3% from April’s 2.3% guidance.
Source: UNCTAD
Though the industry body expects mine output to rise by 2.3% again next year, the refining output is expected to only grow by 0.9% as against this year’s 3.5% growth.
Powell’s Pause and the Dollar Dilemma
The Federal Reserve’s October 29 decision to cut rates by 25 bps was unmistakably dovish. Still, Chair Jerome Powell emphasised that a further cut in December is “ not a foregone conclusion ”. He also remarked that policy is being conducted in a context of uncertainty (“driving in the fog”) due to delayed data from the government shutdown.
This has led to lower market expectation of another rate cut in December, with the probability falling to 63% from 92% a month ago. The dollar index has also shot up 1.5% over five sessions; dollar and copper prices move inversely.
Source: CME FedWatch tool
Having said that, labour data is inclined to the Fed being biased toward further easing. Jobs were likely lost in October across both the government and retail sectors, with over 20,000 positions shed from government payrolls.
Though the October data would not be published, an estimate from the Chicago Federal Reserve indicated that the unemployment rate edged up from September’s 4.35% to 4.4%.
A Mean-Reverting Ratio?
The long-term copper-gold ratio is also at a multi-decade low. The rise in this ratio usually indicates a “risk-on” thesis, where appetite for safe assets falls, and growth drivers like copper experience rising demand.
The thesis emerging from the current lows, though, is more about mean reversion than a “risk-off” sentiment, especially when fundamentals for both—high demand and soft supply—hold true for copper at the moment.
The ratio is based on U.S. prices, which plunged in July this year when copper was excluded from Trump’s tariffs.
Gold’s rise, on the other hand, is owing to more nuanced factors. Buying from financial investors shot up this year owing to increased geopolitical risk and a rethinking of the USD dominance narrative. Retail investors joined in later, seeing the price soar.
Cumulatively, this has brought the CGR to its lowest in almost 30 years, and is presently near levels it has also shot up from on multiple occasions before.
Historical Trade Set-up
Open interest for options for the December contract reflects a highly bullish view, with a high build-up of near and deep OTM calls. The OI put-call ratio stands at an unequivocally bullish 0.54.
Source: CME QuikStrike
Similar scenarios have lifted copper before, be it the demand-side push post-COVID, or the upward pressure on copper prices seen in 2010 due to supply disruptions.
Over the second leg of copper’s uptrend in 2021, the front-month copper futures rose from USD 4.603/lb to a high of USD 5.280/lb.
Given the CME copper futures contract size of 25,000 pounds, this translates to a gross mark-to-market profit of USD 16,925 per contract over the duration of the move:
PnL = (5.280 − 4.603) × 25,000 = USD 16,925
Alternatively, the same view could be expressed using CME Micro Copper futures, which represent 1/10th the notional of the standard contract, allowing for more granular exposure and lower capital requirements.
With three mine disruptions this year and new avenues emerging for copper to be deployed, both factors could trigger a repeat of past trends.
Technical indicators have also started showing early signs of a rebound; RSI has begun to tick upward, and support was successfully sought above S1.
Overall, copper continues to offer a compelling barometer of macro reflation, especially with strong fundamentals just as inventories tighten, and now that monetary policy also seems to be turning.
This content is sponsored.
MARKET DATA
CME Real-time Market Data helps identify trading set-ups and express market views better. If you have futures in your trading portfolio, you can check out on CME Group data plans available that suit your trading needs at tradingview.com/cme .
DISCLAIMER
This case study is for educational purposes only and does not constitute investment recommendations or advice. Nor are they used to promote any specific products, or services.
Trading or investment ideas cited here are for illustration only, as an integral part of a case study to demonstrate the fundamental concepts in risk management or trading under the market scenarios being discussed. Please read the FULL DISCLAIMER the link to which is provided in our profile description.

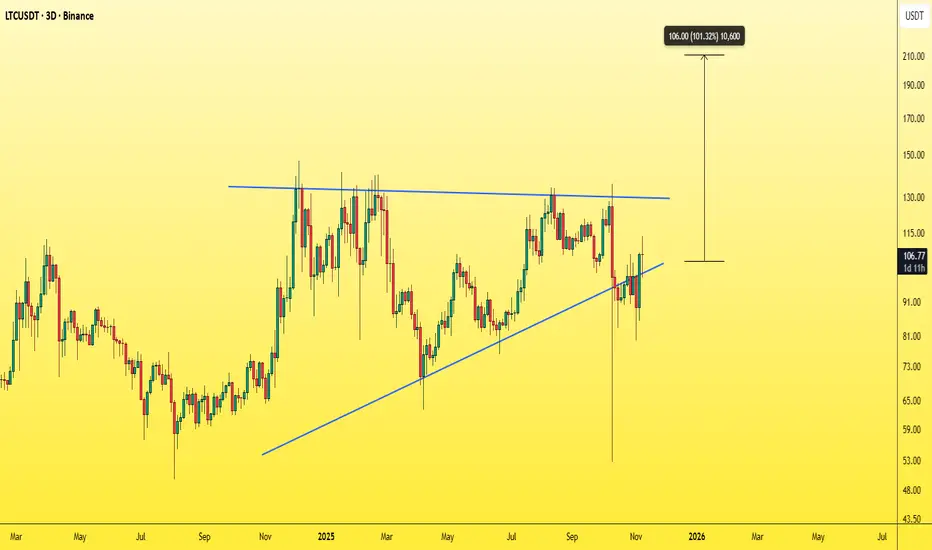
LTCUSDT - Time to wake up for this Monster!As usual, any popular coin like LTC tends to make you lose hope right before a major rally — it usually forms a bearish-looking triangle, breaks downward, and makes everyone think a bear market has started.
Here’s how you know it’s actually preparing to pump:
It gives a very bearish signal on the chart — spot traders panic sell at a loss, long traders get liquidated or trapped, and short traders start feeling confident right before price reverses and pumps hard.
When everyone’s losing, that’s when the path upward becomes clear and safe.
I believe a 100% move from here is the minimum we’ll see.
Best Regards:
Ceciliones🎯
November 10 - 14 2025
1. Macro
I have made several changes to my Macro layout to make it more focused and intuitive for options trading. I still watch commodities and check the gauge from time to time, but I have found they are too volatile, cyclical, and noisy for me to be keeping such close tabs on. Instead, my renewed focus is to assess risk across currency (gold and fiat) and bonds, which in turn will help me measure the attractiveness of stocks in real time.
Since Mid-September, the dollar TVC:DXY has been on a steady rise. Meanwhile, the Z-score of $(DXY*TYIE) (Dollar FX strength multiplied by real yield) has been falling over the same period before pivoting at the end of October. This would suggest that real yields were falling at a rate that outpaced the dollar’s relative strengthening. The pivot came at the same time that TVC:GOLD started to pull back from its nearly 30% rally. Keep in mind that real yields rising is bearish for gold.
I’m also bringing in $GOLD/GVZ which serves as a good early exhaustion gauge for Gold. Here we can see that traders loaded up on AMEX:GLD puts before the price pulled back, but have since reverted back to the average. We will see if Gold continues its uptrend or if more volatility is to come.
Next, I’m looking at the Z-score of the dollar TVC:DXY against the price (not yield) of a 10Y US-bond. The idea here is to simply gauge whether the market has a preference for cash or risk-free bonds. This measures the relative risk of bonds (ie. higher yields expected: market will prefer cash). Here we can see that there seems to be a preference for cash that has close correlation with the TVC:DXY uptrend, suggesting FX is moving the dollar higher more than a change in the bond price.
I have decided to chart TVC:US02Y by itself, occasionally switching to other yields or the 10Y real yield FRED:DFII10 ), since it is more sensitive to policy than 10Y and more volatile than 03MY. Here, the nominal yield started to rise at the same time as when TVC:GOLD & CBOE:GVZ peaked and the dollar*real yield gauge pivoted. The forward inflation gauge (bottom right) has stayed mostly down but is showing signs of flattening out, perhaps finding support for a move higher.
What does all of this tell me? I think this sends a clear message that the market thinks nominal yields will continue to rise, yet I’m not yet getting the signal that this is due to a change in how the market is pricing inflation. Due to shutdown delays (which will hopefully be ending soon), the latest available real yield print is from Thursday November 6, and with the movement on Friday it will be important to see how the forward inflation gauge changes when it gets updated.
If nominal yields continue to rise TVC:US02MY and TVC:GOLD confirms without hedging CBOE:GVZ , this would send a risk-off signal. On the flip-side, the market would need to see continued FX strength for the dollar AND nominal yields flat or falling to confirm a risk-on pivot. Right now this leans risk-off but I will be watching closely.
2. FX
Made a couple changes to the FX layout to support the same line of thinking. Might tweak this more depending on how insightful it is. Top pane is now 2Y yields for selected countries. The middle pane is what I would call a “forward-looking interest rate vs historical inflation”. This is similar to the real yield but the real inflation data has much more lag, but I’m trying this out as it may suggest how loose or tight forward policy expectations might be. Lastly, I have the percent comparison of the selected currency baskets as usual.
Since the Dollar’s FX strength is playing a key role in the dollar’s attractiveness over bonds, It’s worthy to note that other currency indices currently have an inverse relationship with OPOFINANCE:DXY. The dollar caught a bid while competitors fell in late October but now it looks like the opposite is occurring. TVC:US02Y has risen and is now essentially tied for second-highest with Australia - use below Great Britain. Meanwhile, the market is pricing the US as restrictive but not as tight as France and Italy (dotted and dashed blue lines, respectively). I think this means the Eurozone will see more FX interest compared to the dollar, which could undermine its strength unless nominal yields continue to rise.
In my view, this supports a better Risk-On argument since the Euro index TVC:EXY has not started outperforming TVC:DXY yet on the indexed chart, meaning euro restrictiveness is not fully priced in. With the US in the early stages of an easing cycle and Europe still dealing with higher inflation, US conditions are likely to continue easing relative to the EU’s riskier members; France and Italy. This should keep the dollar from finding too much market interest.
Conclusion: Dollar FX will continue to be range-bound or lower. Any rise should just be seen as temporary.
3. Risk
I’ve changed my approach here to focus more on credit on a shorter-term basis. Here, I have real Option Adjusted Spreads of corporate bonds (top left, blue) like before, but will primarily watch the proxy -1*(HYG+LQD)/2/TLT (public debt vs treasuries), which is more sensitive and can provide early signals and important divergences. In the middle pane, I’m tracking $-1*HYIN (inverse of a private-credit ETF; higher value = higher risk to private credit). On the third pane I am using $ES1!/GOLD as I have always done.
This layout shows a worrying picture for the near-term. The real OAS chart (blue) is confirming the uptrend on the proxy above it is signaling stress to public credit and spreads may be on to higher highs. On the next chart, we are seeing that there is also stress to private credit that is staying above the Keltner Channel. I believe this underlying credit risk added stress to stocks over the past two weeks. If it continues there certainly could be more downside ahead. It’s also not looking good when $ES1!/GOLD is moving lower after a bounce that could potentially lead to lower low, however a key point to note is that this recent dip has been caused by stock selling, not gold buying, as I have previously pointed out, which is a very important distinction in my opinion.
My takeaway is that the credit situation should be monitored very closely. Despite this, it’s also noteworthy that the market is not rushing into risk-off assets like Gold and Treasuries, and Macro forces may even prevent a surge in both, so there is still a good chance the credit issue is temporary. Neutral/leaning bearish on this one.
4. Sector Performance
Same approach here. Only thing I want to point out is that we clearly saw a rotation out of tech AMEX:XLK and into healthcare AMEX:XLV (circled), which was the source of stock market volatility and could have been due to “smart money” positioning prior to the White House pharmaceutical pricing announcement. I doubt this trade will hold, so a rotation back into tech at some point seems likely.
5. Bias
I won’t spend too much time on this one today. I already predicted we’d see the price move higher after Friday’s close which is why I bought calls one week out. CVD clearly favored the sellers last week but right now it looks like it might be breaking through. On my volatility indicators on the left, there was strong confirmation that dealers were long puts on the days the market sold off last week but Friday appeared to show a pivot, taking out the puts. Historical Volatility (HV) is falling so there is a possibility this could be a reversion, however I think a 4% pullback and 22 on TVC:VIX with no major news supporting it was excessive. Stocks were overbought so that was more than enough for a healthy pullback to shuffle the deck.
Conclusion:
Macro indicators are important to watch this week, as I believe they will provide important clues for stock market performance. As I explained above, rising yields/strong dollar will put downward pressure on stocks but the dollar’s relative strength can be assessed through the FX lens, which suggests that even if we see nominal yields rise to start the week, investors will still have an incentive to buy US debt compared to across the pond (UK, France, Italy).
I also think the rotation out of Tech and into Healthcare was likely temporary, which let stocks pull back and investors to profit off of the healthcare-related policy news that was in the pipeline. The real bearish catalyst I’m watching is to see if credit continues to show signs of stress. If that is the case, a continued rise in gold (which we are already seeing today) could be a signal of rushing to safety, however I would also expect to see US treasuries declining simultaneously if that were the case.
All of this to say, I think it is more likely than not that stocks will recover and continue the bullish trend this week, but it is still important to watch for any signs that trouble still lies ahead. A lot can happen in a week.

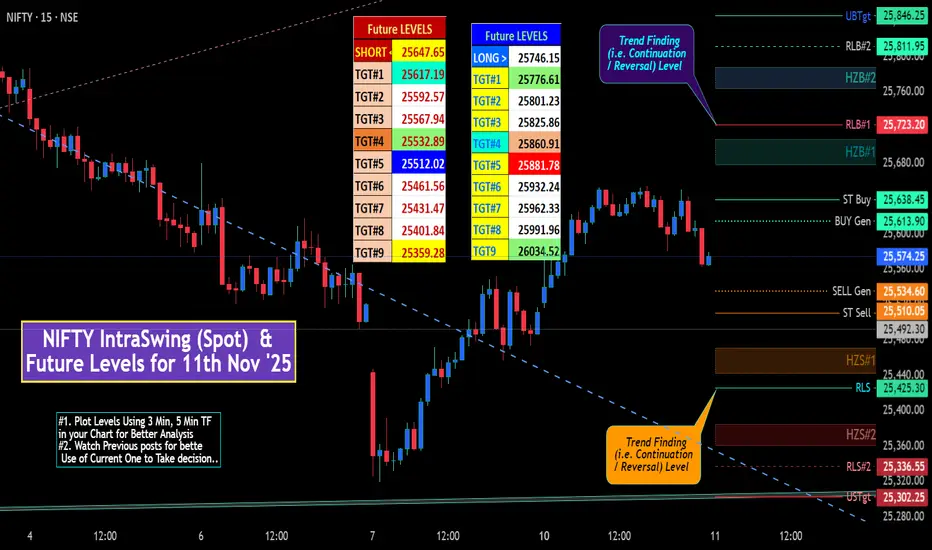
NIFTY IntraSwing (Spot) & Future Levels for 11th Nov '25✍🏼️ "Future IntraSwing Levels" mentioned in BOX format.
✍🏼️ "WEEKLY Levels" follow Sunday / Saturday's Post.
L#1: If the candle crossed & stays above the “Buy Gen”, it is treated / considered as Bullish bias.
L#2: Possibility / Probability of REVERSAL near RLB#1 & UBTgt
L#3: If the candle stays above “Sell Gen” but below “Buy Gen”, it is treated / considered as Sidewise. Aggressive Traders can take Long position near “Sell Gen” either retesting or crossed from Below & vice-versa i.e. can take Short position near “Buy Gen” either retesting or crossed downward from Above.
L#4: If the candle crossed & stays below the “Sell Gen”, it is treated / considered a Bearish bias.
L#5: Possibility / Probability of REVERSAL near RLS#1 & USTgt
HZB (Buy side) & HZS (Sell side) => Hurdle Zone,
*** Specialty of “HZB#1, HZB#2 HZS#1 & HZS#2” is Sidewise (behaviour in Nature)
Rest Plotted and Mentioned on Chart
Color code Used:
Green =. Positive bias.
Red =. Negative bias.
RED in Between Green means Trend Finder / Momentum Change
/ CYCLE Change and Vice Versa.
Notice One thing: HOW LEVELS are Working.
Use any Momentum Indicator / Oscillator or as you "USED to" to Take entry.
⚠️ DISCLAIMER:
The information, views, and ideas shared here are purely for educational and informational purposes only. They are not intended as investment advice or a recommendation to buy, sell, or hold any financial instruments. I am not a SEBI-registered financial adviser.
Trading and investing in the stock market involves risk, and you should do your own research and analysis. You are solely responsible for any decisions made based on this research.
"As HARD EARNED MONEY IS YOUR's, So DECISION SHOULD HAVE TO BE YOUR's".
Do comment if Helpful .
In depth Analysis will be added later (If time Permits)
#AN027: US Shutdown Agreement, Effects on the Dollar and Forex
The historic political impasse in the United States – with the 2025 United States federal government shutdown – appears to be nearing a resolution. Hello, I'm Forex Trader Andrea Russo, an independent trader and prop trader with $200,000 in capital under management. Thank you in advance for your time.
A Senate agreement provides for the reopening of the federal government through a continuing resolution, with the reinstatement of public employees' arrears.
In the FX context, this event has immediate and medium-term implications for the US dollar (USD) and major global currencies. In this article, we analyze the dynamics and provide a guide for those trading on TradingView.
What Happened
The Senate obtained an initial procedural yes to the resolution to reopen the government.
Markets are showing initial relief: the US dollar has halted its recent bullish momentum, pending operational confirmation.
The government shutdown had already caused delays in economic data and a climate of political uncertainty that is hindering the Federal Reserve's clear definition of monetary strategies.
Impact on Forex: Key Factors
1. Political Risk Effect and Sentiment
With the prospect of an end to the shutdown, the risk premium associated with the US government and fiscal governance is decreasing. This tends to favor the dollar in the short term, especially against safe-haven currencies. However, sentiment remains cautious, given the residual uncertainty.
2. Delayed Macroeconomic Data and Volatility
The lack or delay in the release of economic data (e.g., employment, inflation) complicates forecasting the Fed's moves and reduces traders' ability to confidently position themselves on the USD.
3. Yields and Carry Trades
If the agreement fuels an improvement in the US economic profile, US bond yields could rise, attracting flows into the dollar. On the other hand, if the economy shows signs of post-shutdown weakness, the effect could reverse.
4. Technical scenarios in major FX pairs
EUR/USD: Possible dollar rebound → downward pressure on EUR/USD. However, if US data deteriorates, a strong USD-weak trend could be triggered.
USD/JPY: The dollar could benefit from rising yields + carry trades; but a safe-haven turn on the yen if global risks emerge.
GBP/USD / AUD/USD: Commodity or risk-linked currencies could benefit from risk-on, but a strong dollar will limit rebounds.

gold await breakout before buying or selling#XAUUSD price still bullish, but if the gap above 4110-4098 gets rejected then short bearish retrace is expected.
Sell at 4098 on 2 times breakout, target 4054, stop loss 4110.
Above 4103-4110 holds bullish continuation if the first breakout covers above there and H1 closure above the price.

EURJPY BUY THE TREND Will be using a buy limit to enter a buy on Eurjpy and will be keeping things simple with the trend following , very good trade and low risk higher chance to buy than sell

XAUUSD Gold Support and ResistanceSome zones for next week with high probable buy and sell zone
tg- @vedafi

OKLO back to $100 region. Will it hold?Oklo has been a lucky move for me. They're involved in the development of advanced nuclear "micro-reactors" and the Aurora powerhouse.
I only became aware of them when they were provided a contract to provide clean available energy at Eielson Air Force Base in Alaska - a base that I spent a week of my life at during part of Red Flag Alaska in 1997.
I have been following Rolls Royce SMR journey and I'm fascinated by the potential. Whereas #RR. have been swallowed up with UK govt red tape and lethargy the US is moving ahead with this ground-breaking opportunity.
I was able to start building a position in April 25 with a bounce of the 50 Period Weekly MA. Recently price went somewhat wild, and has now had a blow off top and retraced back to the $100 region. My question is - will it find suitable support there? If so then I'll add. If it breaks lower then I'll watch like a hawk.

Long - XAUUSD Hit TP on early MondayAnother week opened, XAUUSD long position hit TP as expected. I took a buy following a strong rejection at support zine. Price closed the week with 4000 after a strong bullish candle/rejected wick, confirming a short term bullish bias and surge with a sharp move earlier this morning.

RedCat back beneath $10 and at the 50 Weekly Period MARed Cat Holdings is a small speculative company dealing in unmanned aerial systems (Drones) for military and commercial use (so it appeals to me). Its very high-risk/ high-reward play.
Their chart has been wild this year, and has involved great swings in both directions. Its a very speculative play. All traders and investors are hoping that they will be able to benefit from new US DoD drone-procurement initiatives.
In the meantime the technical picture has seen price drop beneath $10 and touch the 50 Period Weekly MA - look at how it has responded on previous touches.
They have earnings on Thursday after the close - will that be the catalyst for a bounce higher, or will poor news keep us beneath $10 and slice us through the 50?

I will go short on gold in this area, what do you guys think ?📊 XAAUSD Analysis – CMP Zone Setup
I expect XAAUSD to test the zone, based on my CMP (Current Market Price) technique — a method I use to identify potential reaction areas and key levels from a technical perspective.
🔍 Technical Outlook:
Price is approaching a CMP zone that may act as a reaction point.
I’ll be monitoring closely for a bearish engulfing pattern as confirmation before entering a trade.
🎯 Trade Plan:
Stop Loss: 50 pips
Take Profit: 1:2 or 1:3 R:R
Setup Type: CMP Reaction + Engulfing Confirmation
⚠️ Disclaimer:
This analysis reflects my personal technical view and is not financial advice. Always do your own research before taking any trade.

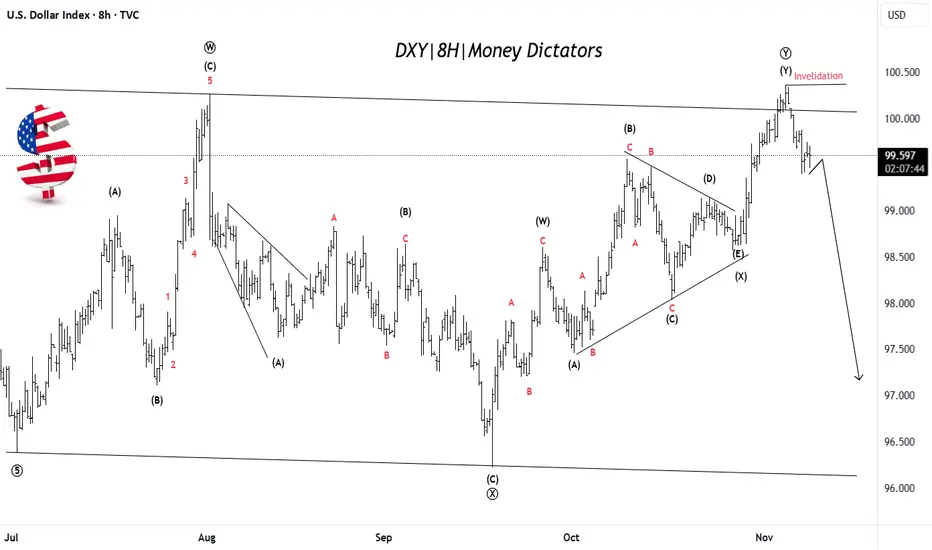
US Dollar Weakness Likely After Final Push UpDXY has completed a complex corrective W–X–Y pattern, with the final leg (Y) recently topping near the 100.50 zone. Price has failed to break above the invalidation level, suggesting the uptrend is losing strength. This signals that the dollar may have finished its corrective phase and could now start a fresh bearish wave targeting lower zones near 97–98. The overall structure indicates that momentum is shifting from bullish to bearish. In simple terms: rally is likely over → downside move toward new lows expected next.
Stay tuned!
@Money_Dictators
Thank you :)
Will Bitcoin goes for 14500? WeeklyThis is the last analysis's weekly time frame chart.
Everything is clarified in the chart you can see upgoing and downgoing cycles after every bitcoin halving.
RSI had a downward breakout the red RSI trend line named T1 and pull backed to it in the weekly timeframe where you can see a little red rectangle and arrow there. The continuation of the RSI path is probably like the blue line drawn named R1.
About the BTC price, I am expecting the price to reach 14500 - 19000 dollars until Dec 2022. of course, it can reach that target a few months earlier or late.
Note that before Halving 2024 bitcoin will not have ATH. It means before Apr 2024 bitcoins price will be under the 69000 and even maybe 50000 dollars. After that time the price will go to 120000 dollars.
Do not forget that the trend of the bitcoin and crypto market is still downward and bearish.
You can see my idea about this analysis in a monthly time frame in another published idea on my profile page.

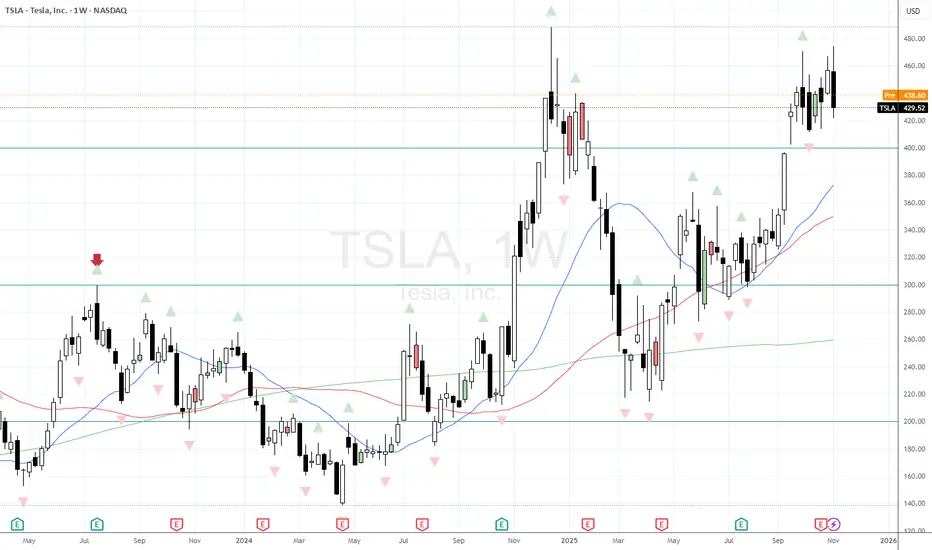
Tesla prints a weekly Key Reversal as part of a triple topTesla has been a volatile stock this year - and difficult to trade because of that.
However I now see that we've printed a weekly bearish key reversal as part of a double/ triple top. Is this now indication that we're likely to flow lower in the immediate future?
Well I am expecting some giddiness if they manage to end the US Gov't Shutdown, so it may help push prices higher for a day or two...and then the trend re-exerts itself?
Bearish in the short term after the relief rally bump.
Despite the doom & gloom in Global Indices the ISEQ is doing okThere's a lot of doom & gloom recently about lobal Equity Indices and whether the good run is over. One Index that has been bucking the trend is the Irish Stock Exchange #ISEQ.
We looked at it earlier in the year where it had been going sideways with little intent on future direction.
We now have a breakout and a move above 12000. Personally I was hoping for a retest of 12000 as a springboard higher. Price action remains bullish.

EURUSD 4Hour analysisThe EURUSD may continue its upward trend to continue sweeping the Trendline liquidity, and it may bounce back at the order block above the trend line. However, there is liquidity above this level, so it is best to wait for a sell signal with this order block.

ETH Daily: Tracking S&D Reaction and the Deeper QML SetupHi!
Price is currently pulling back toward a key Supply & Demand zone, where a short-term bullish reaction is still possible. This level acted as resistance previously and now lines up as a logical retest area after the recent drop.
However, the broader structure suggests that even if we do see a bounce here, it may only form a temporary correction before the price reaches deeper liquidity. The QML zone below remains the major point of interest.
A sweep into that QML area would fill remaining inefficiencies and tap into the stronger demand needed for a more convincing reversal. From there, the chart opens the possibility for a larger bullish leg heading into 2026.
In short:
Watching for a short-term reaction at S&D
Still expecting a deeper move into QML
That zone holds the higher-probability long setup
This scenario remains valid as long as the structure continues to unwind toward the lower liquidity pool.
