Aster short back to $0.5785 area todayGood afternoon ladies and Gents. Just opened a new short on SEED_WANDERIN_JIMZIP900:ASTER
🛑Sl: $0.6594
🎯Tp1: $0.5904
🎯Exit: $0.5785
💰2.85-3.45RR
DTT strategy applied. Analysis suggest another corrective move down
🕐Time sensitive
Beyond Technical Analysis


This Is a Gamble… Backed by Other People’s GamblingI am opening a short-term speculative options position in Robinhood ahead of earnings based on a volatility-driven activity thesis.
Why I Expect Strong Results
Q4 reflects trading conditions during October–December, a period that saw a sharp increase in market volatility and significant crypto market swings. Robinhood’s revenue is highly sensitive to retail trading activity, especially in options and crypto, which historically surge during volatile market conditions.
Higher trading volume tends to scale revenue quickly, while operating costs grow more slowly. This operating leverage can lead to outsized EPS growth when platform activity accelerates.
Earnings Expectation
I am positioning for:
Strong EPS beat (~20% potential)
Solid revenue beat (~10% potential)
Positive forward guidance tied to trading activity and engagement
Expected Price Reaction
If strong results are combined with constructive outlook, HOOD could realistically move approximately +8% to +15% post earnings.
Position
Long $95 Call (3 DTE)
Entry ~ $1.30
Risk defined to premium paid
Trade Objective
This is a catalyst and momentum trade designed to capture rapid repricing and potential retail-driven continuation after earnings.
Exit Plan
Primary exit is planned during the first trading session after earnings if the stock gaps higher. I intend to close or scale out early to avoid IV crush and rapid time decay.
Risk
Post-earnings volatility compression
Earnings beat may already be priced in
Short-dated OTM options have low probability but asymmetric upside

Bullish till the weekly close below the 30wIf get the weekly close then its there is the fractal pattern it could follow - not exactly the same but can be a guide.

AUD/USD Surge: Navigating the Aussie’s Three-Year HighThe AUD/USD pair recently shattered market expectations by climbing past the 0.7100 threshold. This rally marks a definitive three-year peak for the Australian Dollar. Domestic monetary strength and shifting global dynamics drive this impressive performance. Investors now prioritize the Australian Dollar as a premier "risk-on" asset.
The Monetary Pivot: RBA Takes the Lead
Hawkish commentary from the Reserve Bank of Australia (RBA) ignited the latest surge. The RBA maintains a restrictive stance to combat persistent inflation. Unlike its global peers, the RBA resists premature interest rate cuts. This policy divergence creates a significant yield advantage for the Aussie Dollar.
Geostrategic Leverage and Critical Minerals
Australia occupies a vital position in the modern global supply chain. Its geostrategy focuses on providing critical minerals to Western allies. Nations prioritize Australian lithium and rare earths to decouple from volatile markets. These strategic partnerships ensure consistent capital inflows and bolster the currency's value.
Industrial Innovation and Business Excellence
Australian mining giants lead the world in automation and high-tech integration. Companies deploy autonomous fleets to maximize efficiency and safety. These innovations lower operational costs and increase export volumes. Such robust business models attract significant foreign direct investment into the Australian economy.
Leadership and Corporate Culture
Australian corporate leaders embrace agile management and transparency. They foster cultures that prioritize sustainable growth and technological adoption. This leadership style builds immense investor confidence in Australian equities. Strong corporate governance provides a stable foundation for currency appreciation during volatile periods.
Technological Sovereignty and Cybersecurity
Australia invests heavily in quantum computing and biotechnology. Rising patent filings in green hydrogen technology showcase a diversifying economy. Simultaneously, the government enforces world-class cybersecurity frameworks to protect financial infrastructure. This digital resilience encourages institutional traders to maintain long-term positions in AUD.
Macro Outlook: Risk Appetite and Data
The current market environment reflects a rampant appetite for risk. Global traders are moving away from the safe-haven US Dollar. Upcoming US Non-Farm Payroll data will likely dictate the next short-term move. However, the structural strength of the Australian economy suggests a continued bullish trajectory for AUD/USD.

Nasdaq Short Is Playing Out - TGT 24'080First, Nasdaq has failed to make a new high.
Then price dropped, missing the red CL by just a couple of points. Is this really a miss?
Let’s play: *What if…*
The white fork measured how far price could pull back. As we Forkers know, there was about an 80% probability that price would retrace to the white Centerline - and indeed, the CL was reached.
Now it looks like price is turning on a dime.
Next target: the red Centerline around 24,080–24,000.
Here I’m sharing some deeper insights on the lower time frames:
Questions and comments are always appreciated.

XAUUSDHello Traders! 👋
What are your thoughts on GOLD?
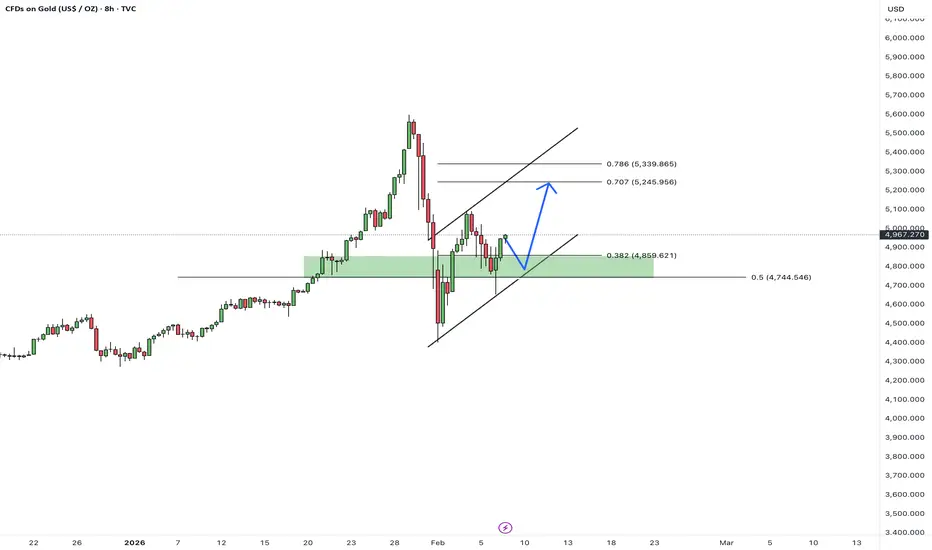
After a strong and sharp bullish rally, Gold faced a severe bearish correction, dropping significantly from recent highs. However, the market has shown a positive reaction, recovering a portion of the losses. Currently, price is moving within a rising channel.
As long as the marked support zone holds, our bias remains bullish.
We anticipate some consolidation and fluctuation in this area before the price gathers momentum to resume the uptrend.
What are your thoughts? Will the support hold? Let me know in the comments!
Don’t forget to like and share your thoughts in the comments! ❤️
Natural Gas Mid-Season Update 2/9/262/8/26
After much consternation and many requests, I have put some time aside to put out a mid-season update. If you were lucky enough to take part in the historic run up, and drop down in prices the past 30 days, consider yourself well prepared for what I believe is about to come next. After all, once in a lifetime events are only supposed to happen, well, once in a lifetime. But I believe that we just might be setting up for a part two in the NG trade of a lifetime. First a brief understanding that the historic runup in the price of NG was primarily due to two events. The normal, mid-seasonal drop in NG prices, due to the expected January thaw. Which saw a market overly shorted. Due to the ever-increasing supply coming on in the market and the lack of expected demand in LNG terminals completing completion. Plus, the AI hype. Industry experts assured market participants that LNG and AI would deplete underground storage, and NG would be soon at historic heights. But as the late fall cold failed to shrink storage levels below 5-year averages, and injections continued well into withdrawal season, a familiar component of high NG prices reared itself in mid-December, the POLAR VORTEX. Soon many were caught off guard, as the early November rolled over and price began it steady climb to 5000 level. But when models began to predict the January thaw in mid-December, prices began their seasonal decent from withdrawal season highs. Or so traders thought. Some traders knew that this winter would be different. That, this polar disruption might just be here to stay for the foreseeable future. Plus, the synoptic teleconnections, ocean temps and early Siberian ice cover could possibly bring a different winter than years past. Which brings us to mid-January and the historic short squeeze. There are many insiders who indicate that 100% of Algos were short into the weekend of January 17-18. Which brought us to a multiyear high on 7439 on the NYMEX the day of options expiration. Now I had previously stated that there were two reasons, the first being the shorts. But the second, being the historic run up in spot prices at delivery hubs all on the US. See, after 2021 and winter storm Uri, natural gas end users were required to have one week spot pricing purchased in advanced after storm Uri shot same day delivery pricing to some of their highest levels on record. Which caused a series of events that led to final delivery consumers of electricity paying prices so high, that in some areas during that extreme cold spell would have bankrupted individuals, if it were not for government involvement. So, due to the high spot pricing and the short in the market, there was a rush for seller and buyers alike to see the price of NG hit the 7000 plus on contract expiry.
Now, that’s all in the past and that could never happen again, right? Well, like I stated earlier, this winter is going to go down as a winter of a lifetime. There continues to be indicators that this coming 10 days is another thaw that will be followed by another 20-day pattern of historic cold. Historic Arctic air to be specific. There is another Polar Vortex disruption in the works, and the teleconnection are beginning to confirm this. It is just that the models have not yet had the ability to see it due to the 15-day forecast they print. One would think that large institution trader learned their lesson being all short on the wrong side of the trade. Well, you would be wrong, and they might just be on the wrong side of the trade again. In my video I will explain how the Polar Vortex is again rearing its cold ugly head, it is showing up in Europe as I type. We like to look at Europe as the canary in the coal mine, for cold weather in the eastern US (where the population-based winter heating demand is). The two big winter teleconnections, the WPO and the AO are switching back to cold signals, there is still massive snow cover in the north and eastern US. The Great Lakes are almost completely frozen over, and we just switched to a 5-year deficit for NG storage. The best part is this cold should show up intime for contract roll over, which would lead to a situation like January, where users of NG would be forced to buy into an overly short market, that will have the beginnings of a squeeze, due to having to have one-week deliverable pricing due to spot prices rising. Not only does late February and early March look like historic cold, but we could again be looking at multi-year highs in pricing, before the shoulder season is upon us. So hit play on the video and decide for yourself. What will you tell you grandkids about the 2026 Nat Gas trading season. Were you one of the winners in the great squeeze of 26?
I do not believe that price will close the gap from mid-January, but there is a good possibility we find support at the 3000 level. We just fell below the 32.8% at 3280, Sunday Asia open. I expect that we will see rallies sold into until we either find support somewhere around 3000, or the model runs start to show what some of us are seeing. That we will finish this season having withdrawn storage to 1.5 TCF. We were on track 10 days ago of projection seeing storage down at 1.4 TCF, and there is a good possibility we end lower. This would set up the summer strip at an average of 4500. We are currently undervalued in the current contract, and the T+1 is a whopping 39% undervalued. So, if this plays out and the cold stays on until mid-March, this will not be a short the peak moment. Yes, there will be some consolidation, but do not wait for this to pan out and play the pricing down. Storage will be depleted, in the US and most importantly Europe. LNG will be producing at or above 20 BCF/d, and there will be a price war between the two competing factions. Keeping HH pricing elevated into the summer season, where another 2 BCF/d of LNG is planned to come online. The technicals have been set. 3000 is the floor and the high is now 7438. But we must first contend with the immediate high at 4425, and the 2025 high for NGH26 at 4811.
Keep it burning!

$USDT Dominance Update. Watch this level for the next move!!USDT Dominance is currently holding a critical Fibonacci support zone between 7.64% and 7.95. This area represents a key decision point for the trend.
As long as the price remains above this Fib support, the structure favours continuation toward the 8.2%–8.9% region, which would keep pressure on BTC and altcoins as liquidity stays parked in stablecoins.
A sustained break below this zone would be the first signal that risk appetite is returning to the market.
DYOR | NFA
Please show your support and hit the like button if you like it.
Do follow me on my other socials as well to stay updated!
Cheers
PEACE

Is Copper Next to Rally After Silver and Gold?Last week, we came across news: China calls for more copper stockpiling.
Therefore, is Copper Next to Rally After Silver and Gold?
Why Is China Stockpiling Copper?
Micro Copper
Ticker: MHG
Minimum fluctuation:
0.0005 per pound = $1.25
Disclaimer:
• What presented here is not a recommendation, please consult your licensed broker.
• Our mission is to create lateral thinking skills for every investor and trader, knowing when to take a calculated risk with market uncertainty and a bolder risk when opportunity arises.
CME Real-time Market Data help identify trading set-ups in real-time and express my market views. If you have futures in your trading portfolio, you can check out on CME Group data plans available that suit your trading needs www.tradingview.com

GOLD Price Update – Clean & Clear ExplanationGold reflects a period of tight consolidation following a prior directional move. Price action is compressed within a narrow range, suggesting temporary balance between buyers and sellers. Candles show relatively small bodies with limited follow-through, indicating reduced momentum and hesitation in the market.
Despite the lack of strong directional conviction, volatility remains present, as seen in intermittent wicks that test both the upper and lower boundaries of the range. This behavior points to active participation around key intraday levels, where liquidity is being absorbed rather than aggressively pushed.
Overall, the chart structure suggests a pause or accumulation phase, often preceding a potential breakout or breakdown. Traders would likely be watching for a decisive close outside the current range, accompanied by increased volume, to confirm the next directional move.
“If you come across this post, please like, comment, and share. Thanks!”

short!Hello all. as you see market Go up till reaches to an HFTs zone. I mean it is a Shadow of the Long shadow candle ( a pinbar), and after that it is starting to collapse. you can wait for a correction then start going sell. from now on you should just look for sell positions. be happy(wink)

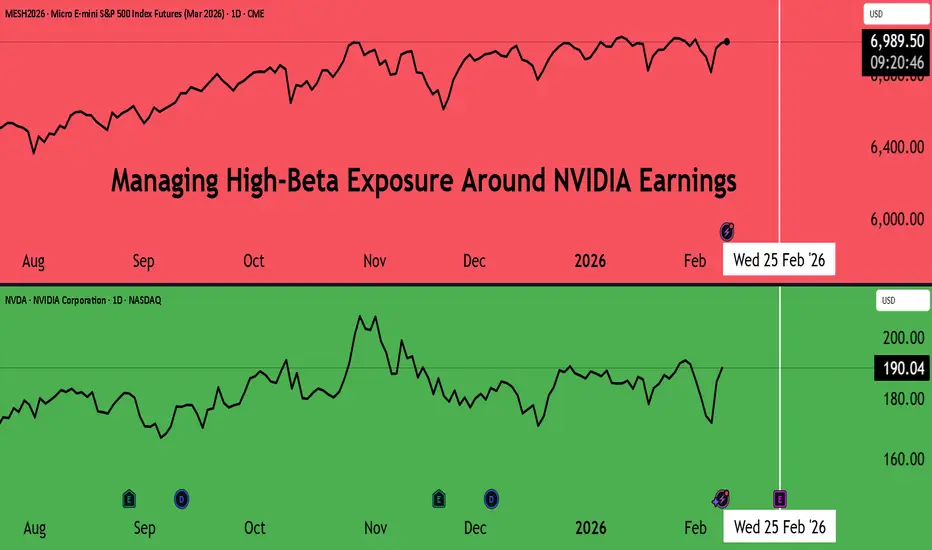
Managing High-Beta Exposure Around NVIDIA EarningsVANTAGE:NVIDIA will report its next quarterly earnings in roughly two weeks, while general expectations around AI infrastructure spending, data-centre utilisation, and margin sustainability remain elevated.
While the long-term AI narrative continues to underpin the stock for NVIDIA, earnings events become even more sensitive given broader apprehensions about the ecosystem.
Strong Fundamentals, Elevated Sensitivity
NVIDIA remains central to the AI compute stack, with its GPUs embedded across hyperscaler data centres, enterprise AI workloads, and increasingly inference-heavy applications.
Source: TradingView
Revenue growth over recent years has been exceptional, supported not just by volume expansion but by sustained pricing power and operating leverage.
Consequently, this success has amplified the stock’s sensitivity to expectations. NVIDIA’s rolling beta to the broader market remains elevated, reflecting both its growth profile and its role as a proxy for AI capital expenditure more broadly. Earnings reactions, therefore, tend to be sharper than those of the broader indices, particularly when positioning and implied volatility are already high into the event.
History shows that even in periods of consistent earnings beats, price reactions around results are not symmetric: upside is often more measured, while downside can be abrupt if guidance, margins, or order visibility disappoint.
Why Index-Based Hedging Matters Around Earnings
Single-stock options are the most direct way to hedge earnings risk, but they also tend to be the most expensive around results. Implied volatility typically peaks into the event, raising the cost of protection precisely when it is most needed.
An alternative approach is beta hedging, using a broader index instrument to offset the portion of NVIDIA’s risk that is driven by market-wide and factor-based moves rather than idiosyncratic fundamentals.
For NVIDIA, a significant share of short-term drawdowns during earnings could coincide with broader risk-off, even when the company’s long-term outlook remained intact. This makes index hedging a useful, cost-efficient tool when deployed thoughtfully.
Source: FactSet
The S&P 500 also enters the upcoming earnings window with expectations already elevated. According to FactSet , analysts are projecting full-year 2026 earnings growth of 14%, with quarterly growth accelerating from 11.3% in Q1 to over 15% by Q3–Q4.
Compounding this sensitivity is a stretched valuation profile: the S&P 500’s forward 12-month P/E stands at 21.5x, above its 5-year (20.0x) and 10-year (18.8x) averages. This combination of strong growth expectations paired with elevated multiples could increase index sensitivity to earnings disappointments from large contributors.
NVIDIA, though, stands out as the single largest contributor to earnings and revenue growth among S&P 500 companies with significant international exposure. FactSet notes that, excluding NVIDIA, earnings growth for internationally exposed firms would fall materially, underscoring how concentrated index-level growth has become.
And although NVIDIA remains a dominant contributor to recent index returns, historical earnings reactions suggest that post-earnings volatility in the stock has increasingly resulted in rotation rather than broad market drawdowns.
In several recent quarters, periods of NVIDIA post-earnings weakness were followed by relative resilience or even outperformance in the S&P 500, as leadership broadened beyond a narrow set of growth names.
Source: CME QuikStrike
From a positioning standpoint, there is a significant build-up of put options for the MES options, with the contract expiring a couple of days after NVIDIA’s earnings. Call interest at 7,250 is high, but is still outweighed by puts, especially around the 6,500 strike level.
Source: CME QuikStrike
Over the past session, though a considerable number of puts were closed, with added OI much more favourable for OTM calls around 7,100, as well as in the money calls around the 6,750 strike.
Under normal market conditions, using MES as a hedge to reduce beta exposure around earnings is a compelling strategy. However, with the most recent changes in options OI for MES futures, the positioning resembles the trends observed in recent historical data regarding the spread between the index and NVIDIA.
Using CME Micro E-mini S&P 500 Options as a Hedge
CME Micro E-mini S&P 500 (MES) options offer a flexible and capital-efficient way to hedge NVIDIA earnings risk: each Micro contract represents one-tenth the size of a standard E-mini, allowing for precise sizing, and liquidity is deep across short-dated expiries.
During Q2 2024, NVIDIA shares declined over 6% in the month following earnings, while the S&P 500 rose almost 2%.
A portfolio combining NVIDIA exposure with a modest MES futures position would have experienced significantly lower volatility than a standalone NVIDIA position, highlighting how index exposure can act as a volatility absorber during single-stock earnings events.
Historical illustration
● Instrument: Micro E-mini S&P 500 Futures
● Index performance: +1.43% over 28 days (and 4.80% over 84 days)
● Entry Level: 5,760
● Exit Level: 5,843 (28 days) and 6,054 (84 days)
● Net index move: 83 index points (28 days) and 296 index points (84 days)
P&L for the MES Futures position: 83 index points × USD 5 per index point = USD 415 per MES contract.
The USD 415 would have offset the losses on the NVIDIA position, while holding it for 84 days would have added USD 1,480 to the gains from NVIDIA’s 9.55% rally over the same period.
For larger portfolios or institutions seeking greater notional exposure, E-mini S&P 500 (ES) futures can be used in place of MES futures, offering the same index exposure with a larger contract multiplier.
This content is sponsored.
MARKET DATA
CME Real-time Market Data helps identify trading setups and more effectively express market views. If you have futures in your trading portfolio, you can check out on CME Group data plans available that suit your trading needs at tradingview.com/cme .
DISCLAIMER
This case study is for educational purposes only and does not constitute investment recommendations or advice. Nor are they used to promote any specific products, or services.
Trading or investment ideas cited here are for illustration only, as an integral part of a case study to demonstrate the fundamental concepts in risk management or trading under the market scenarios being discussed. Please read the FULL DISCLAIMER, the link to which is provided in our profile description.
Major volatility is coming with NFP.⭐️GOLDEN INFORMATION:
Gold (XAU/USD) attracts some dip-buyers following the previous day's modest slide and climbs back above the $5,050 level during the Asian session on Wednesday. Prospects for lower US interest rates keep the US Dollar (USD) depressed near its lowest level in over a week and act as a tailwind for the non-yielding yellow metal. However, the underlying bullish sentiment might cap the upside for the safe-haven commodity. Traders might also opt to wait for the release of the US Nonfarm Payrolls (NFP) report before placing fresh directional bets
⭐️Personal comments NOVA:
Gold prices are consolidating and compressing strongly around 5000-5090. There will be significant volatility awaiting the NFP news results.
⭐️SET UP GOLD PRICE
🔥SELL GOLD zone: 5236 - 5238 SL 5243
TP1: $5220
TP2: $5200
TP3: $5178
🔥BUY GOLD zone: 4897- 4895 SL 4890
TP1: $4918
TP2: $4940
TP3: $4965
⭐️Technical analysis:
Based on technical indicators EMA 34, EMA89 and support resistance areas to set up a reasonable SELL order.
⭐️NOTE:
Note: Nova wishes traders to manage their capital well
- take the number of lots that match your capital
- Takeprofit equal to 4-6% of capital account
- Stoplose equal to 2-3% of capital account

Bullish on the DAX40Looking for price to continue its bullish direction today. Yesterday we were range bound at 25K. And this morning currently seeing price trade below the range. If I see bullish confluences on the LTF, could see price extend towards previous weeks high.
Keeping is nice and simple and always :)
Aman - SMC Wolf FX

NASDAQ – Bearish Bias (30M)
NAS100 is showing clear bearish structure on the 30-minute timeframe after failing to sustain the recent bullish push.
Price has completed a pullback into a key supply zone (25,400 – 25,500) , where strong selling pressure previously entered the market. This area is now acting as resistance, and price is currently stalling with weak momentum, signaling potential distribution.
Structurally, the market remains bearish:
Previous lower high respected
Price is trading below prior key highs
Bullish momentum is weakening at resistance
The current consolidation near resistance suggests buyers are getting exhausted, increasing the probability of a bearish continuation.
Bearish Scenario
If price continues to reject this supply zone, we expect a move lower toward:
25,000 psychological level
Extended target around 24,940, aligning with prior demand and imbalance
Invalidation
A strong bullish close above 25,500 would invalidate this bearish setup and suggest a potential trend shift.

AUS200/ASX200 - THE TIME HAS COMETeam, I have been patient to wait for AUS200 to hit our shorting range 8973-78,
stop loss at 9035
target at 8945-36 - take partial and bring stop loss to BREAK even
Target 2 at 8922-06
LETS GO

The Dow is still bullishAfter price hit full TP (122+ pips) in our previously published setup idea attached to this post, price displaced the structural high signalling more bullish momentum that's showing no sign of weakness for now.
That brings us back to the origin of the displacement in H1 (entry).
This week, the first NFP for the year will be released and today is ADP employment, let's see if price is able to start pushing down to trap early buyers before Wednesday NFP to push price to the ATH after tapping us in.
SL: 8.2 pips (extend to 10 pips for space)
TP: 100 pips
RR: 1:12+

Gold may consolidate short-term before a breakout.📊 Market Overview:
Gold (XAU/USD) is currently trading around the 5030–5050 USD/oz zone as the market awaits inflation data and policy signals from the Fed. The USD has weakened slightly, but US bond yields remain elevated, preventing gold from breaking out strongly and keeping the market in a consolidation phase.
📉 Technical Analysis:
• Key Resistance: 5055 – 5065 | 5100 – 5120
• Nearest Support: 5010 – 5000 | 4975 – 4960
• EMA: Price is trading above the EMA 09 on H1 but below the EMA on H4, indicating a short-term bullish bias while the medium-term trend remains mixed.
• Candlestick / Volume / Momentum: H1 candles show small bodies with decreasing volume → consolidation signal. RSI is around 55–60, not in overbought territory, suggesting room for upside but lacking strong breakout momentum.
📌 Outlook:
Gold may rise slightly or continue to move sideways in the short term if the USD does not strengthen and inflation data does not exceed expectations. However, a break below 5000 could trigger stronger downside pressure.
________________________________________
💡 Trading Strategy:
SELL XAU/USD: 5100 – 5103
🎯 TP: 40 / 80 / 200 pips
❌ SL: 5107
BUY XAU/USD: 5000 – 4997
🎯 TP: 40 / 80 / 200 pips
❌ SL: 4993

Gold May Consolidate Short-Term Before Breakout📊 Market Overview:
Gold is trading around 5025 USD/oz as markets await new signals from US economic data and expectations that the Fed will ease monetary policy. A slightly weaker USD and ongoing safe-haven demand continue to support gold above the psychological 5000 level.
📉 Technical Analysis:
• Key Resistance: 5055 – 5100
• Nearest Support: 5000 – 4970
• EMA: Price remains above EMA 09, indicating a short-term bullish bias.
• Candlestick / Volume / Momentum: Gold is forming a range consolidation pattern with declining volume, suggesting a potential breakout. Momentum remains positive but slightly weakening.
📌 Outlook:
Gold may continue to rise if it holds above 5000 and breaks 5055; otherwise, a pullback is likely if 5000 is broken.
________________________________________
💡 Trading Strategy Suggestion:
🔻 SELL XAU/USD at: 5057 – 5060
🎯 TP: 40 / 80 / 200 pips
❌ SL: 5063
🔺 BUY XAU/USD at: 4975 – 4972
🎯 TP: 40 / 80 / 200 pips
❌ SL: 4969

SPY – Feb 11 Market Preview: Compression Before ExpansionSPY spent the session consolidating just under the 696–697 resistance zone after the strong recovery off 670s earlier this week. The structure on the 15m remains constructive, but momentum has clearly slowed. This is no longer expansion — this is positioning.
We are sitting inside a tight value pocket between 692–697. These are the kinds of ranges that frustrate impatient traders and reward those who wait for confirmation.
Market Structure (15m Focus)
Price reclaimed prior breakdown structure and built higher lows from 670 → 686 → 692. That’s bullish repair.
However, we are now compressing right under:
* 696–698 call wall / gamma resistance
* Prior supply zone
* Short-term liquidity above equal highs
This creates a decision area, not an automatic breakout.
As long as SPY holds above 692–693, bulls maintain short-term control. Lose that level, and we likely rotate back toward 690, with 686 below as next liquidity pocket.
GEX & Options Flow Context
From the options side:
* Heavy call interest stacked 697–698
* Put support building around 690
* Overall gamma leaning positive
Positive gamma usually compresses volatility and pins price near high OI strikes. That aligns with today’s range behavior.
Translation:
Expect controlled moves until a wall is cleared.
A clean acceptance above 698 would likely trigger dealer hedging flows and open 700–702 quickly.
Failure and breakdown under 692 flips tone short-term and reopens 690–686.
Trade Plan Into Feb 11
Bullish Scenario
Break and hold above 697–698 on volume → target 700–702.
If momentum builds, continuation toward 704 is possible.
Bearish Scenario
Lose 692 with acceptance below → quick test of 690.
If 690 fails, 686 liquidity becomes magnet.
No edge inside 693–696 chop. Let the level break first.
This is a compression market.
Compression markets:
Reward patience.
Punish anticipation.
Do not front-run walls.
Do not assume breakout.
Wait for confirmation and react.
The expansion move will likely be clean once it starts.
Overall, SPY is neutral to slightly bullish while above 692.
Break 698 then trend continuation.
Lose 692, we will see pullback.
Let the level decide.
Disclaimer: This analysis is for educational purposes only and does not constitute financial advice. Always manage risk and trade responsibly.

US30 Consolidation Growth momentumUS30 trading within a well-defined ascending channel, confirming a medium-term bullish trend. Price has consistently respected both the upper resistance and lower support boundaries of the channel, indicating strong trend structure and controlled momentum.
Recently, price produced a strong impulsive bullish breakout from the mid-range consolidation zone, pushing above prior resistance around the 49,600–49,800 area. This move suggests renewed buying strength and continuation intent.
Tecnically the breakout, price is currently consolidating just below the upper channel resistance, forming a short-term pullback this behaviour is typical of bullish continuation, where the market digests gains before the next directional move.
You may find more details in the chart,
Trade wisely best of luck buddies.
Ps; Support with like and comments for better analysis Thanks for Supporting.

USDJPY review for todayA Brief Analysis of USDJPY making key moves. We look at longer term structure before moving into short term structure showing the full situation.
This could be a turning point for JPY strength with politics going on. Interesting times.
