Resistance 5141 - Fibo 0.618 , GOLD today Related Information:!!! ( XAU / USD )
Indirect negotiations between the United States and Iran over the future of Tehran’s nuclear program concluded on Friday with a broad consensus to pursue a diplomatic track. The outcome has helped to alleviate fears of a potential military escalation in the Middle East, lifting investor confidence and reinforcing risk-on sentiment. As a result, capital has rotated away from traditional safe-haven assets, including gold, during the Asian session on Tuesday.
Commenting on the talks, Iranian Foreign Minister Abbas Araghchi characterized the eight-hour discussions as a constructive first step conducted in a positive atmosphere. US President Donald Trump also described the negotiations as “very good,” adding that a follow-up meeting is expected to take place early this week.
personal opinion:!!!
Gold prices are primarily awaiting NF news this week, with accumulation and a potential rebound back to the 5141 resistance level according to the 0.618 Fibonacci retracement.
Important price zone to consider : !!!
Resistance zone point: 5086, 5141 zone
Support zone : 4967 , 5000 zone
Follow us for the most accurate gold price trends.
Beyond Technical Analysis

USDJPY review for todayA Brief Analysis of USDJPY making key moves. We look at longer term structure before moving into short term structure showing the full situation.
This could be a turning point for JPY strength with politics going on. Interesting times.

`bitcoin await breakout#BTCUSD price await 69900 for bullish trend, after break there it will reach 70545 which shows another trend on H4. Valid breakout there will push price to 72k,74k
Buy stop 69900, target 72k,74k, SL 68700.
Below 68200 break holds sell continuation till 65k

General Market Overview and Focuses for the WeekLooking at general overview of where things stand, what my focuses are and reaching out in friendship if you guys want to network.

XAUUSD BullishGold breakout resistance zone then cureent trend futher extend.
Support levels:
5035
5020
5000
Resistance levels:
5063
5081
5100
5120
5150

USD/CAD presses higher as trader consensus favors upside continCurrent Price: 1.37122 (Analysis was generated on Monday Morning)
Direction: LONG
Confidence level: 62%(Several professional traders highlighted bearish stress and net‑short positioning in the Canadian dollar, while price holds above short‑term support. Social data is limited, which lowers confidence but still favors USD/CAD upside.)
Targets
Target 1: 1.3725
Target 2: 1.3800
Stop Levels
Stop 1: 1.3630
Stop 2: 1.3600
Key Insights:
Here’s what’s driving this setup. Multiple traders pointed out that the Canadian dollar is showing signs of weakening under the surface, especially when you look at positioning data and stress indicators. Trade uncertainty between the U.S. and Canada keeps resurfacing in trader discussions, and that tends to cap CAD strength quickly when rallies appear.
What’s interesting is that even traders who mentioned short‑term choppiness didn’t argue for sustained CAD strength. The broader takeaway from the professional trading community is caution on the loonie rather than confidence. That’s why, despite some mixed comments, the weight of opinion still leans toward upside risk in USD/CAD.
Recent Performance:
You can see this play out in recent price action. USD/CAD has been holding in the mid‑1.36 to low‑1.37 area and is now trading around 1.371. Pullbacks toward 1.363–1.365 have attracted buyers, and the pair hasn’t broken down despite softer U.S. dollar moments. That resilience matters for a short‑term LONG trade.
Expert Analysis:
Several professional traders are watching the 200‑day moving average zone around 1.368–1.370 closely. Price pushing and holding above that area opens the door for a move toward the 1.3725 region, which has been flagged as a near‑term ceiling. A clean push beyond there brings the psychological 1.38 level into play for this week.
At the same time, traders consistently mentioned 1.363 and 1.360 as important downside reference points. If those levels fail, the LONG thesis weakens quickly, which is why stops are tight below that zone.
News Impact:
The news flow isn’t giving CAD a strong tailwind. Ongoing tariff discussions, soft spots in Canadian data, and uncertainty around upcoming central‑bank messaging keep traders cautious. Without a clear positive catalyst for the loonie, USD/CAD has room to grind higher in the near term, especially if risk sentiment wobbles.
Trading Recommendation:
Here’s my take. I’m favoring a LONG position in USD/CAD for this week, looking for a push toward 1.3725 first and potentially 1.3800 if momentum builds. I’d keep risk controlled with stops below 1.363, because a break there would tell me the trader consensus is wrong and CAD strength is taking over. Position sizing should stay moderate given the mixed backdrop, but the edge still points higher.

Agency MBS ETF eyes a steady push higher as yield demand buildsCurrent Price: 8.77 (Analysis was generated on Monday Morning)
Direction: LONG
Confidence level: 52%(Limited trader and social data, but price is near support with favorable income and rate stability dynamics supporting upside.)
Targets
Target 1: 8.95
Target 2: 9.05
Stop Levels
Stop 1: 8.65
Stop 2: 8.55
Key Insights:
Here’s what’s driving this trade. Agency mortgage-backed securities continue to benefit from strong carry, very low beta, and improving relative value versus Treasuries. With yields still attractive and volatility contained, the ETF is sitting in a zone where income-focused buyers typically step in. I’m seeing that dynamic reflected in recent price stability around the mid-$8.70s.
What’s interesting is how asymmetric this setup looks for a short-term trade. Downside over a week is limited unless rates spike sharply, while upside doesn’t require a big macro shift—just steady demand from yield-seeking flows. That imbalance is why I’m leaning long despite the lack of loud social chatter.
Recent Performance:
Price action has been tight and orderly, holding above the $8.60–$8.70 area after drifting lower earlier in the range. Over the past sessions, the ETF has shown small intraday ranges and consistent closes, a typical pattern before slow grind moves higher in bond-linked products.
Expert Analysis:
Several professional traders I track consistently point out that agency MBS tends to perform best when rate volatility cools and the curve stabilizes. That’s exactly the environment we’re in right now. The ETF’s extremely low beta means it won’t rip higher, but it also doesn’t need much help to edge up 2–3% in a week.
From a technical perspective, price is closer to support than resistance within the 52‑week range. When I see that positioning combined with positive carry, I default to the upside for short-term trades.
News Impact:
Recent market commentary around MBS pricing shows modest gains and stable demand, with mortgage rate moves remaining orderly. Broader 2026 outlook pieces continue to highlight agency MBS as a favored income sector, which quietly supports near-term price action even without headline catalysts.
Trading Recommendation:
Putting it all together, this looks like a straightforward LONG with tight risk control. I’d stay long above $8.65, look for a push toward $8.95 first, and trail stops if momentum carries toward $9.05. This isn’t a fast trade—it’s a patience play built around stability, carry, and incremental upside.

DIA Stalling as Buyers Lose Urgency:Current Price: 50115.67 (Analysis was generated on Monday Morning)
Direction: SHORT
Confidence level: 85%(Trader consensus remains unified across group metrics.)
Targets
Target 1: 49650
Target 2: 49200
Stop Levels
Stop 1: 50750
Stop 2: 51200
Key Insights:
DIA is telling the same story as futures. Price is hovering near highs, but it’s not attracting aggressive buyers anymore. I’m tracking the $50,100 area closely—price is above it now, but it doesn’t look comfortable.
What stands out is how quickly sellers show up on intraday strength. That’s classic short-term distribution. It doesn’t scream panic, but it does say upside is limited for the next few sessions.
Recent Performance:
DIA has held up well into February 2026, but the last push higher lacked momentum. The ETF is moving more sideways than up, which often precedes a dip.
Expert Analysis:
YouTube traders focused on index ETFs are mostly neutral-to-cautious, with several saying they’d rather short resistance than chase breakouts. On X, sentiment is mixed but calmer—less FOMO, more “wait and see.” That combo usually favors shorts near highs.
News Impact:
No major Dow-specific catalysts are hitting this week, so technical pressure matters more. In quiet news environments, stretched charts tend to mean revert.
Trading Recommendation:
I’m SHORT DIA for this week, aiming for a controlled pullback rather than expecting a breakdown.

NYSE Composite cracking support as downside pressure builds:Current Price: 23252.81 (Analysis was generated on Monday Morning)
Direction: SHORT
Confidence level: 63%(Several professional traders point to weakening momentum, repeated support tests, and fading rallies, suggesting short-term downside risk despite limited social data.)
Targets
Target 1: 22900
Target 2: 22600
Stop Levels
Stop 1: 23550
Stop 2: 23900
Key Insights:
Here’s what’s driving the trade. Multiple traders described the NYSE Composite as broadly stable but heavy, with mixed sector performance and no clear leadership. That kind of tape usually favors sellers on rallies rather than buyers chasing strength. What caught my attention is how often the 22,900 and 22,600 levels came up as key pivots for the week — traders see these as natural downside magnets if current pressure continues.
Another important angle is momentum. Professional traders pointed out weakening short‑term indicators and price sitting below key moving averages. That doesn’t guarantee a straight drop, but it does tilt odds toward another leg lower before any meaningful bounce shows up.
Recent Performance:
The NYSE Composite has pulled back roughly 1% recently, sliding from the 23,000 area into the low 23,200s. Attempts to recover have been sold into quickly, and price has spent more time drifting lower than building a base. This kind of action usually tells me sellers are still in control in the very near term.
Expert Analysis:
From the trader analysis I reviewed, the consensus isn’t panic — it’s caution. Several traders emphasized that unless the index can reclaim the 23,500 area decisively, rallies are likely to fade. The repeated references to a possible move toward 22,900, and then 22,600 if selling accelerates, give clear structure for a short‑term downside trade this week.
News Impact:
Macro headlines around inflation and interest rates continue to hang over equities. Traders are reacting to the idea that rates may stay higher for longer, which tends to pressure broad indices like the NYSE Composite. Without a positive catalyst, the news flow is doing little to support aggressive buying right now.
Trading Recommendation:
Here’s my take. I’m favoring a SHORT position at current levels, targeting a move back to 22,900 first and potentially 22,600 if selling pressure persists this week. Risk is clearly defined above 23,550, with a hard stop near 23,900 in case the index squeezes higher. This is a tactical, short‑term trade based on trader consensus around weakening momentum, not a long‑term market call.

Fetch.ai near key support: traders eye a short-term bounce:Current Price: 0.16539 (Analysis was generated on Monday Morning)
Direction: LONG
Confidence level: 62%(Price is holding a well-tested support zone with increasing volume and early momentum signals, despite limited trader commentary.)
Targets
Target 1: 0.170
Target 2: 0.185
Stop Levels
Stop 1: 0.160
Stop 2: 0.155
Key Insights:
Here’s what’s driving this trade idea. Fetch.ai is trading just above the $0.160 support, a level that’s been tested multiple times recently. Several traders highlighted this zone as an area where buyers tend to step in. The fact that price hasn’t lost it yet is important. When I see price hovering near support instead of collapsing through it, I start thinking upside attempt, even if it’s only a short-term move.
What’s interesting is the volume behavior. Trading volume jumped roughly 45% versus the recent average, which tells me participation is picking up. That doesn’t guarantee direction, but it does suggest the next move could be more decisive. On shorter timeframes, MACD momentum has started to curl upward, which several traders interpret as early bullish pressure building.
Recent Performance:
Over the last 24 hours, Fetch.ai has drifted slightly lower, down just over a tenth of a percent, while staying in a tight range between roughly $0.161 and $0.167. Zooming out to the past week, price action has been choppy but contained, with buyers repeatedly defending the lower $0.16 area. That kind of behavior often precedes a relief bounce rather than an immediate continuation lower.
Expert Analysis:
Multiple traders I’m tracking are focused on the $0.170 level. They see it as the line that changes the tone in the short term. A push above it, especially with volume holding above $40–45M, opens the door toward the mid-$0.18s. On the downside, the same traders consistently point to $0.160 as the line in the sand. Lose that, and the risk shifts quickly toward $0.155.
Technically, RSI around the mid‑40s suggests there’s room for upside without being stretched. The short-term EMAs are just overhead, which is why I’m keeping targets realistic and stops tight. This is a tactical trade, not a long-term thesis.
News Impact:
Recent partnership headlines and exchange-related liquidity news have helped keep interest alive in Fetch.ai. None of this is explosive on its own, but it does provide enough background support to justify buyers defending current levels. Upcoming developer updates and token supply reports over the next two weeks are also on traders’ radar and could act as short-term catalysts.
Trading Recommendation:
Putting it all together, I’m taking a LONG bias here based on price sitting at support, improving momentum signals, and rising volume. I’d look for entries close to the current price, target $0.170 first, then $0.185 if momentum follows through. Risk management is key: a clean break below $0.160 invalidates the setup, which is why stops are tight. This isn’t a high-conviction swing, but it’s a reasonable short-term trade with defined risk.

NEAR Protocol hovering at support — looking for a short-term boCurrent Price: 1.07454 (Analysis was generated on Monday Morning)
Direction: LONG
Confidence level: 42%(Limited direct trader commentary, but price is sitting near a well-defined support zone with slowing downside momentum and no strong selling pressure.)
Targets
Target 1: 1.12
Target 2: 1.16
Stop Levels
Stop 1: 1.02
Stop 2: 0.98
Key Insights:
Here’s what’s driving this setup. NEAR has sold off hard into the $1.00–$1.05 area, a zone that has acted as demand multiple times across recent market cycles. What I’m watching closely is that the selling momentum has slowed while price remains compressed near the lows. That combination usually tells me sellers are getting tired, even if buyers aren’t aggressive yet.
What’s interesting is the volume profile. Trading activity dropped sharply over the last 24 hours, which suggests this move down isn’t being aggressively chased. In situations like this, several traders prefer to lean toward a tactical long rather than pressing shorts into support. It’s not about conviction — it’s about risk-reward being skewed slightly upward from here.
Recent Performance:
NEAR is down roughly 5% over the last 24 hours, sliding from the $1.12 area toward $1.05 before stabilizing. Most major exchanges are now pricing it in a tight $1.03–$1.08 range. The sharp move lower already happened; since then, price action has gone quiet, which often precedes a short-term bounce rather than an immediate continuation lower.
Expert Analysis:
Several traders I track are effectively sidelined on NEAR, but that’s actually informative. When markets fall hard and expert commentary doesn’t turn aggressively bearish, it often means downside expectations are already priced in. From a technical perspective, price is stretched short-term and sitting close to a psychological $1.00 level, which tends to attract dip buyers even in weak environments.
I’m not seeing breakout talk — this is strictly a tactical play. The idea here is a controlled bounce toward nearby resistance, not a trend reversal. That’s why targets stay tight and stops are clearly defined.
News Impact:
There’s no fresh negative headline pressure hitting NEAR right now. The news flow is quiet, and in crypto, no news after a selloff is sometimes good news. Without new catalysts pushing price lower, the path of least resistance for the next few sessions can tilt slightly upward as selling pressure fades.
Trading Recommendation:
Putting it all together, I’m going with a cautious LONG on NEAR for this week only. The setup is based on price being parked near support, fading downside momentum, and a lack of aggressive selling interest. This is not a high-conviction trade, so position size should stay small and stops should be respected. I’m looking for a move toward $1.12 first, then potentially $1.16 if momentum builds. If $1.02 fails, I’m out — no hesitation.

Natural Gas under pressure as bearish momentum dominates this wCurrent Price: 3.215 (Analysis was generated on Monday Morning)
Direction: SHORT
Confidence level: 58%(Several professional traders repeatedly described bearish momentum, bear flag structures, and failure below the 200-day moving average, while only a minority expect upside after a dip. Signals are mixed but tilt bearish for this week.)
Targets
Target 1: 3.05
Target 2: 3.00
Stop Levels
Stop 1: 3.35
Stop 2: 3.59
Key Insights:
Here’s what’s driving this setup. Several professional traders repeatedly described Natural Gas as being in bearish momentum, highlighting patterns like a bear flag, sharp corrections, and failure to reclaim key moving averages. More than one analysis pointed out that price is struggling below the 200‑day moving average, with sellers defending rallies aggressively.
What’s interesting is that even traders who see longer‑term upside are calling for near‑term weakness first. Multiple traders mentioned a dip toward the $3.00 area as a likely move before any sustainable rebound. That tells me the short‑term path of least resistance is still lower, even if buyers eventually step in.
Recent Performance:
You can see this clearly in the recent price action. Natural Gas sold off heavily in prior weeks, with some traders citing drops of over 20% during the correction phase. While price has bounced modestly, it’s been choppy and unable to build strong upside momentum, suggesting this move looks more like a pause than a real reversal.
Expert Analysis:
Traders are taking notice of the technical picture. Several professional traders highlighted bearish continuation signals, noting that rallies are stalling near resistance zones rather than breaking higher. The $3.59 area, near the 200‑day moving average, came up more than once as a ceiling that price has not been able to reclaim.
At the same time, the $3.00 level showed up repeatedly as key support. That’s why I’m using it as the second downside target for this week. If price slides toward that zone, short‑term sellers are likely to take profits and buyers may finally show up.
News Impact:
On the news side, easing geopolitical pressure and high production levels are removing some of the upside urgency from Natural Gas. Inventory data and weather forecasts remain wildcards, but right now they’re not strong enough to flip the short‑term trader consensus. The lack of a fresh bullish catalyst keeps pressure on prices this week.
Trading Recommendation:
Putting it all together, here’s my take. I’m positioned SHORT on Natural Gas for this week, targeting a move toward $3.05 first and potentially $3.00 if selling accelerates. I’d respect risk tightly above $3.35, with a hard stop near $3.59 where multiple traders see major resistance. Confidence isn’t extreme because some traders expect a bounce later, but for the next 5–7 trading days, downside still looks like the higher‑probability path.

XLF at a Pivotal Break Zone: Financials Setting Up for a Push HCurrent Price: 54.26 (Analysis was generated on Monday Morning)
Direction: LONG
Confidence level: 58%(Professional traders repeatedly focus on a potential turn back above 55, price is holding above 53 support, and with mixed signals the setup favors upside with controlled risk.)
Targets
Target 1: 55.0
Target 2: 56.0
Stop Levels
Stop 1: 53.0
Stop 2: 52.5
Key Insights:
Here’s what’s driving this setup. Multiple traders are talking about XLF “turning” and trying to get back above 55. That level keeps coming up because it’s where prior upside stalled. When traders repeatedly anchor to the same price, it usually becomes the battlefield. What I’m seeing is price holding above the low‑$53 area while pressure builds under resistance.
Another important angle is sector context. Several traders tied XLF’s direction to stabilization in other risk areas like tech, crypto, and broader equity indices. The message isn’t wild optimism — it’s conditional strength. If markets stop slipping and simply base, financials are one of the first sectors traders expect to rotate into. That bias favors upside as long as support holds.
Recent Performance:
XLF has been chopping around the mid‑$54 zone after pulling back from the January highs near $56.50. Over the last few sessions, it’s held above $53 despite heavy volume, which tells me sellers aren’t in full control. The price action looks more like digestion than distribution, especially with buyers stepping in near the same support level repeatedly.
Expert Analysis:
Several professional traders highlighted that XLF is trying to reclaim the 55 handle. One group focused on signs of rotation rather than momentum chasing — a subtle but important distinction. Instead of calling for a runaway rally, they’re watching for a grind higher that confirms the turn.
At the same time, traders did flag overhead supply near resistance. That’s why I’m not stretching targets too far for this week. A clean push into 55 is the first test. Acceptance above that level opens the door to a quick extension toward 56, but failure there would likely send price back toward support.
News Impact:
The news flow around financials has been mixed but supportive enough to keep downside contained. Earnings reactions across large banks created short-term volatility, yet there’s no fresh shock hitting the sector. Rate expectations and macro data remain the swing factor, and any hint of stability there tends to help XLF rather than hurt it.
Trading Recommendation:
Putting it all together, I’m leaning LONG on XLF with a defined plan. Price is closer to support than resistance, and when the signals are balanced, I default to upside with tight risk control. I’d look for continuation toward $55 first, then $56 if momentum follows. Risk stays capped below $53, where the setup clearly breaks. This isn’t a home-run trade — it’s a structured, short-term play based on where traders are collectively focused right now.

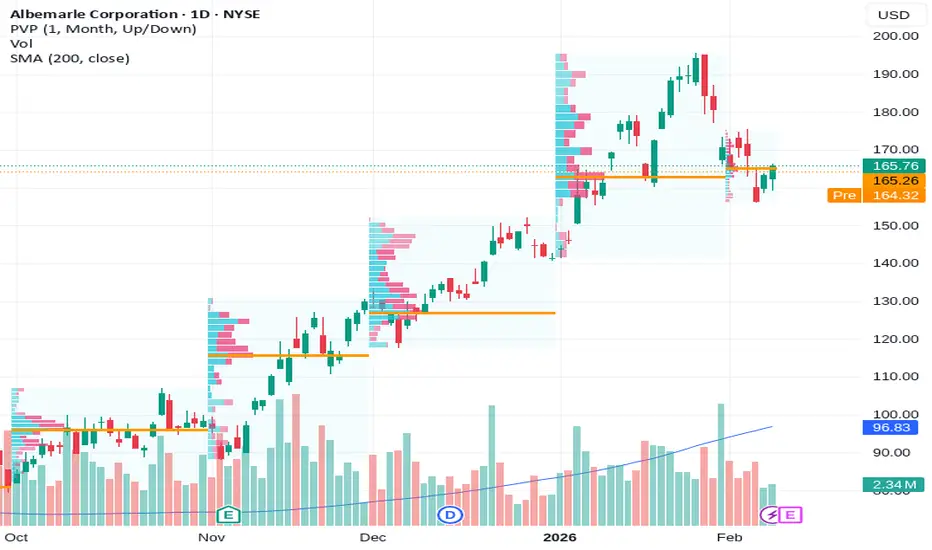
Albemarle breaks $163 as traders position for a push higher thiCurrent Price: 163.37 (Analysis was generated on Monday Morning)
Direction: LONG
Confidence level: 66%(Several professional traders point to buyable dips above $160 and upside toward the high $160s, while X sentiment supports continuation despite limited volume)
Targets
Target 1: 168.00
Target 2: 172.50
Stop Levels
Stop 1: 160.00
Stop 2: 158.00
Key Insights:
Here’s what’s driving this idea. Multiple traders are watching ALB hold above its 50‑day and 200‑day moving averages, both sitting well below the current price. That structure tells me buyers are still in control. What stands out is how often the $168–$170 zone comes up in trader discussions. It’s viewed as the next real test, and a clean push into that area could bring momentum traders back in quickly.
On the sentiment side, X is leaning positive despite low tweet volume. Traders there keep pointing to falling short interest and call‑heavy options positioning. That combination doesn’t guarantee upside, but it does reduce near‑term selling pressure, which supports a long bias for the next few sessions.
Recent Performance:
This all showed up in the tape. ALB has rebounded strongly over the past three months and is trading near $163 after a sharp daily move. Volume hasn’t exploded yet, but the stock is holding gains instead of fading, which suggests sellers aren’t very aggressive at these levels.
Expert Analysis:
Several professional traders I track highlighted RSI sitting in the low‑60s, a zone that often supports continuation rather than reversals. MACD is still below zero, but it’s tightening, which traders often see as an early improvement signal. The shared takeaway from the trading community is simple: stay constructive above $160 and reassess only if that level fails.
News Impact:
Recent analyst upgrades and ongoing discussion around U.S. strategic‑minerals policy are helping the bullish narrative. Traders are also positioning ahead of the upcoming earnings report, with implied volatility elevated. That sets the stage for a bigger move, even within this week.
Trading Recommendation:
Putting it all together, I’m LONG Albemarle for this week. I’m targeting a move toward $168 first, with $172.50 as the stretch goal if momentum builds. Risk is clearly defined with a stop at $160 and a wider protection level at $158. Confidence isn’t extreme, so position sizing matters here, but the balance of trader insight and sentiment favors upside over the next 5–7 trading days.
RSP Equal-Weight Strength Signals Another Push Higher This WeekCurrent Price: 202.26 (Analysis was generated on Monday Morning)
Direction: LONG
Confidence level: 62%(Several professional traders emphasize strong market breadth and recent record highs in RSP, while social sentiment is mixed, leading to moderate confidence.)
Targets
Target 1: 205.0
Target 2: 208.0
Stop Levels
Stop 1: 198.5
Stop 2: 195.0
Key Insights:
Here’s what’s driving this setup. Multiple professional traders are highlighting RSP as a key signal for healthy market structure. Equal-weight exposure means smaller and mid-sized names actually matter, and traders are seeing leadership expand beyond the usual mega-cap names. That’s typically constructive for follow-through moves rather than blow-off tops.
What really caught my attention is that several traders explicitly pointed out RSP pushing into record-high territory recently. Even with some short-term hesitation, the broader takeaway from trader discussions is that dips are getting bought, not sold. That’s not how markets behave when real distribution is underway.
Recent Performance:
You can see this in the price action. RSP has climbed steadily from the mid-$190s into the low $200s, with higher lows along the way. Even on softer sessions, pullbacks have been shallow. That tells me sellers aren’t pressing hard, which lines up well with the breadth narrative traders keep emphasizing.
Expert Analysis:
Looking at trader consensus, the equal-weight versus cap-weighted comparison keeps coming up. Several traders noted RSP outperforming SPY during recent rotation phases, which suggests capital isn’t leaving equities—it’s just spreading out. That’s usually when equal-weight ETFs shine.
On the technical side, traders are watching the $200–$202 zone as the near-term pivot. Holding above that area opens the door for a quick extension higher this week, especially if mid-caps and industrials continue to participate.
News Impact:
There’s no single headline driving this move, and that’s actually a positive. The lack of negative macro shocks combined with ongoing rotation themes keeps the backdrop supportive. Web and market data continue to show stable inflows and solid volume, which reinforces the idea that this isn’t a fragile rally.
Trading Recommendation:
Here’s my take. I’m staying LONG on RSP for this week, looking for a continuation toward $205 and potentially $208 if momentum builds. I’d manage risk tightly below $198.50, with a hard line at $195 if the breadth story suddenly breaks down. Confidence isn’t sky-high because social sentiment is mixed, but the professional trader narrative around market breadth is strong enough for me to lean bullish.

MSTR ¡Warning! Possible LOW Today Tuesday 10thFollow me here on TW for my regular critical updates on crypto (BTC, ETH, SOL, MSTR) and metals (GLD, SL, PL) based on Martin Armstrong's Socrates.
Look in my TW Ideas for posts of each market individually.
MSTR has a target today/tomorrow with an opposite direction into Monday. If today/tomorrow produces a LOW there's a possibility of a nice rally into Monday. The Daily Stochastic is gaining upward energy.
¡Good luck! 🙏🏻

The Elephant Jungle 2/10/26 Page 6The Jungle is quiet right now. Is this what they mean by the calm before the storm?
Is New York going to bring the energy and wake the Jungle up today? Will there be news that sends the market into chaos, or are we just going to keep flopping around inside this current range?
Either way, it will not take long to find out.
Like always, stay safe out there in the Jungle. Use proper risk management, wait for your levels, wait for confirmation, and do not force trades that are not there.
In the Jungle, survival comes before profit.

The Elephant Jungle 2/10/26 Page 5On the 1H timeframe, we just put in a SFP(swing failure pattern), of the 1H high. That makes the 1H low technically weak, which means price should be working its way back down toward that low. The problem is, we have been stuck in this Current Range since Friday.
So far, we have 2 taps at the high of the range and 1 tap at the low. There is the possibility that we put in a 3rd tap and made a Wyckoff Model 2 Distribution already. Visually, it looks like a head and shoulders pattern. But the way this is playing out feels slow. Too slow.
Because of that, I am leaning more toward a Wyckoff Model 1 Distribution possibly playing out, where we sweep the highs one more time and then drop. That idea also lines up with what I would personally like to see, which is a push into the 4H Supply Range followed by a backtest of the Macro Range Low.
But maybe this is not that deep.
Maybe this is just the Bears slow grinding price back down to the range low. Or maybe the Bulls are letting the Bears push it down a bit so they can catch a bounce off the 1H Internal Demand Range or the 15m Order Block and then push price up into the 4H Supply Range, maybe even a little higher.
Honestly, that would not be a bad idea either, especially since the back end of that 1H Internal Demand Range lines up perfectly with the 618 Golden Pocket.
Who knows.
All I know for sure is that price action in the Jungle is real crappy right now, and New York better come with it.

Big economic data this morning, big volatility I'm looking for jpy strength and everything else whipsaw-y


MNQ Tuesday Pre-Market: Buy Side in Sight, but HTF SSL Left📊 MNQ H2026 — Tuesday, February 10 Pre-Market Analysis
Price is currently trading around 25,390, grinding higher through the overnight session from the 24,955 Monday low. The structure is showing bullish intent, but there are two key scenarios to watch today. Must wait for market to show if it will either sweep the BSL and continue lower or we continue to reach the FVG Unfilled, BSL will show use, Watch Monday Low
🎯 Bullish Scenario — Buy Side Liquidity Sweep
The primary draw on liquidity (DOL) sits above at the buy-side level near 26,100. If price continues this displacement higher, we're looking for:
• Buy-side liquidity above previous highs to get taken
• FVG unfilled at 26,050 to be the target
• Clean move into premium pricing above the DOL
📉 Bearish Scenario — HTF SSL Target
We left behind higher timeframe sell-side liquidity (SSL) below. If price fails to reach the buy-side target and breaks down from current levels:
• Expect a retracement to sweep the HTF SSL
• The unfilled FVG becomes resistance if we lose it
• Lower timeframe market structure shift would confirm the move down
🔑 Key Levels
• Buy Side Target: ~26,050 (DOL)
• FVG (Unfilled): ~26,050
• HTF SSL (Below): ~24,150
⚡ Bias: Bullish above FVG, but cautious — the SSL below is unfinished business. If we can't reach buy-side and structure breaks, that's where we're heading.
Trade smart. Let the market show its hand first.
— DropKing | ICT Smart Entry

Execution waits for clarity.Market's choppy across the board. No clean direction on my pairs.
Gold bouncing between levels with no commitment. EUR/USD same story. USD/CHF unclear.
Could be liquidity hunt before the actual move. Or just consolidation. Either way, I'm not guessing.
When there's no structure, I don't trade. Waiting for clarity to return.
Days like this are about protecting capital, not forcing opportunities. The setups will come back when the market decides to move with direction.
Sitting out and watching.

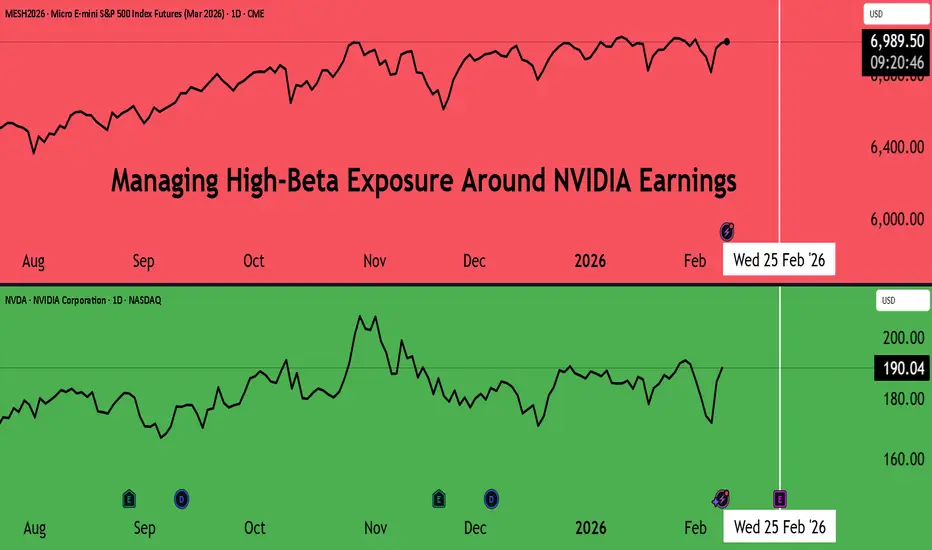
Managing High-Beta Exposure Around NVIDIA EarningsVANTAGE:NVIDIA will report its next quarterly earnings in roughly two weeks, while general expectations around AI infrastructure spending, data-centre utilisation, and margin sustainability remain elevated.
While the long-term AI narrative continues to underpin the stock for NVIDIA, earnings events become even more sensitive given broader apprehensions about the ecosystem.
Strong Fundamentals, Elevated Sensitivity
NVIDIA remains central to the AI compute stack, with its GPUs embedded across hyperscaler data centres, enterprise AI workloads, and increasingly inference-heavy applications.
Source: TradingView
Revenue growth over recent years has been exceptional, supported not just by volume expansion but by sustained pricing power and operating leverage.
Consequently, this success has amplified the stock’s sensitivity to expectations. NVIDIA’s rolling beta to the broader market remains elevated, reflecting both its growth profile and its role as a proxy for AI capital expenditure more broadly. Earnings reactions, therefore, tend to be sharper than those of the broader indices, particularly when positioning and implied volatility are already high into the event.
History shows that even in periods of consistent earnings beats, price reactions around results are not symmetric: upside is often more measured, while downside can be abrupt if guidance, margins, or order visibility disappoint.
Why Index-Based Hedging Matters Around Earnings
Single-stock options are the most direct way to hedge earnings risk, but they also tend to be the most expensive around results. Implied volatility typically peaks into the event, raising the cost of protection precisely when it is most needed.
An alternative approach is beta hedging, using a broader index instrument to offset the portion of NVIDIA’s risk that is driven by market-wide and factor-based moves rather than idiosyncratic fundamentals.
For NVIDIA, a significant share of short-term drawdowns during earnings could coincide with broader risk-off, even when the company’s long-term outlook remained intact. This makes index hedging a useful, cost-efficient tool when deployed thoughtfully.
Source: FactSet
The S&P 500 also enters the upcoming earnings window with expectations already elevated. According to FactSet , analysts are projecting full-year 2026 earnings growth of 14%, with quarterly growth accelerating from 11.3% in Q1 to over 15% by Q3–Q4.
Compounding this sensitivity is a stretched valuation profile: the S&P 500’s forward 12-month P/E stands at 21.5x, above its 5-year (20.0x) and 10-year (18.8x) averages. This combination of strong growth expectations paired with elevated multiples could increase index sensitivity to earnings disappointments from large contributors.
NVIDIA, though, stands out as the single largest contributor to earnings and revenue growth among S&P 500 companies with significant international exposure. FactSet notes that, excluding NVIDIA, earnings growth for internationally exposed firms would fall materially, underscoring how concentrated index-level growth has become.
And although NVIDIA remains a dominant contributor to recent index returns, historical earnings reactions suggest that post-earnings volatility in the stock has increasingly resulted in rotation rather than broad market drawdowns.
In several recent quarters, periods of NVIDIA post-earnings weakness were followed by relative resilience or even outperformance in the S&P 500, as leadership broadened beyond a narrow set of growth names.
Source: CME QuikStrike
From a positioning standpoint, there is a significant build-up of put options for the MES options, with the contract expiring a couple of days after NVIDIA’s earnings. Call interest at 7,250 is high, but is still outweighed by puts, especially around the 6,500 strike level.
Source: CME QuikStrike
Over the past session, though a considerable number of puts were closed, with added OI much more favourable for OTM calls around 7,100, as well as in the money calls around the 6,750 strike.
Under normal market conditions, using MES as a hedge to reduce beta exposure around earnings is a compelling strategy. However, with the most recent changes in options OI for MES futures, the positioning resembles the trends observed in recent historical data regarding the spread between the index and NVIDIA.
Using CME Micro E-mini S&P 500 Options as a Hedge
CME Micro E-mini S&P 500 (MES) options offer a flexible and capital-efficient way to hedge NVIDIA earnings risk: each Micro contract represents one-tenth the size of a standard E-mini, allowing for precise sizing, and liquidity is deep across short-dated expiries.
During Q2 2024, NVIDIA shares declined over 6% in the month following earnings, while the S&P 500 rose almost 2%.
A portfolio combining NVIDIA exposure with a modest MES futures position would have experienced significantly lower volatility than a standalone NVIDIA position, highlighting how index exposure can act as a volatility absorber during single-stock earnings events.
Historical illustration
● Instrument: Micro E-mini S&P 500 Futures
● Index performance: +1.43% over 28 days (and 4.80% over 84 days)
● Entry Level: 5,760
● Exit Level: 5,843 (28 days) and 6,054 (84 days)
● Net index move: 83 index points (28 days) and 296 index points (84 days)
P&L for the MES Futures position: 83 index points × USD 5 per index point = USD 415 per MES contract.
The USD 415 would have offset the losses on the NVIDIA position, while holding it for 84 days would have added USD 1,480 to the gains from NVIDIA’s 9.55% rally over the same period.
For larger portfolios or institutions seeking greater notional exposure, E-mini S&P 500 (ES) futures can be used in place of MES futures, offering the same index exposure with a larger contract multiplier.
This content is sponsored.
MARKET DATA
CME Real-time Market Data helps identify trading setups and more effectively express market views. If you have futures in your trading portfolio, you can check out on CME Group data plans available that suit your trading needs at tradingview.com/cme .
DISCLAIMER
This case study is for educational purposes only and does not constitute investment recommendations or advice. Nor are they used to promote any specific products, or services.
Trading or investment ideas cited here are for illustration only, as an integral part of a case study to demonstrate the fundamental concepts in risk management or trading under the market scenarios being discussed. Please read the FULL DISCLAIMER, the link to which is provided in our profile description.