BTCUSD TRADING LEVELS BTCUSD TRADING LEVELS by TrAdiNgSoLiDLeVeLs. Anyone can trade on both sides with a strict stoploss.
Thank You for your support.
Beyond Technical Analysis

Ethereum (ETHUSDT): Approaching a Major Turning PointHI!
Trend Structure
Since mid-October 2025, ETH has been trending inside a well-defined descending channel, forming consistent lower highs and lower lows. The break of the previous bullish trendline back in July 2025 confirmed the shift into a corrective phase.
Key Support Zone (S&D)
Price is now around $2,730 (Nov 2025) and heading toward the crucial $2,450–$2,300 S&D zone, a strong support area that held the market firmly between May and July 2025.
Expected Price Behavior
A final liquidity sweep toward $2,300–$2,200 is possible before any sustainable upside move. This aligns with the lower boundary of the descending channel.
Deeper Support (DP)
If this level fails, the next major demand sits at $1,950–$1,800, last touched in March 2025.

ETH Weekly Outlook: Critical Support – What Happens Next?📌 Scenario 1 — Bullish Rejection From Support → Break of Liquidity Zone
Price continues to pull back into the 2,500–2,650 support zone, which also aligns with previous structure and mitigation levels.
If buyers defend this area strongly:
Price forms a higher low inside the support zone.
Bullish momentum pushes ETH back above the broken trendline.
ETH targets the liquidity zone around 4,500–4,600.
A breakout and close above this level could lead to a strong continuation rally, sweeping previous highs.
Bias: Bullish continuation after correction.
📌 Scenario 2 — Deeper Sweep Into Major Support → Strong Reversal
If current support fails to hold:
ETH may dip deeper into the major support + imbalance zone (around 2,250–2,400).
This area contains a liquidity pool, meaning price may intentionally sweep it before reversing.
After the liquidity grab, a sharp bullish reaction is expected.
Price climbs back toward 3,000–3,200, retests structure, and then targets the 4,500–4,600 liquidity zone again.
Bias: Liquidity grab → Market structure shift → Strong bullish recovery.

Tesla next months Unfortunate that market has pulled back over the last few weeks, otherwise this would have happened earlier. Pretty sure we see 500+ within the next 3 months or so.
I hope you enjoy the kid pencil.

Liquidity Hunt: How Whales Move the MarketEver wonder why prices always seem to drop just below your stop loss before bouncing back? It’s not bad luck; it’s liquidity in action. The big players are prowling, hunting for stops, and if you don't understand where they’re lurking, you might just be their next target. Liquidity definition refers to how easily an asset can be bought or sold without significantly affecting its price, and in the world of crypto, this dynamic can make or break your trade. Let’s dig into how these whales work the market and how you can avoid becoming their prey.
What is Liquidity?
Liquidity meaning refers to how easily an asset can be bought or sold without affecting its price. In the context of crypto, it's crucial to know that high liquidity means less slippage, while low liquidity can lead to sharp price moves. Market liquidity is essential for smooth trading, but it also creates opportunities for big players to manipulate price action by targeting stop losses.
Liquidity Risk and Big Players
Liquidity risk arises when there's not enough liquidity to execute trades efficiently, especially during volatile periods. Big players exploit these conditions by pushing prices through key support and resistance levels, triggering stop orders and capturing liquidity. This is why it’s vital to be aware of where liquidity is concentrated — big players often target areas with many stop losses, trapping retail traders in the process.
Tools to Analyze Liquidity
Volume Indicators: Use tools like Accumulation/Distribution or On-Balance Volume (OBV) to spot surges in volume that may indicate manipulation or big players entering the market.
Bitcoin Liquidity Heatmap: A Bitcoin liquidity heatmap shows where large buy and sell orders are placed, helping you avoid areas where liquidity is likely to be targeted by whales.
Liquidity Ratio Formula: Another great tool which helps measure market depth and liquidity. You can calculate it as:
A higher ratio indicates that there is more buying pressure, suggesting the market is more liquid and less prone to manipulation. On the other hand, a lower ratio signals more sell orders, which could expose you to increased liquidity risk and higher chances of price manipulation by big players.
Price Action: Watch for candlestick patterns like pin bars or engulfing candles near key support or resistance levels to anticipate price reversals after stop hunts.
Conclusion
While tools like volume indicators and Bitcoin liquidity heatmaps can help, always stay vigilant. Use wider stop losses to avoid getting trapped at key levels, and stay cautious during periods of low liquidity when whales are most active. This article isn’t trading advice — always DYOR and trade responsibly.

GOLD ForecastGold is trading under a descending trendline, facing strong resistance around the 4076–4077 zone, while buyers are holding support at 4040. A break above resistance may open the way toward 4090+, but failure to break could drag price back to the 4020–4012 support zone.
"Thank you for your support! If you found this idea valuable or learned something new, please consider liking and leaving a comment. I’d really appreciate hearing your feedback and thoughts."

GBPCHF higher bullish from here expected
OANDA:GBPCHF trend based analysis, in last periods we are have strong bearish trend. First time i am expect changes in period 31.10 - 7.11,
but price is make one more bearish.
In this week we having bullish trend and from here expecting and higher bullish.
SUP zone: 1.05300
RES zone: 1.07000, 1.07550

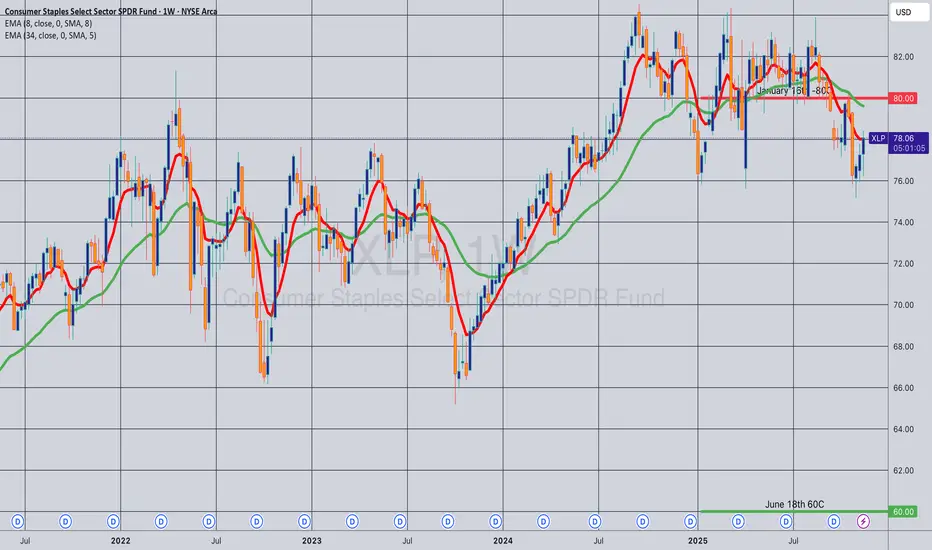
Opening (IRA): XLP June 18th 60C/January -80C LCD*... for a 17.88 debit.
Comments: Re-upping here, buying the June 90 delta call and selling the January call that pays for all of the extrinsic in the long.
Metrics:
Buying Power Effect: 17.88
Max Profit: Short Call Strike (80) minus Long Call Strike (60) minus debit paid (17.88) or 2.12 ($212)
ROC at Max: 11.86%
50% Max: 1.06 ($106)
ROC at 50% Max: 5.93%
Will generally look to take profit at 50% max.
* -- Long Call Diagonal.
Gold Bull Pennant #3 Forming?Gold has been in a massive rally for 21 months now, sparking in February of 2024 after Austan Goolsbee seemingly dismissed continued high CPI prints, instead focusing on the rate cuts the Fed had started to forecast a year earlier. That's led to a historic run in gold prices and along the way, there's been a clean technical backdrop of higher-highs and higher-lows as a clear bullish bias continued to drive.
There have been two notable periods, however, where that rally took pause, and it seems like we're now in a third.
In the final two months of last year, right around the US Presidential Election, gold formed a symmetrical triangle. This, of course, was after the Fed started to cut rates but there was also a push-higher on inflation expectations, which drove Treasury yields up. Also notable is the fact that Bitcoin came to life in a very big way at the time, spurred along by the election of President Trump and his crypto-friendly campaign. This is when Bitcoin ran up to and beyond 100k for the first time.
That consolidation took two months, and bulls broke out in early-2025 trade as that symmetrical triangle took on the tone of a bull pennant.
The rally then pushed through the first three-and-a-half months of the New Year, with another high setting around Easter at the $3500/oz level.
Again, a symmetrical triangle developed as longs used bounces to take profits and buyers used the pullbacks to add exposure. Normally - a symmetrical triangle carries little to no directional bias, as it's essentially just lower-highs and higher-lows, illustrating consolidation. But when meshed with a prior trend of such strength, a bias can be borrowed; and given that greater profit taking didn't show and, instead, fresh buyers are coming in to bid dips at higher-lows, there's a bullish connotation to the otherwise directionless consolidation.
That second triangle took four months to build - and it finally broke out when Jerome Powell signaled his willingness to cut rates at the Jackson Hole Economic Symposium. After which, once again, gold went parabolic.
Now we have a third period of consolidation and similarly, this aligns with the Fed acting a bit more prudent, refusing to commit to a December rate cut. There's also the opacity around data as the government shutdown in the US has restricted the flow of inflation data that will be key for the Fed's decision making.
At this point, there's little reason to suggest that the big picture bullish trend is over, but one has to imagine that positioning remains heavy to the long side. So, pullbacks or tests of support can remain attractive, but caution must be exercised after rallies as longer-term bulls still holding positions may use those bounces to reduce exposure.
For now, $4k is the major line in the sand. If we get another breach below that, there could be excuse for longer-term bulls to take profits and that can lead to a deeper pullback.
But, for now, it appears as though we have a third bull pennant forming and this one is only about a month old compared to the two months of late 2024 and the four months from the middle of this year. - js

Gold Consolidation remains bearish momentumGold is trading inside a descending structure, showing continued bearish pressure Price is repeatedly rejecting the mid-trendline, signalling weak bullish momentum a break below 4,040 may trigger a drop market bias remains bearish unless price breaks above the upper trendline.
Gold prices are on track for a weekly loss of around 1.5% following a mixed U.S. jobs report and ongoing uncertainty surrounding Federal Reserve policy. In New York, gold futures fell 0.5% to 4,041 per troy ounce, while spot prices reacted to stronger-than-expected U.S. job growth for September.
Technical Outlook:
The market is currently moving within a narrow trading range. a breakout above the 4,060 level could trigger bullish momentum, allowing prices to test the 4,065 to 4,075 zone However, failure to break above resistance may lead to consolidation. A bearish continuation below support could push gold toward the 4,005 to 3,970 major support area.
You may find more details in the chart,
Trade wisely best of luck buddies.
Ps; Support with like and comments for batter analysis Thanks for Supporting,

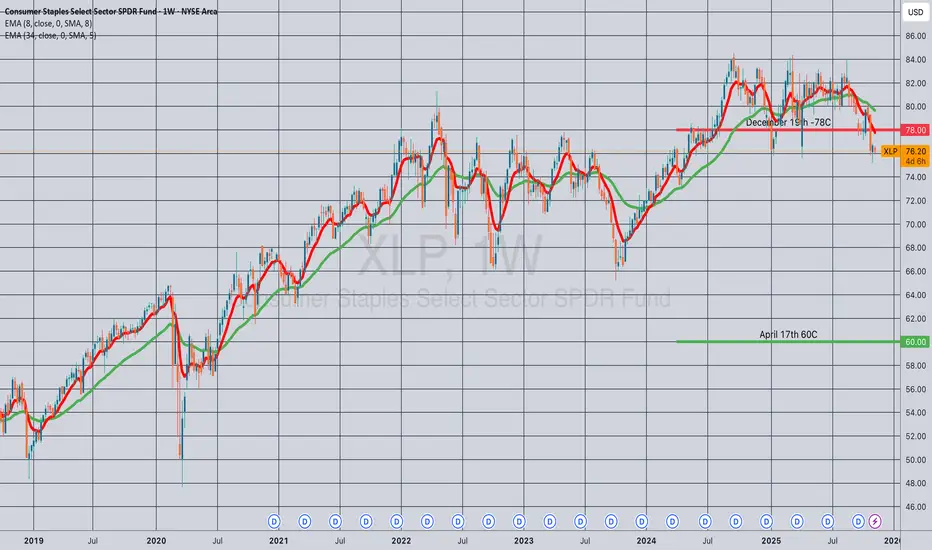
Opening (IRA): XLP April 17th 60C/December 19th -78C LCD*... for a 15.83 debit.
Comments: At or near 52-week lows. Buying the back month 90 delta call and selling the front month out-of-the-money call that pays for all of the extrinsic in the long.
Metrics:
Max Profit: 2.17 ($217)
Buying Power Effect: 15.83
ROC at Max: 13.71%
Break Even: 78.83/share
Will generally look to work the setup like a covered call, rolling the short call to reduce my cost basis in the setup.
* -- Long Call Diagonal.
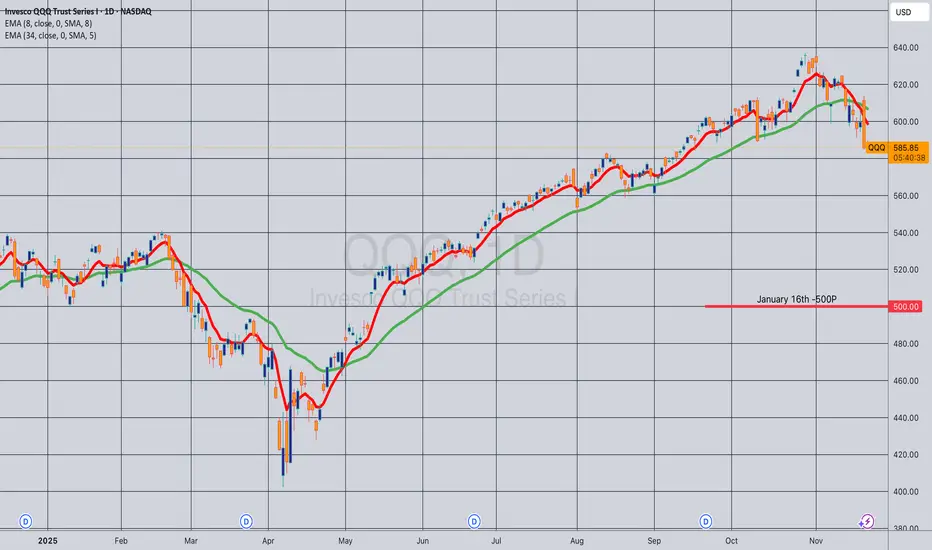
Opening (IRA): QQQ January 16th -500P... for a 5.22 credit.
Comments: My SPY position is becoming somewhat of a spaghetti works, so opting to open a run in the Q's instead, targeting the strike paying around 1% of the strike price in credit.
Will look to add/ladder out at intervals, assuming I can get in at strikes better than what I currently have on.
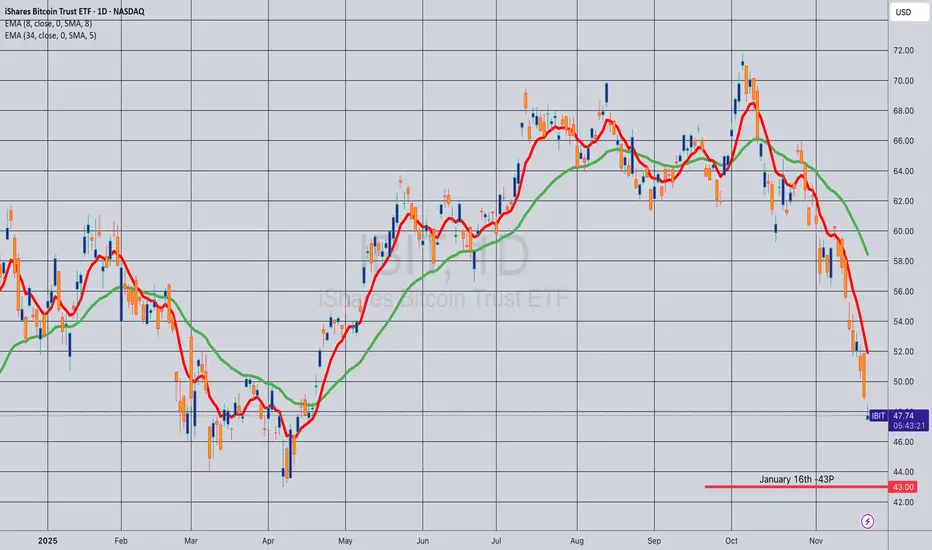
Opening (IRA): IBIT January 16th -43P... for a 2.07 credit.
Comments: Adding at intervals at strikes better than what I currently have on, targeting the 25 delta strike.
Metrics:
Buying Power Effect: 40.93
Max Profit: 2.07 ($207)
ROC at Max: 5.06%
Opening (IRA): ETHA January 16th -18P... for a 1.39 credit.
Comments: Adding at intervals at strikes better than what I currently have on, targeting the 25 delta strike.
Metrics:
Buying Power Effect: 16.61
Max Profit: 1.39 ($139)
ROC at Max: 8.37%

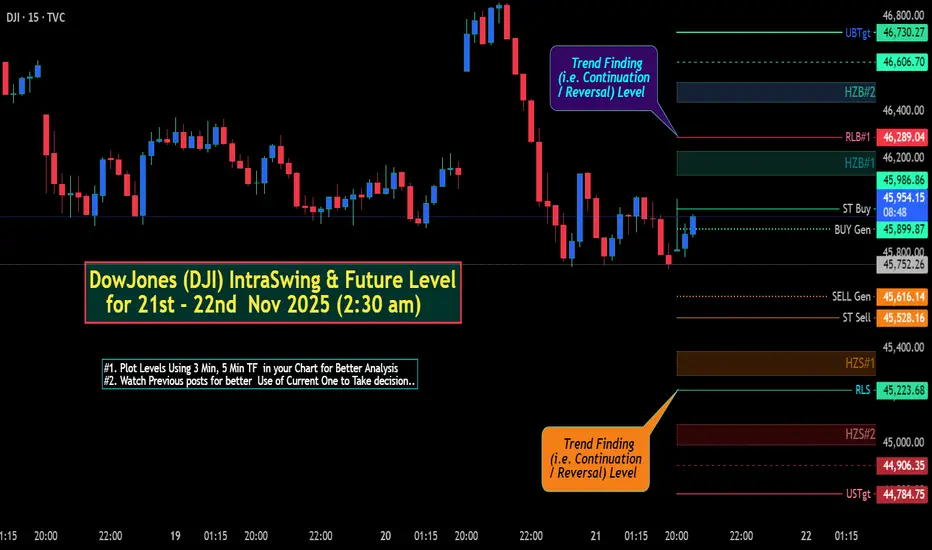
DowJones (DJI) IntraSwing & Future Levels for 21st-22nd Nov'25DowJones (DJI) IntraSwing & Future Level for 21st - 22nd Nov 2025 (2:30 am)
Useful to Tally / Recognize for Next day Trade Plan.
[ Level Interpretation / description:
L#1: If the candle crossed & stays above the “Buy Gen”, it is treated / considered as Bullish bias.
L#2: Possibility / Probability of REVERSAL near RLB#1 & UBTgt
L#3: If the candle stays above “Sell Gen” but below “Buy Gen”, it is treated / considered as Sidewise. Aggressive Traders can take Long position near “Sell Gen” either retesting or crossed from Below & vice-versa i.e. can take Short position near “Buy Gen” either retesting or crossed downward from Above.
L#4: If the candle crossed & stays below the “Sell Gen”, it is treated / considered a Bearish bias.
L#5: Possibility / Probability of REVERSAL near RLS#1 & USTgt
HZB (Buy side) & HZS (Sell side) => Hurdle Zone,
*** Specialty of “HZB#1, HZB#2 HZS#1 & HZS#2” is Sidewise (behaviour in Nature)
Rest Plotted and Mentioned on Chart
Color code Used:
Green =. Positive bias.
Red =. Negative bias.
RED in Between Green means Trend Finder / Momentum Change
/ CYCLE Change and Vice Versa.
Notice One thing: HOW LEVELS are Working.
Use any Momentum Indicator / Oscillator or as you "USED to" to Take entry.
⚠️ DISCLAIMER:
The information, views, and ideas shared here are purely for educational and informational purposes only. They are not intended as investment advice or a recommendation to buy, sell, or hold any financial instruments. I am not a SEBI-registered financial adviser.
Trading and investing in the stock market involves risk, and you should do your own research and analysis. You are solely responsible for any decisions made based on this research.
"As HARD EARNED MONEY IS YOUR's, So DECISION SHOULD HAVE TO BE YOUR's".
Do comment if Helpful .
In depth Analysis will be added later (If time Permits)
What's Happening or The Shadow of a Quantum Apocalypse💥 Birth of a Threat
Quantum Dawn and Shor's Algorithm
Quantum computers using the principles of superposition and entanglement are no longer science fiction. Major players like IBM and Google are actively working on creating machines capable of solving problems beyond the capabilities of classical supercomputers.
The main threat to the digital world, including the entire cryptocurrency industry, lies in Shor's algorithm.
Shor's Algorithm (1994)
Mathematician Peter Shor proved that a quantum computer can efficiently (in polynomial time) factorize large numbers and solve the discrete logarithm problem.
Vulnerability: The RSA and ECDSA cryptographic systems that underpin the public/private key security of most blockchains (including Bitcoin and Ethereum) will become useless. A public key revealed during the first transaction would allow a quantum computer to compute the private key almost instantly.
When Will "Q-Day" Happen?
Timelines for the emergence of a quantum computer capable of breaking widely used cryptographic schemes vary, but the trend points to an acceleration. This point has been dubbed "Q-Day" (the quantum equivalent of Y2K).
Probability Estimates:
A Global Risk Institute survey (2025) estimates a 22.7% chance of breaking RSA-2048 by 2030 and a 50% chance by 2035.
Expert Opinions:
Vitalik Buterin (November 2025) estimated the chance of Ethereum being hacked at 20% by 2028. The Cloud Security Alliance associates "Y2Q" with the date April 14, 2030. IBM plans to release the Nighthawk chip with over 2,000 logical qubits by 2029.
"Harvest Now, Decrypt Later" Strategy:
Recognizing the inevitability, intelligence agencies and attackers are already collecting encrypted traffic (including transactions) for subsequent hacking when quantum machines become available.
Cryptocurrency: The Perfect Victim and the Price of Inaction
Cryptocurrencies are an ideal target because many addresses contain funds associated with already compromised public keys.
Vulnerable Assets:
An estimated 25-30% of all Bitcoin (4-6.65 million coins), including Satoshi Nakamoto's funds, are held in vulnerable P2PK addresses.
Consequences:
Collapse of trust and asset losses exceeding $2.4 trillion (estimated for 2025) if timely migration is not implemented.
🛡️ Survivors: Cryptocurrencies that have adopted PQC
Blockchain's survival in the era of quantum computers depends on one key condition: abandoning vulnerable cryptographic primitives (RSA and ECDSA) and transitioning to post-quantum cryptography (PQC). PQC solutions (based on lattices, hash functions, or Winternitz OTS) are resistant to Shor's algorithm. The market for quantum-resistant (QR) cryptocurrencies is growing, offering ready-made solutions for hedging risks.
Leaders of the QR Resistance and Their Technologies:
Not all blockchains will give in. Since the 2010s, pioneers have been building "quantum-resistant" coins using lattice-based, hash-based, or Winternitz OTS schemes—they ignore Shor like a rock ignores waves. The QR crypto market is growing at 28.6% annually until 2034. Top 9 as of November 2025:
Zcash (ZEC): shielded pool on BLS12-381 + Groth16—fully quantum-resistant as early as 2022; NU7 (October 2025) added PQ signatures even for t-addresses. A ready-made "quantum safe" without migration.
Quantum Resistant Ledger (QRL): Fully XMSS/SPHINCS+ since 2018. PoS migration in Q1 2025; +33% growth in June. Ideal for a "Y2Q" hedge.
IOTA: Lattice + hash chain without ECDSA. IoT focus; resistant to NISQ computers.
Nervos Network: CKByte with PoW + QR scaling for dApps.
Algorand (ALGO): Falco/Dilithium in signatures; fast migration.
Hedera (HBAR): SPHINCS+ hash-based; enterprise focus.
Starknet: Poseidon hash (QR primitives); v0.14.0 in September 2025.
Ripple (XRP): Dilithium in 2025; for cross-border payments.
Cardano: Q-Index group; PQ wallets 2025–2026.
Internet Computer (ICP): ZK + lattice since 2021; Groth/Cerulli plans.
Major Networks in the Adaptation Process
Industry giants are forced to invest in PQC solutions:
Bitcoin (BTC): The community is developing BIP-360 (P2QRH), which proposes the implementation of hybrid signatures (a soft fork combining ECDSA and ML-DSA) to ensure gradual but mandatory migration.
Ethereum (ETH): The project is investing heavily in R&D ($32.6 million), testing Dilithium and STARKs through initiatives like EIP-7932.
Assets in Urgent Need of Migration:
Monero (XMR): Despite the high level of anonymity provided by Ring Signatures and Ring Confidential Transactions (RingCT), Monero uses ECDSA for its underlying transaction digital signatures. This makes it vulnerable to Shor's algorithm. A successful PQC migration will require a comprehensive upgrade to integrate post-quantum signatures without breaking existing cryptographic privacy primitives.
Dash (DASH): Like most altcoins, Dash uses ECDSA for transaction signing. While its InstantSend and PrivateSend features improve speed and coin mixing (CoinJoin), they do not provide quantum resistance. Dash will also face the need for a forced soft fork to implement hybrid PQC signatures to protect users' assets from future attacks.
Therefore, survival is guaranteed for those projects that are either initially built on a PQC foundation or successfully migrate, replacing ECDSA with NIST-standardized PQC algorithms.
Zcash: A Ready Bridge for Migration Today
Zcash is one of the migration leaders. Its shielded pool (z-addresses), implemented after the NU5 (2022) and Halo 2 updates, is already quantum-resistant (thanks to the BLS12-381 curve). This allows it to be used as a "quantum safe" to protect assets transferred across bridges.
🔄 Migration: Technological Inevitability and the Cost of Transition
The transition to post-quantum cryptography (PQC) is critical for the survival of blockchains. This task has become a priority not only for the crypto community but also for institutional players such as BlackRock, which manages large Bitcoin ETFs.
Standardization and Protocols
A central element of the migration is the standardization of PQC algorithms:
NIST Standards: The US National Institute of Standards and Technology (NIST) finalized key PQC algorithms (FIPS 203–205) in 2025. These include Kyber (for key exchange), Dilithium, and SPHINCS+ (for digital signatures).
Bitcoin (BIP-360): A soft fork of BIP-360 (Pay to Quantum Resistant Hash, P2QRH) is proposed to implement hybrid signatures (ECDSA + PQC, e.g., ML-DSA). This scheme ensures backward compatibility during the transition period.
Bitcoin Migration Phases (Lopp, 2025): The transition will be gradual and mandatory:
Phase A: Banning spending from the most vulnerable P2PKH/SH addresses; reserving block space for "rescue" transactions.
Phase B (2 years): Completely blocking spending via legacy ECDSA signatures. Assets in unmigrated addresses will be "burned" (QRAMP).
Phase C: BIP-39 Proof-of-Possession for final activation.
Process and Timing
Activation of such changes (e.g., via UASF/BIP9, like SegWit) is expected in 2025-2026. Ethereum is following a similar path with the EIP-7932/Dilithium testnets. Zcash, as mentioned, has already partially completed the migration.
However, the key challenge lies in manual migration:
Manual Work: Only wallets and exchanges can automate the process. Regular users will have to manually transfer their coins to new P2QRH addresses (e.g., bc1r...) or QR-resistant pools (e.g., Zcash z-addresses).
Grace Period: The expected grace period for transfers is 3-5 years (until 2026-2030). After this period, funds remaining in old addresses will become vulnerable or be locked.
Losses and the Cost of Inaction
The cost of inaction will be inevitable financial losses:
Loss Percentage: Deloitte estimates that 20-35% of the total Bitcoin supply (5-7 million coins, including Satoshi's holdings and long-lost coins) is held by addresses that will not be able to migrate or will not have time to do so.
Complete Crash: Low-liquidity or low-activity blockchains that fail to achieve consensus for migration may be completely wiped or frozen.
Migration is a complex technological soft fork that requires coordinated action from developers, exchanges, and users. Success guarantees the preservation of assets, while failure leads to their irreversible loss.
USDT and USDC: Stablecoins at the Forefront
Stablecoins are also vulnerable because they use ECDSA chains (Tron/Ethereum). Tether (USDT), with a market cap of $155 billion (2025), is actively migrating to Dilithium. However, USDC (Circle), which is regulated and actively adopting PQC standards (e.g., Algorand and Hedera), is positioned as a more stable leader in the post-quantum world.
🚀 The Endgame: A Hybrid Post-Quantum World
By 2030, Q-Day will likely strike, but by then the market will already be hybrid. Bitcoin will survive, but with losses; Zcash, QR, IOTA, and other QR-based cryptocurrencies will become beacons of security. The financial sector will rely on quantum-resistant stablecoins (USDC, XRP stablecoins). The success of migration will depend on user vigilance: if you don't migrate, you lose.

Native x402 Infra KITE listed on Coinbase Nov 3. It's shown relative strength since then and has developed its initial base w/ higher lows. It's an infrastructure play on x402 protocol as it's the only blockchain to have x402 running natively. If AI agents transacting is the near future, then KITE will be a huge beneficiary.
Backed by Coinbase Ventures, General Catalyst, Paypal Ventures, etc.

BTC Bitcoin Bear Market If you haven`t bought BTC before the recent rally:
Historically, Bitcoin has shown a tendency to retrace in December before starting a recovery around March. This pattern could repeat this season, with BTC facing selling pressure as year-end portfolio rebalancing and macro uncertainties weigh on the market.
While a brief Santa Claus rally might provide temporary relief, the bearish trend is expected to dominate until March. By then, BTC could trade below $84K before regaining momentum, aligning with its historical recovery trend as market conditions stabilize in spring.

BTCUUSD - Market outlookThere was another round of market chatter about quantum computers cracking Bitcoin this week, the kind of discussion that usually gets going when BTC is on sale and someone tries to tie price uncertainty to pressuring narrative, but this time Adam Back stepped in and shut the whole narrative down with a single explanation that may have took the tension out of the room for some.

Wheat in Focus: How Ukraine, China, and Weather could move WheatWheat is one of the world’s most widely traded agricultural commodities, essential for food and animal feed. Prices are heavily influenced by global supply and demand, with major producers including the U.S., Russia, the EU, Canada, Australia, and Ukraine. Weather conditions, geopolitical events, and large importer activity can all create significant volatility in the market. Let’s break it down.
1. What Drives Wheat Prices
Supply Factors
Wheat supply is heavily shaped by the major exporting regions—Russia, the EU, Australia, the U.S., Canada, and Ukraine. Weather is the biggest swing factor: drought, heat stress, floods, or winterkill can quickly tighten global supply and spark rallies. Crop progress reports and yield updates show how each production cycle is developing, while geopolitics—especially in the Black Sea—can disrupt export flows overnight. Input costs like fertilizer and fuel influence how much farmers plant, and currency moves affect which exporters are most competitive. Together, these factors determine how much wheat the world can actually deliver to the market. To summarize:
Major producers: Russia, EU, Australia, U.S., Canada, Ukraine
Weather: drought, heat stress, winterkill, floods
Crop progress: planting pace, crop conditions, yield expectations
Geopolitics: Black Sea tensions, export bans, sanctions, port disruptions
Input costs: fertilizer, fuel, logistics
Currency impact: strong USD usually weighs on wheat prices
Demand Factors
Demand for wheat is driven by global food consumption, animal feed needs, and the buying behavior of major importers such as China, Egypt, and Indonesia. Economic conditions matter because stronger economies consume more food and feed. Price relationships with other grains like corn and rice can shift demand toward or away from wheat. Changes in trade flows—such as China sourcing more from the U.S. instead of the Black Sea—can quickly redirect global shipments. These factors help traders understand whether demand is strengthening or weakening relative to available supply. To summarize:
Global consumption (food + feed use)
Large importer buying: China, Egypt, Indonesia, Turkey
Economic conditions in EM (Emerging Markets)
Substitution vs. corn/rice
Global trade flow shifts
2. Key Reports Traders Actually Need to Track
Instead of monitoring everything, wheat traders focus on the handful of reports that truly move price:
WASDE (Monthly) – The most important report in wheat trading. This is where global production, consumption, exports, and ending stocks get revised.
Wheat can rip or dump instantly on WASDE changes. If you track only one thing, track WASDE.
Weekly USDA Export Sales – This shows an immediate view of demand. Watch for:
Big purchases from China, Egypt, Indonesia
Surprising cancellations
Shifts from Black Sea to U.S. buying
It’s one of the fastest ways to spot demand changes ahead of price.
Crop Progress (Weekly, in season) – Important only during planting, growing and harvesting periods. The report tracks:
% planted
% harvested
Crop condition (% good/excellent)
Poor Conditions generally = bullish. Strong Conditions generally = bearish
Geopolitical headlines – In our opinion wheat is the most geopolitically sensitive commodity. Anything related to the following can cause immediate moves.:
Corridor shutdowns
Port attacks
Export bans
Ceasefire rumors
This is the intraday volatility driver that news traders capitalize on.
Weather in key regions (Daily / weekly) – Focus on the key regions of the U.S. Plains, Black Sea, Australia.
Drought in these regions generally = bullish. Good moisture generally = bearish.
Use simple sources like NOAA maps or short ag weather summaries (weather reports that impact agriculture).
CFTC COT (Weekly) – This is for context and is not used for trading signals. It shows whether funds are heavily long or short. Only the extremes matter:
Funds very short → short-covering rallies possible
Funds very long → risk of liquidation selloffs
This report is more relevant for swing and position traders.
3. Recent Market Drivers
Peace-proposal speculation:
Reports of a U.S. proposal involving Ukraine ceding Donbas triggered a fast selloff as markets priced in the possibility of Ukrainian exports normalizing.
Zelenskiy has stated he won’t accept territorial concessions, so a confirmed ceasefire remains unlikely unless U.S./EU pressure increases.
Market reaction:
Wheat dumped immediately on the headline, but the move didn’t sustain — traders want confirmation, not speculation.
China buying U.S. wheat:
Ongoing chatter that China is shifting some purchases to the U.S. (no official tonnage yet). This is a supportive demand story worth monitoring.
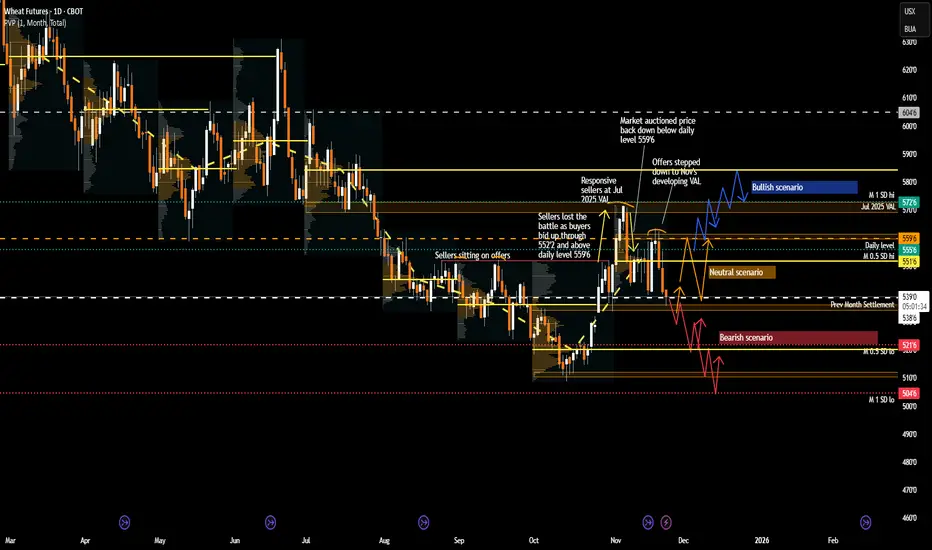
4. Chart Analysis: Recent Price Action and What to expect
The developing monthly VPOC for November 2025 has shifted higher, marking a potential change in market sentiment after three consecutive months of declining VPOCs. In addition, the developing VA for November appears unlikely to overlap with the previous month’s VA. This suggests that market conditions are changing and that the recent downward trend may be ending.
Market based out around 520 and rallied from mid-October to early November, breaking 552’4 (previous seller defense) and reclaiming back above 559’6 daily level.
This rally was likely supported by the potential U.S.–China trade deal and initial Chinese wheat purchases in early November.
However, sellers stepped in at 570 (July’s VAL + monthly 1SD high), offering price back below 559’6. Market is now rotating inside a developing range between 559’6 and the 540–535’6 zone (October settlement/LVN) to establish value.
Bearish Scenario
A break and acceptance below 540 opens the door toward:
520 (October’s VPOC + monthly 0.5SD low)
510 (October low)
504’6 (monthly 1SD low)
Catalyst: Any news of confirmed progress toward a Russia–Ukraine ceasefire → removal of war-premium → likely downside.
Bullish Scenario
If market accepts back above 559’6, sets up a move toward:
570 (July VAL / M 1SD high) — expect sellers here.
585’6 (July VPOC) if 570 is cleared
Catalyst: Headline reversal or escalation in the conflict between Russia and Ukraine.
Neutral Scenario
Without fresh catalysts, expect continued range rotation between 559’6 and 540, with the market establishing value in this zone.
5. Conclusion
Wheat remains a headline-driven and weather-sensitive market, where geopolitical developments, major buyer activity, and crop conditions can quickly shift sentiment. Traders should monitor key reports and technical levels while staying aware of global supply and demand dynamics. With multiple factors in play, range rotations and sudden spikes or drops are likely until a clear catalyst drives the market decisively.
What are your thoughts? Are you watching the headlines, weather, or technical levels for clues? Please share your insights below and give this post a boost so the rest of the community can join the conversation.
Glossary Index for technical terms used:
VAH (Value Area High)
VAL (Value Area Low)
VPOC (Volume Point of Control)
SD (Standard Deviation)
LVN (Low Value Node)
VA (Value Area)
Symmetrical Triangle incoming Avoid trading during a symmetrical triangle formation
Market Indecision & Uncertainty: Symmetrical triangles represent periods where buying and selling pressures are almost equal, causing price to consolidate with lower highs and higher lows converging towards a point. There's no clear directional bias until a breakout occurs, making trade direction and timing highly uncertain during the formation phase.
Risk Management Challenges: Stop-loss placement inside the triangle is unreliable, as price often touches both trendlines without a breakout, increasing the probability of being stopped out repeatedly

If I hadn’t second-guessed the forecast, my risk-to-reward 1:5As mentioned before, the y-axis of the AI output is fixed. If the price action goes beyond the forecast image, it simply means the forecast can’t cover the full range. In those cases, we rely on market shape and timing instead.
This is a great reminder to trust in the new era of AI accuracy and really let it guide us!
If I hadn’t second-guessed the forecast, my risk-to-reward (R:R) would have been 1:5 🤩

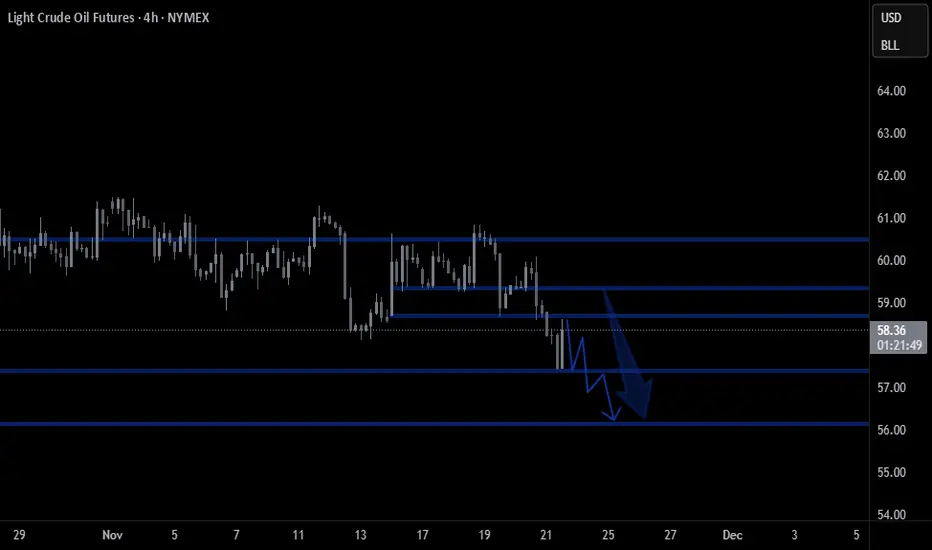
CRUDE OILDO YOU KNOW WHATS BEHIND THIS OR OTHER IDEAS?? in bio..
Preferably suitable for scalping and accurate as long as you watch carefully the price action with the drawn areas.
With your likes and comments, you give me enough energy to provide the best analysis on an ongoing basis.
And if you needed any analysis that was not on the page, you can ask me with a comment or a personal message.
Enjoy Trading ;)