IONQ Showing Classic Reversal Clues After SweepIONQ is showing a textbook liquidity sweep followed by a strong reaction back to the upside — a pattern that often hints at a potential reversal.
Price recently swept key sell side liquidity before quickly reclaiming higher levels, suggesting absorption and possible accumulation. This type of move typically signals that downside objectives may have been satisfied, with the market now preparing for a structural shift.
The focus this week is on confirmation:
- Do we see continuation with higher highs and supportive structure?
- Or does price reject and return to range?
If momentum holds, this could mark the early stage of a broader push higher. Definitely one to monitor closely as the week develops.
Disclaimer: This is for educational purposes only and not financial advice. Always do your own research (DYOR) before making any trading decisions.
Beyond Technical Analysis

MicroStrategy Analysis: Bitcoin, Quantum Risks, and FutureMicroStrategy recently released its Q4 2025 financial results, showcasing a resilient software business. The company maintains a strong cash position while expanding its Bitcoin holdings. Revenue from enterprise analytics remains stable despite global economic shifts. However, the firm’s massive digital asset exposure continues to define its market valuation.
Technology Innovation and Patent Leadership
MicroStrategy dominates the enterprise analytics industry through continuous innovation. The company holds a comprehensive portfolio of patents in data visualization and AI. Their recent "MicroStrategy Orange" protocol marks a significant leap into decentralized identity. This high-tech approach integrates Bitcoin’s security with enterprise-grade software solutions.
The firm leverages cloud-native architectures to drive digital transformation for global clients. This strategy ensures long-term relevance in a competitive software market. Their commitment to R&D maintains a defensive moat against emerging tech startups.
The Bitcoin Exposure and Market Volatility
MicroStrategy utilizes a bold business model centered on Bitcoin as a reserve asset. This geostrategy offers unparalleled upside during digital asset rallies. However, the company faces significant risks during severe market crashes. A deep price correction could trigger liquidation fears among institutional investors.
The firm’s fate remains tied to the volatile fluctuations of the cryptocurrency market. This concentration risk demands a high tolerance for macroeconomic instability. Investors view MicroStrategy as a high-beta play on the future of decentralized finance.
The Quantum Threat to SHA-256 Encryption
Cybersecurity experts express growing concern regarding quantum computing power. Bitcoin’s security relies on the SHA-256 encryption protocol. Science suggests that future quantum machines could crack this standard with ease. Such a breakthrough would compromise the entire Bitcoin network and its stored value.
For MicroStrategy, this represents a fundamental technological risk. If the underlying protocol fails, the company’s primary asset could become worthless. This high-tech vulnerability looms over the long-term viability of digital treasuries.
The Upgrade Paradox and Wallet Access
Upgrading Bitcoin to resist quantum attacks presents a complex technical challenge. Any major change requires a consensus across a global, decentralized network. A failed or rushed upgrade could lead to a permanent network lock. This scenario would render millions of wallets inaccessible to their owners.
MicroStrategy cannot unilaterally fix these protocol-level issues. The inability to seamlessly transition to quantum-resistant standards creates a potential "dead-end" for digital assets. This structural risk remains a primary concern for sophisticated financial analysts.
Regulatory Pressure and Geopolitical Shifts
Regulatory uncertainty continues to hover over the entire cryptocurrency industry. Geopolitical tensions often lead to stricter capital controls and digital asset oversight. Governments may implement harsh laws to protect sovereign currencies from decentralized competitors.
MicroStrategy operates at the intersection of traditional finance and the new digital economy. Changes in SEC or international tax laws could impact their balance sheet. Management must navigate these shifting legal landscapes with precision and foresight.
Leadership and Corporate Culture
Michael Saylor’s assertive leadership defines MicroStrategy’s corporate identity. His conviction drives the company’s aggressive acquisition strategy and innovation roadmap. This culture of "extreme ownership" attracts investors who value visionary management.
The company fosters an environment of technical excellence and strategic boldness. Saylor’s ability to communicate complex economic theories keeps the brand relevant. This leadership style remains a cornerstone of the company’s market influence.
Macroeconomic Trends and Future Outlook
High-interest rates and inflation influence MicroStrategy’s cost of debt. The company’s ability to leverage its software revenue to buy Bitcoin is a unique economic experiment. As global markets evolve, the firm must balance growth with debt obligations.
The intersection of science, finance, and high-tech will determine MicroStrategy’s ultimate success. While the rewards are potentially astronomical, the technical and regulatory hurdles are equally significant. Only time will reveal if this daring strategy pays off for shareholders.

XAUUSD Review February 09 2026Short-term price movement ideas.
The price has filled the nearest weekly FVG and tested the consolidation zone, which may create conditions for a continuation of the upward movement. Within the weekly zone, there was a daily trigger in the form of a low that was swept, followed by the formation of a daily long RB. The price then tested the daily zone and formed a 4H bullish trend. At this point, we should expect a test of the 4H zone and confirmation on the 1H timeframe. If this occurs, a long position can be considered.
Be flexible, adapt to the market, and the results will come quickly. Good luck to everyone.

LIRA Expectation: 1 Week
From the LIRA chart, it can make the retest downside till Friday, under 43.46 point, the first target is 43.30 point and second target is 43.12 point, after the retest. 43.72 point is the upside target.
Yearly target is 52 Lira Per USDT.

BTCUSD LONG VIEWS !!“The Sharpe ratio has just entered a particularly interesting zone, one that has historically aligned with the final phases of bear markets
⚪ Demand Zone
70300 70000
Institutional reaction zone
Potential bullish mitigation area
Liquidity resting below
🟥 Major Support
70000
Structure invalidation level
Break = bearish continuation scenario

EUR/USD - Fundamental / Tech & 1W/1M Macro OutlookFX:EURUSD
The EU economy might be in a coma, but EUR/USD is finally trying to pull out of a long-term bear trend. Technically, we’ve seen a breakout of key levels following a bull flag, so this week is all about confirmation or rejection. Below is my macro and technical analysis, along with a specific game plan
Fundamentals:
- before taking the technical picture under loop, it’s important to break down EUR/USD from the fundamental and macroeconomic side. Local dollar strengthening might cause a short-term drop in the euro, but it won’t be the force that pushes the price south globally
- the Eurozone has been in economic stagnation for quite a while now because production is slowly weakening due to a lack of resources, high energy prices, and high spending on non-productive sectors
- at the same time, the Eurozone is very wealthy, and the resource deficit can be offset by increased imports. To make imports more profitable, the national currency must be strong (so you can buy more goods for one unit of currency), while for more profitable exports, a weak currency is better (you get more money for one unit of goods)
- this is why the resource-rich US has a weak dollar and increases its exports, while resource-poor but cash-rich Europe increases imports and has weak exports because it can’t produce much
- for this same reason, the European Central Bank made no changes to the interest rate last week (if the rate goes down, loans become more profitable for companies, which stimulates the economy by helping production; if the rate goes up, loans become less attractive and production drops) while saying inflation might even decrease (but probably no signs of possible deflation)
- an interesting fact is that in Jan. 2026, the EU signed a truly massive trade deal with India (a country rich in resources and labor), specifically on simplified customs duties for many goods (excluding agricultural products and a few others)
- looking at this through the lens of assumptions, the EU market could be flooded with resources and goods they desperately need, and this increase in domestic resources in EU could lead to a ramp-up in production volumes, potentially boosting industrial earnings, household income, and overall GDP
- as a matter of a fact at the same time the India's market will get a major boost to its economy and production, whereas allowing to significantly increase its GDP over the next few years, and we can also see that the probability of the Indian Rupee rising definitely increases
- of course, there are opposing views and news—for example, Macron recently said the euro is too expensive and needs to be cheaper. Locally this can be the case, but globally today this is far from beneficial for Europe, so in my opinion this kind of news is more like media noise rather than the most probable outcome
Technicals:
- since Oct. 2022, the price reversed after hitting major lows and in Feb. 2025 it confirmed the start of a new medium-term bullish trend, finally breaking out of the long-term descending channel that has been in place since 2008
- during the last week of Jan. 2026, there was an attempt to break a multi-year resistance level of "medium strength" (originating from 1998), which resulted in a false breakout. Why "medium strength"? Historically, the price tends to perform a fakeout here, followed by a technical retracement to the 0.236 Fibonacci level (and rarely a deeper correction towards 0.382), before eventually resuming momentum for a full breakout
- a local correction in DXY towards 98.70 (approx. +1.12% from the current 97.60) could proportionally lead to a local EUR/USD weakening toward the 1.16910 area
- this price target coincides with a mirror support/ressistance level formed in Aug. 2017 and later confirmed in Mar. 2021 and Oct. 2021
- a strong weekly bar has left an imbalance within the {1.16984, 1.17655} range, making this a point of Interest (POI) for further liquidity hunt
- looking at the monthly chart on the screenshot below, the price is testing the upper boundary of a descending consolidation channel for the third time. This is looks like forming a bull flag pattern, which historically signals local accumulation before a further move to the upside
- 1. optimal scenario: 1.16912 is the primary target with a risk-reward ratio of 1:3.65 with taking partial profits (at 45% level of the untouched order zone) at 1.1733, in case HFTs or market makers decide to leave some liquidity untapped for a later move
- 2. optimistic scenario: should sell-side pressure prevail in the local context, the price may test the long-term support level at 1.16400
- 3. pessimistic scenario: conversely, if the price fails to break resistance and consolidate above 1.19050, we could see a move south toward 1.13960 to sweep liquidity below the 1.14680 support. However, this move would take significant time to materialize and should only be considered if the price fails to hold above 1.16400
- local short scenario invalidated if 2 bars close above 1.18780
- higher probability of global long continuation if 2 bars close above 1.19400 ( increased risk if entry at 1.19100 )
Conclusion:
- the Euro has recently broken out of a multi-year downtrend and is currently sitting at the upper boundaries of both a descending consolidation channel and a local ascending channel
- this trade is focused on a retest of the {1.16984, 1.17655} range to clear liquidity before any attempt to test the major resistance at 1.19050
- risk management constraints do not allow for a stop-loss at 1.19420 (the price level which, if held above, would confirm the continuation of the medium-term bullish move)
- the basis for this local short is a combination of the local technical setup, the macroeconomic backdrop, and the currency correlation with the DXY
- higher probability of global long continuation if 2 bars close above 1.19400 (increased risk if 1.19100)
- higher probability of global short continuation if 2 bars close below 1.16100 (increased risk if 1.16750)
- last but not least: always keep the "Black Swan" in mind and stay critical. The EU economy is still in a very fragile state, and the points mentioned above are merely attempts to resuscitate it from an economic coma. Unexpected events can always shift market sentiment overnight, rendering any technical or fundamental analysis useless. Use your head and always weigh the probabilities of different outcomes and their consequences
# - - - - -
Local Short Scenario:
⚠️ Short/Swing-term Signal - Sell ⬇️
✅ Entry Point - 1.1842
🛑 SL - 1.18860
🤑 Partial TP 50% - 1.1749
🤑 Final TP 100% - 1.1692
⚙️ Risk/Reward - 1 : 3.68 👌
⌛️ Timeframe - 3 weeks 🗓
# - - - - -
If price consolidates at 1.19 - 1.195:
⚠️ Long-term Signal - Buy ⬆️
✅ Entry Point - 1.19100
🛑 SL - 1.18170
🤑 TP - 1.22370
⚙️ Risk/Reward - 1 : 2.15 👌
⌛️ Timeframe - 3 months 🗓
# - - - - -
Good Luck! ☺️
# - - - - -
DISCLAIMER: Not financial advice. Everyone must make trading decisions at their own risk, guided only by their own criteria and strategy for opening or not opening a trade

Day 103 — +$1,286 Profit: Preparing for a Wild WeekEnded the day +$1,286 trading S&P 500 Futures. Apologies for the lack of posts recently—I've been incredibly busy, but I'm making an effort to get these journals out, even if I have to shift to a weekly format. The market has been playing out exactly according to our weekly analysis, which is huge validation for the strategy. We are seeing range expansion everywhere, which tells me this coming week is going to be wild. Big ranges mean big opportunities if you stick to the major levels.
Day 103— Trading Only S&P 500 Futures
Daily P/L: +1286
Sleep: 5 hours
Well-Being: Good
🔔News Highlights: *STOCK FUTURES RISE IN SUNDAY NIGHT TRADE, VIX FALLS AS INVESTORS BRACE FOR BUSY WEEK
📈Key Levels for Tomorrow:
Above 6890 Bullish Level
Below 6870 = Bearish Level

EURUSD - TO THE MOON -BULLISH Swing Entry :
- Accumulation
- Liquidity Sweep to the Down-Side
- 200 EMA support
- Volume Profile Support
- Change in the state of delivery
- Movement from the Discounted Demand zone
- Standard Deviation confirmation

Bitcoin weekly—Relief rally (inverted correction) vs bear marketBitcoin just ended a major correction, a classic ABC. It was 53.56% strong (-53.56% from top to bottom).
The last weekly session produced the highest volume on the sell side since March 2024. The last bullish move started August 2024. This volume signal reveals that lower prices are likely in the latter part of 2026. It also reveals that any bullish action that starts now should be short-lived, short-term, and should end in a lower high.
The correction bottom reached $60,000 on a wick. Multiple support levels were pierced. The weekly session close happened at $70,330.
Bitcoin closed below the 0.5 Fib. retracement level in relation to the long-term market cycle, which sits at $70,839, but above the 0.618 level ($57,772). The fact that the 0.618 Fib. retracement level missed completely calls for some sort of relief rally, short-term bullish action.
This opens up two targets mainly right away, without going through too many calculus: 1) The previous high around $98,000 and 2) the 0.382 Fib. retracement level in relation to the current correction, which sits at $85,288. The latter is an easy, high probability target. This is the minimum price Bitcoin will challenge in the coming weeks.
We can speculate about other developments; the wave's size, shape and duration, but this is all irrelevant at this point. The most basic fact that can be extracted from this chart is that Bitcoin is going up as a market reaction to the strong down-move, an inverted correction.
This up-wave is bound to happen regardless of past cycles, ETFs, the news, astrology, moon landing, etc. The chart calls for a relief rally and this is what we will get. The rest is just hocus pocus and much speculative opining.
The most important development on this chart is the most recent move. Its duration was 119 days based on the weekly candles. The inverted correction's duration will happen in relation to this move because the market is reacting to it. The market is reacting to the fact that Bitcoin hit $60,000. To the fact that it pierced several strong long-term support levels but failed to close below them. The market will exploit this and push prices higher.
The inverted correction can last a maximum of 60 days, which is around half the time the duration of the main move.
39% of 119 days gives us 46 days. We are starting to form a picture as to the duration of the relief rally and I think this is enough for today.
While the inverted correction takes place on Bitcoin, the altcoins market will blow up.
Thank you for reading, your continued support is highly appreciated.
If you enjoyed the content, make sure to comment.
Namaste.

Is 16000 - 19000 Possible for BTC??BTC Analysis
CMP 66200.71 (05-02-2026)
Hit the Target of Cup & Handle around 120000 - 123000 & then crashed.
Now it may bounce back from 61000 - 63000 towards 80000.
However, breaking the important Support zone (61000 - 63000)
may drop the price further around 48000 & then around 33000.
For long term investment, the most attractive buying range is
around 16000 - 19000 (if it comes).

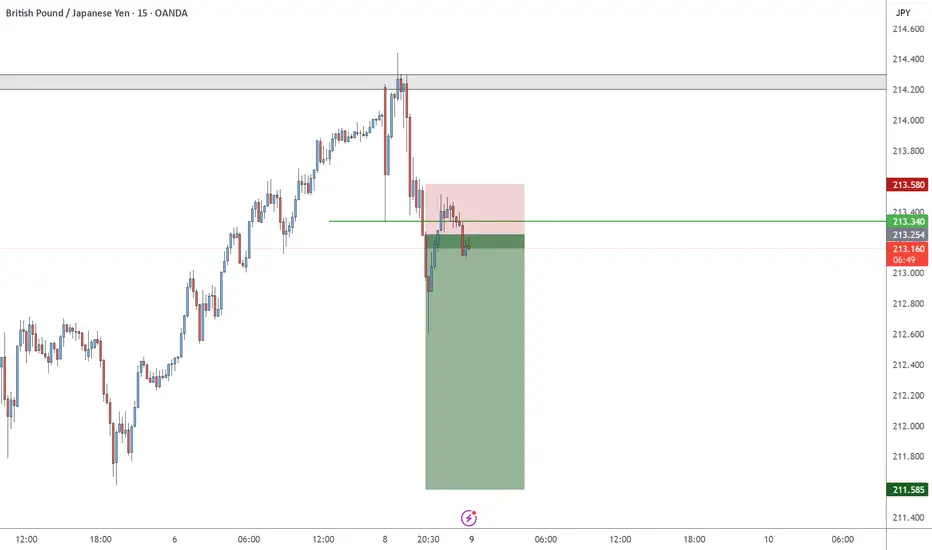
AUDJPY INTRADAY SELLAfter price rejecting resistance and giving a strong reversal candle stick pattern, AUDJPY hopes to visit the previous support after breaking structure on the 15 minutes time-frame

XAUUSD Breakout Confirmed — Is Gold Preparing for a Major Rally?📊 Market Structure
Gold has successfully broken above a descending trendline, signaling a potential shift in short-term market structure from bearish to bullish.
After the breakout, price formed strong higher lows — suggesting buyers are stepping in with momentum.
---
🧠 What I’m Watching
Price is now approaching a key resistance zone near 5,040.
A clean break and hold above this level could open the door for the next bullish expansion.
As long as gold remains supported above the demand zone, the path of least resistance appears to be upward.
---
🔑 Key Levels
Demand Zone: 4,920 – 4,960
Resistance: 5,040
✅ Bullish Bias: While price holds above demand
❌ Invalidation: Sustained move below 4,920 may weaken bullish momentum
---
🚀 Trade Idea
Breakout + structure shift often leads to continuation phases.
If buyers maintain control, gold could begin its next leg higher in the coming sessions.
---
⚠️ Risk Note
This analysis is for educational purposes only. Always use proper risk management.
---
Do you see gold breaking this resistance — or forming a rejection?
Bullish or bearish from here? Comment below!

BTCUSD - Post-Dump Check: Stabilization Before the Next Big MoveLast week’s BTC dump wasn’t random or emotional — it was structural. The market broke a key trend, flushed leveraged positioning, and forced price into a zone where real buyers had to show up. What we’re seeing now is not a V-shaped recovery, but something more important: acceptance and stabilization after damage.
This is the kind of phase that decides whether BTC builds a base… or just pauses before another leg lower.
1D – Big Picture Damage, But Not Capitulation
On the daily timeframe, BTC lost its rising trend structure that had been guiding price since late 2025. Once that ascending trendline failed, downside momentum accelerated quickly — classic liquidation-driven selloff.
The key detail:
Price did not free-fall endlessly. Instead, BTC found demand in the 60k–62k region, where buyers absorbed aggressive selling and printed a strong reaction wick. That tells me this was a forced unwind, not long-term distribution.
Important daily levels:
* Major resistance: 84k–86k (prior range floor, now supply)
* Mid resistance: 80k–81k (failed bounce zone)
* Major support: 60k–62k (strong demand response)
As long as BTC remains below 80k on the daily, the market is in recovery mode, not a bull continuation.
4H – Base Building vs Dead-Cat Bounce
The 4H chart gives more clarity on what’s happening now.
After the dump, BTC printed a clean sell climax → bounce → consolidation sequence. Price reclaimed short-term structure but stalled under former support near 70k–71k, which is now acting as a decision area.
We’re seeing:
* Slower downside momentum
* Overlapping candles
* Compression under resistance
That’s not weakness — that’s indecision after volatility.
Key 4H levels:
* Resistance zone: 70.5k–71.5k
* Local support: 68.8k–69.5k
* Failure zone below: 66k–67k
* Major demand below: 60k–62k
If BTC reclaims and holds above 71.5k on a 4H close, the next upside magnet sits near 75k–78k.
If it fails here, another sweep toward the high-60s is very much on the table.
15m – Short-Term Control Zone
On the 15-minute timeframe, BTC is clearly trading inside a tight compression range. Price is respecting both short-term moving structure and horizontal levels, which tells me the market is waiting — not panicking.
What matters intraday:
* Range high: 71.1k–71.3k
* Range low: 69.9k–70.0k
* VWAP / mean area: 70.4k–70.6k
As long as BTC stays inside this box, chasing is a mistake. The move will come after acceptance, not before it.
What Caused Last Week’s Drop
This wasn’t news-driven fear. It was positioning.
BTC was extended, leverage had built up, and once the daily trend failed, stops and liquidations did the rest. The speed of the move confirms that weak hands were flushed — but the reaction low shows stronger hands stepped in.
That’s constructive, even if it doesn’t mean “up only.”
What I’m Watching Next (Next Few Weeks)
This is the important part.
BTC is now in a make-or-break zone for the medium term:
* Holding above 68k–70k → base formation → higher probability of reclaiming 75k+
* Losing 68k cleanly → retest of mid-60s
* Losing 60k → trend damage extends into a deeper corrective phase
For now, the market is telling us one thing clearly:
No urgency. No trend. Patience required.
This is a trader’s market, not an investor’s breakout moment.
So what we see here is after a dump like last week, the best trades come after boredom, not during volatility. BTC is doing exactly what healthy markets do after damage — slowing down, compressing, and forcing participants to wait.
Let price prove direction again.
React to confirmation, not hope.

SPY. Key Decision Zone After Strong Bounce for Feb 9-13What I’m Watching
SPY put in a solid recovery after selling off earlier in the week, but price is now pushing into a zone where things usually slow down. The bounce was clean, momentum improved, and buyers clearly stepped in — but we’re no longer in “easy upside” territory. From here, it’s about whether price can accept higher or starts reacting at resistance.
1H – Bigger Picture Structure
On the 1H, SPY is still operating inside a broader descending structure, but the most important detail is how price reacted off the lower channel support near 670–672. That area held cleanly, and we’ve since seen a strong impulsive push back toward the upper range.
The move higher was not random — it reclaimed multiple short-term structure levels and flipped momentum back to the upside. That said, price is now approaching a previous supply / rejection zone around 690–692, where sellers have shown up before.
This is where the market typically pauses to decide:
* Either accept higher and continue the recovery
* Or rotate back down into the range
As long as price holds above 680–682, the structure remains constructive. A failure back below that area would shift things back to range behavior.
15m – Execution & Price Action
Dropping to the 15m, the structure is much cleaner. After the bounce, SPY printed a series of higher highs and higher lows, showing clear buyer control. The pullbacks have been shallow, which tells me sellers are not aggressive yet.
Right now, price is compressing just under resistance near 690–692, which lines up with prior highs and short-term supply. This kind of sideways action after an impulsive move often leads to one of two outcomes:
* Acceptance above 692 then continuation toward higher resistance
* Rejection here then rotation back toward 685, then 680
If we see acceptance above 692 with volume, that opens the door for continuation. If price stalls and starts losing 15m structure, I’d expect a pullback into the mid-range rather than an immediate breakdown.
GEX – Options Positioning & Context
From a GEX perspective, SPY is currently trading below the major call wall and positive gamma resistance, which explains why upside has started to slow. This is not a clean positive gamma environment yet — it’s more of a friction zone where price needs effort to push higher.
Below, there is still meaningful put support sitting around 675–680, which aligns well with the structure support from price action. That’s the zone I’d expect dealers to defend if we rotate lower.
Until SPY can flip above the higher call walls, upside will likely be grindy, not explosive. That favors patience and level-to-level trades rather than chasing breakouts.
How I’m Approaching This
* Above 692 (acceptance): Look for continuation plays toward higher resistance zones, but expect slower follow-through unless GEX flips more supportive.
* Rejection at 690–692: I’m looking for pullbacks into 685 or 680 as potential reaction areas.
* Below 680: Structure weakens and range conditions return — not a spot to be aggressive.
This is a market that rewards discipline right now. The easy move already happened. From here, it’s about reacting at levels, not predicting direction.
This analysis is for educational purposes only and reflects my personal view of market structure and options positioning. Always manage risk and trade your own plan.

NVDA — Weekly Structure & Options Context (Feb 9–13)NVDA had a sharp reaction off the recent lows, and that bounce was meaningful — not slow, not sloppy. Buyers stepped in with intent and forced price back above prior intraday structure. That shift matters. However, NVDA is now trading into an area where momentum historically slows, and this is where the trade becomes more about patience and confirmation, not chasing strength.
Higher-Timeframe Structure (1H)
On the 1H, NVDA clearly reclaimed a key demand zone after the selloff and printed a higher low, shifting short-term structure back to bullish. The push off the lows was impulsive, which tells me this wasn’t just short covering — there was real participation.
That said, price is now approaching a prior supply zone from the breakdown area. This is where NVDA previously stalled and rolled over, so it’s normal to see the pace slow here. As long as NVDA holds above the 178–180 region, the recovery structure remains intact. A clean loss of that level would weaken the bullish case and turn this into a broader consolidation.
Intraday Structure (15m)
On the 15m, NVDA has been respecting higher lows since the bounce, but momentum has flattened as price pushes into resistance around 185–187. This is not bearish by itself — it’s what strong stocks often do before deciding on the next leg.
What matters on this timeframe is behavior:
* If NVDA holds above 182–183 and starts compressing, that’s constructive and keeps continuation on the table.
* If price starts losing those intraday higher lows with volume, expect rotation back toward 178–175 rather than immediate continuation.
This is not a chase zone. It’s a wait-and-see zone.
GEX & Options Positioning
From the GEX perspective, NVDA is currently sitting below a cluster of call resistance overhead, which lines up well with the current pause in price action. That overhead call positioning adds friction — price can move higher, but it won’t be effortless.
On the downside, put support is strongest around 178–175, aligning with the higher-timeframe demand zone. As long as NVDA stays above that area, downside should remain controlled. A break below that zone would likely shift dealer positioning toward negative gamma and increase downside speed.
Key Levels to Watch
Resistance
* 185–187: Near-term supply / rejection zone
* 190–195: Major upside objective if continuation holds
Support
* 182–180: First intraday support
* 178–175: Key demand and put support
* 170: Larger downside level if structure fails
Scenarios
Bullish continuation
If NVDA can hold above 182–183 and eventually accept above 187, the path opens toward 190–195, with momentum likely improving once call resistance is cleared.
Rotation / consolidation
Failure to push through 185 keeps NVDA rotating between 178–187, favoring patience and level-to-level execution rather than momentum chasing.
Bearish shift
A clean loss of 175 would invalidate the recovery structure and bring 170 back into play quickly.
What I see and how I’m approaching it
NVDA already delivered the easy part of the move. Now it’s at a spot where strong names either build and continue, or pull back into demand before the next leg. I’m not chasing strength here — I’m watching how price behaves at resistance and whether support continues to hold.
Let price do the work. Structure will tell you what’s next.
This analysis is for educational purposes only and reflects personal market observations, not financial advice.

Accumulation below 5134 - gold price⭐️GOLDEN INFORMATION:
Gold price (XAU/USD) rises to near $5,035 during the early Asian session on Monday. The precious metal extends its recovery amid a weaker US Dollar (USD) and rising demand from central banks. The delayed release of the US employment report for January will be in the spotlight later on Wednesday.
US Treasury Secretary Scott Bessent on Thursday refused to rule out the possibility of a criminal investigation of Kevin Warsh, President Donald Trump’s nominee for US Federal Reserve (Fed) chair, if Warsh ends up refusing to lower the interest rates. Concerns over the Fed’s independence continue to drag the Greenback lower and provide some support to the USD-denominated commodity price.
⭐️Personal comments NOVA:
Gold prices recovered above 5000, consolidating and stabilizing. Trading below 5141.
⭐️SET UP GOLD PRICE
🔥SELL GOLD zone: 5140 - 5142 SL 5147
TP1: $5125
TP2: $5100
TP3: $5082
🔥BUY GOLD zone: 4834- 4836 SL 4829
TP1: $4850
TP2: $4865
TP3: $4885
⭐️Technical analysis:
Based on technical indicators EMA 34, EMA89 and support resistance areas to set up a reasonable SELL order.
⭐️NOTE:
Note: Nova wishes traders to manage their capital well
- take the number of lots that match your capital
- Takeprofit equal to 4-6% of capital account
- Stoplose equal to 2-3% of capital account

AMZN — Post-Earnings Structure & Options Context (Feb 9–13)AMZN is still digesting its post-earnings move, and the structure tells a very clear story: this is no longer a trending environment, but it’s also not breaking down aggressively. Price is stabilizing after a sharp selloff and transitioning into a controlled recovery phase.
Higher-Timeframe Structure (1H)
On the 1-hour chart, AMZN put in a strong impulsive drop from the 240s, followed by a clean base near the 195–200 demand zone. Buyers stepped in decisively there, and price has since been grinding higher in a shallow ascending structure.
That bounce, however, is running into descending resistance from the prior breakdown. Until price can reclaim that upper structure, this remains a recovery inside a larger bearish context, not a full trend reversal.
Intraday Structure (15m)
The 15-minute chart shows a sequence of BOS events off the lows, followed by a minor CHoCH as price moved into resistance. That tells me buyers are active, but momentum is starting to slow as supply steps back in.
Right now, 210–215 is acting as the decision zone. Price is compressing here, which usually precedes either continuation or rotation back toward support.
GEX & Options Positioning
From the GEX view, AMZN is sitting below a heavy call resistance cluster around 220–235, with the strongest positive gamma positioned overhead. That suggests upside may be mechanically capped unless price can push and hold above these call walls.
On the downside, put support is concentrated around 200–197, aligning closely with the demand zone that sparked the bounce. If price slips back below 205, dealer positioning favors a quicker move lower rather than a slow drift.
Key Levels
Resistance
* 215–217: Near-term supply / rejection zone
* 222–235: Major call resistance and gamma wall
Support
* 205–202: First structural support
* 200–197: Major demand and put support
Scenarios
Bullish continuation
Acceptance above 217, followed by a clean push through 220, would open the path toward 230–235, but that move likely needs strong participation and volume.
Range / consolidation
Failure to break above 215 keeps AMZN rotating between 205–215, favoring patience and mean-reversion trades rather than momentum chasing.
Bearish continuation
A loss of 202 would weaken the recovery structure and bring the 200–197 zone back into play quickly.
So what i see here is AMZN is in a repair phase, not a chase zone. Let price show its hand at 215. Above it, there’s room — below it, respect the range. This is a structure-first market, not a headline-driven one.
This analysis is for educational purposes only and reflects personal market observations, not financial advice.

TSLA — Weekly Structure & Options Context (Feb 9–13)TSLA remains in a broader bullish recovery, but the short-term picture is no longer trending cleanly. After a sharp rebound from the 380s, price has rotated back into a well-defined resistance pocket and is now compressing rather than expanding. This is a transition phase, not an entry-on-sight zone.
Higher-Timeframe Context (1H)
On the 1-hour chart, TSLA is still holding above its prior demand zone, but the bounce has stalled beneath descending structure from the previous swing high. Price is respecting the downward trendline while printing smaller candles, suggesting reduced momentum as supply comes into play.
As long as price holds above the 400–402 area, the move higher remains a recovery rather than a failed bounce. A loss of that level would shift structure back to neutral-to-bearish.
Intraday Structure (15m)
The 15-minute chart shows multiple BOS signals on the way up, followed by a minor CHoCH inside the current resistance zone. This looks more like hesitation than reversal. The 405–415 range has become the near-term battleground.
Acceptance above the upper edge of this range is needed for continuation. Without it, price is vulnerable to rotation back toward support.
GEX & Options Positioning
From the GEX view, TSLA is trading below a cluster of call resistance around 420–430, with the strongest positive net gamma positioned higher. That suggests upside may remain capped unless price can reclaim and hold above these levels.
On the downside, put support builds near 402–405, with a deeper support pocket around 390. If price slips back below 405, dealer positioning favors faster downside movement rather than a slow grind.
Key Levels
Resistance
* 415–418: Current supply / decision zone
* 425–430: Major call wall and gamma resistance
Support
* 405–402: Near-term structural support
* 390: Larger demand and put support
Scenarios
Bullish continuation
A clean reclaim and hold above 418, followed by acceptance through 420, would open the door toward 430+, aligning with positive gamma expansion.
Range / rotation
Failure to hold above 415 keeps TSLA rotating between 405–415, favoring patience and range-based execution.
Bearish shift
A decisive loss of 402 would weaken the recovery structure and bring 390 back into focus.
So what i am thinking is TSLA isn’t broken, but it’s also not in an easy trend phase. This is the kind of spot where price either proves continuation or forces traders to slow down and respect rotation. I’m letting structure and acceptance do the talking this week.
This analysis is for educational purposes only and reflects personal market observations, not financial advice.

Gold outlookA quick look into gold and determining it directional bias. the gold movement is still strongly bullish, we lookinto how we can position ourselves in taking the very best advantage of it.

XAUUSD REVISITNG 5,093 LEVELAfter the weekly pullback, Gold is expected to fill the higher high level and might probably continue the trend

5-0 Harmonic Pattern:🚫 Stop entering trades without understanding technical analysis.
Before you risk your money, learn how the market actually speaks.
✨ We’re here to teach you the knowledge that turns randomness into strategy.
Unmasking the5-0 Harmonic Pattern:The Trend Reversal You Didn't See Coming**
Discovered by the visionary Scott Carney and unveiled in _Harmonic Trading, Volume Two_, the **5-0 pattern** isn't just another blip on a trader’s radar—it’s a siren of market reversal.
📈 **Why It Stands Out**
- Unlike the familiar Bat or Gartley structures, the 5-0 pattern is fueled by **precise Fibonacci ratios**, making its reversal zone deadly accurate.
- Centered around the pivotal **Point B**, this model doesn’t just hint at change—it defines it.
🌀 **The Anatomy of a Flip**
- Often marking the **first true pullback in a major trend reversal**, the 5-0 isn’t a lagging indicator—it’s your early warning system.
- The **AB leg?** That’s no ordinary wave—it’s usually the final gasp of a fading trend, setting the stage for powerful new momentum.
💥 **Bottom Line**
This isn’t just technical analysis—it’s strategic foresight. The 5-0 pattern reveals where the market **hesitates... and where you strike**.
---
_"To truly learn, we must see it in action.
So let’s pull back the curtain and share a powerful example from our **past insurance market trades**—a deal that blended precision, timing, and strategy.
In comments

GJ ranges between protected levels 214.298 and 210.312/210.059Sun 08Feb26 19:55 EST
As it is currently bullish on the Daily & Weekly, GJ climbed to 215.008. With that climb, it tested protected level (214.298) for a 2nd time. It did not violate 214.298, it still stands as the upper protected level, with its corresponding lower protected level being 210.059.
Next move: Continue watch for a violation of protected level 214.298 AND continue watch for a violation of the protected level (210.312/210.059).
1. If violation of (210.312/210.059), market may bear to 208.120.
2. If violation of 214.298, market may bull to 215.008 and possibly EITHER 1. create more new highs then drop to 208.120 or 2. try to reach for 215.887.
3. Market should not violate 215.887 (Being bearish on the monthly). If violate 215.887, all-time highs will follow and will climb as high as 217.353 & 221.316.
Disclaimer: For educational purposes only. Not financial advice. Trading involves risk and may result in loss of capital. Past performance does not guarantee future results. This is not a solicitation to buy or sell any financial instrument. Trade at your own risk
