Report 8/2/26Macro & Geopolitical Report
Summary:
This report evaluates the market impact of a compound shock: a fresh wave of AI-disruption pricing (agents and plug-ins interpreted as margin pressure for software and information-services businesses), a renewed U.S. monetary-regime narrative (Warsh as the prospective Fed chair, with markets debating “credibility vs liquidity”), and a trade–energy linkage that pulls geopolitics into inflation expectations (U.S.–India trade dynamics intersecting with India’s crude sourcing and the broader Russia-oil channel). The central thesis is that the market is no longer trading “growth vs recession” in a clean way; it is trading discount-rate uncertainty and business-model uncertainty at the same time. That mix typically produces index resilience with fragile internals, meaning headlines can push a seemingly stable market into fast rotations and abrupt drawdowns.
What happened and why it matters now
The immediate trigger was the market re-interpreting the AI cycle: instead of “AI equals capex boom equals software winners,” investors began pricing the possibility that advanced agents can compress pricing power for certain software layers and disintermediate some data/information tollbooths. That matters because it attacks the part of the equity market that has carried the multiple—high-margin, high-duration cash flows—and it does so through an earnings-quality lens (renewals, seat counts, pricing, churn), not just sentiment.
At the same time, the Fed narrative shifted from “timing of the next cut” to “what kind of Fed are we going to have,” which is structurally more destabilizing. When markets price a chair transition as a regime pivot, the response is not confined to the front end of the curve; it changes term premium, volatility, and the perceived reliability of the policy backstop. This intersects directly with the AI shock because high-duration equities are effectively leveraged to discount-rate stability.
Finally, trade policy returned as a live inflation variable. When trade deals are framed with conditionality—explicitly or implicitly—around strategic commodities (including crude flows and sanctions compliance), you increase the risk that energy and supply chains become bargaining chips. That keeps a bid under inflation tails even when spot inflation looks contained, and it can reintroduce “macro whiplash” into rates and FX.
Market reaction and positioning signal
The market’s headline-level calm is masking a violent internal re-rating. The key signal is that investors are rotating away from crowded narrative exposures and into assets that can “survive multiple regimes”: defensives with visible cash flows, selective cyclicals with pricing power, and hedges that perform when policy credibility is questioned. When the tape does that, it often means the market is de-risking structure, not only direction.
The positioning implication is straightforward. When a narrative trade becomes crowded (AI software winners, long-duration growth, “easy policy soon”), it doesn’t need a recession to correct; it needs a story-break that forces investors to revisit the terminal assumptions. AI agents created that story-break for software margins, while the Fed-chair narrative created it for liquidity certainty. Together, they increase the probability of gap risk in the most crowded exposures.
Macro transmission mechanism
This event transmits through two interacting channels. The first is the discount-rate channel: if the Fed regime is perceived as more balance-sheet restrictive or less inclined to cushion markets, then term premium and real-rate volatility rise, and long-duration equities become more fragile even if nominal growth remains okay. The second is the earnings-quality channel: AI disruption affects revenue durability, pricing power, and competitive moats, which drives dispersion and a reassessment of which earnings streams deserve a premium multiple.
A third, secondary channel is inflation optionality via trade and energy. Trade conditionality tied to strategic commodities can widen the distribution of oil outcomes, which feeds into inflation expectations and, in turn, constrains central banks. Even if spot crude is stable, the option value of disruption increases, and markets price that first in volatility and correlations.
Political and fiscal implications
Politically, a Fed-chair transition is a high-stakes credibility test. Markets can initially reward the perception of “discipline,” but that reward is conditional on institutional stability. If the process becomes contentious—confirmation politics, perceived interference, or public pressure campaigns—then the same transition that looked credibility-positive can become uncertainty-positive, raising risk premia.
Fiscal dynamics amplify the sensitivity. When deficits are large and refinancing needs are heavy, any sustained rise in term premium tightens conditions quickly and forces tradeoffs between growth support and credibility. That matters because it can turn a “market-friendly” equity narrative into a “bond-market discipline” narrative, where equities stop rallying on good news and start reacting to the cost of capital.
Forecast: base case and pivot points
The base case for the next 2–6 weeks is high dispersion with range-bound indices. The AI disruption shock fades from panic to analysis, but it leaves a scar in multiples for the most vulnerable business models. Simultaneously, the Fed regime debate keeps rates volatility elevated, which discourages aggressive duration bids in equities. In this base case, index levels can hold up, but leadership rotates frequently and breadth becomes the tell.
The upside case is “AI is additive, not substitutive” plus “Fed transition is stabilizing,” which compresses volatility, supports multiple expansion, and restores leadership in high-quality growth. The downside case is “AI compresses pricing and renewals” plus “policy uncertainty lifts term premium,” which is the worst combination for equities: earnings estimates soften while discount rates become less friendly. The key pivot points are early evidence of pricing pressure in software (not anecdotes—observable guidance behavior), and the behavior of long-end yields during equity drawdowns (if yields fail to fall when equities fall, conditions are tightening structurally).
Assets:
XAUUSD (Gold)
Gold’s role here is less “inflation hedge” and more regime hedge. If markets interpret the Fed transition as credibility-positive and real yields rise, gold can face tactical headwinds. But if the transition increases institutional uncertainty or if trade/energy politics widen inflation tails, gold regains bid as a non-sovereign hedge. In the base case of high dispersion and uncertain policy, gold tends to trade in two steps: selloffs during dollar/real-yield spikes, then stabilization as investors rebuild convex protection.
S&P 500
The S&P is balancing two opposing forces: index-level support from liquidity and large-cap balance sheet strength, versus valuation pressure from discount-rate uncertainty and earnings-quality doubt in software-heavy components. In the base case, the index can chop sideways while leadership shifts away from fragile multiples and toward durable cash flows. If AI disruption becomes an earnings-revision cycle, the S&P becomes vulnerable because the hit is not confined to a corner of the market—it leaks into capex, hiring, and eventually credit.
Dow Jones
The Dow often benefits in this kind of tape because it is less concentrated in the most duration-sensitive, multiple-dependent areas. If investors want equity exposure but fear discount-rate volatility, they rotate toward constituents with nearer-term cash flows and tangible pricing power. The Dow can still fall in a broad risk-off, but relative performance tends to improve when the market is re-pricing “story multiples” downward.
USDJPY
USDJPY is the clearest barometer of whether this is primarily a rates-volatility story or a risk-off funding unwind story. If U.S. real yields and term premium rise on the Fed regime narrative, USDJPY tends to stay supported. If equity volatility spikes into genuine deleveraging, the yen can strengthen abruptly and USDJPY can drop even if U.S. yields are higher, because funding stress and repatriation dynamics dominate. In the base case, expect trend-plus-whipsaw: upward bias punctuated by sharp downside bursts during risk shocks.
DXY
The dollar is pulled in opposite directions. Credibility and higher real yields can support DXY, especially during volatility. But if markets begin to price U.S. political interference risk or fiscal dominance more aggressively, the dollar’s haven function can become less reliable over multi-week horizons. In this event set, DXY is best treated as a confidence gauge: sustained strength suggests the market believes in policy discipline; repeated failed rallies suggest the market is pricing U.S.-specific risk premia.
Crude Oil
Crude is affected indirectly here through growth and directly through trade–energy linkages. If the AI shock and higher discount-rate uncertainty tighten financial conditions, demand expectations soften and crude can drift. But if trade conditionality and geopolitics widen the distribution of supply outcomes, crude’s upside tail stays fat even in a flat spot market. In the base case, oil trades a “risk premium on/off switch”: it softens on calm diplomacy and growth caution, then gaps on any shipping/security or sanctions-enforcement surprise.
Closing synthesis
The central takeaway is that this is a regime and business-model repricing, not a single headline trade. The market is still capable of pushing indices higher, but it is doing so with fragile internals because both the discount-rate anchor (Fed transition uncertainty) and the earnings moat (AI agent disruption) are being questioned. The most reliable real-time tells remain the behavior of real yields, breadth, and USD performance during equity drawdowns.
Beyond Technical Analysis

BTC 2025 Roadmap + BTC/Gold Ratio OutlookBTC Chart Idea (until end of 2025)
The setup shown with the blue arrow remains my base scenario through year-end.
I expect a move down to the 72k zone this year. Before that drop, price can either push first to ~99k (this year’s equilibrium) or head straight to 72k. Once we tag 72k – which is last year’s equilibrium level – I see that as the major low, from where the next impulsive leg toward 140k should begin.
BTCUSD/XAUUSD ratio
Current ratio is sitting around 21. I’m looking for a pullback toward 16. It can go 25 first and then 16, or drop directly to 16. I don’t expect 16 to hold as a long-term low; the reaction from there should target 25 again as the most probable level, with room for even higher readings beyond that.

What is Positional Trading: FULLY EXPLAINED In the financial markets, traders are often categorized by how long they hold their positions. While some thrive on the adrenaline of buying and selling within minutes, others prefer to zoom out and capture the "big picture." This long-term approach is known as positional trading.
Positional traders hold investments for weeks, months, or even years to capitalize on major market trends. They ignore the daily noise and short-term volatility, relying instead on a combination of broad economic factors, company fundamentals, and high-timeframe technical signals.
In this comprehensive guide, we will define positional trading, compare it with other popular trading styles, explore actionable strategies, and break down the pros and cons to help you decide if this approach fits your trading personality.
Key Takeaways
Long-Term Focus: Positional trading involves holding assets for weeks, months, or years to ride out major market trends.
Dual Analysis: It heavily relies on a combination of fundamental analysis (economic data, earnings) and long-term technical analysis.
Stress-Free but Capital Intensive: While it offers lower stress and requires less screen time, it does expose traders to overnight risks and ties up capital for extended periods.
Top Strategies: Common methods include trend following, breakout trading, and value-based investing.
What is Positional Trading?
Positional trading is a long-term market strategy where the primary goal is to capture significant, sustained price movements over an extended period.
Instead of agonizing over small, intraday price fluctuations, positional traders analyze the overarching direction of the market—the primary trend. Once they identify this trend, they open a position and keep it active until the macroeconomic narrative or long-term technical structure changes.
The core philosophy is that the most profitable trends take time to develop and play out. By holding onto a trade through the inevitable short-term dips and rallies, positional traders aim to extract the maximum value from a macro move.
The Two Pillars of Positional Trading
To build conviction for a long-term hold, positional traders rely on two main forms of analysis:
Fundamental Analysis: This involves studying the underlying value of an asset. Traders look at economic indicators, interest rate policies, company earnings reports, and geopolitical events to determine long-term viability.
Technical Analysis: Traders use high-timeframe charts (Daily, Weekly, Monthly) and tools like moving averages, major support/resistance levels, and momentum indicators to optimize their entry and exit points.
Because these trades unfold over months or years, positional traders do not need to monitor the markets constantly. Their focus is on meticulous planning, strict risk management, and the patience to let the thesis play out.
Key Characteristics of Positional Trading
What makes a positional trader different from the rest of the market? Here are the defining traits:
Extended Holding Periods: Trades are kept open for weeks, months, or years, dictated entirely by the lifespan of the trend.
Focus on Macro Trends: The objective is to capture massive percentage gains from primary market cycles, not small daily pips.
Low Trading Frequency: Because positions are held for so long, positional traders execute far fewer trades than day or swing traders.
Patience and Psychological Discipline: Traders must remain unbothered during short-term market pullbacks and trust their initial long-term thesis.
Overnight/Weekend Exposure: By holding through market closures, positional traders are exposed to the risk of unexpected news events causing price "gaps."
Positional Trading vs. Other Trading Styles
To truly understand positional trading, it helps to compare it directly with the two other major trading styles: Swing Trading and Day Trading.
Position Trading vs. Swing Trading
Swing trading aims to capture short-to-medium-term price swings that last anywhere from a few days to a few weeks. Swing traders rely almost exclusively on technical setups and must react swiftly to shifting momentum.
By contrast, positional traders look past these minor swings. While a swing trader might buy a dip and sell the next rally, a positional trader will hold through multiple swings to capture the entire trend.
Holding Period: Position (Weeks to Years) vs. Swing (Days to Weeks)
Market Focus: Position (Macro Trends) vs. Swing (Medium-term Swings)
Trade Frequency: Position (Very Low) vs. Swing (Moderate)
Analysis Style: Position (Fundamental + Technical) vs. Swing (Technical)
Screen Time: Position (Low) vs. Swing (Moderate)
Position Trading vs. Day Trading
Day trading is the highest-octane trading style. Positions are opened and closed within the exact same trading day. Day traders absolutely refuse to hold assets overnight, relying heavily on intraday volatility (1-minute to 15-minute charts) and rapid execution.
Position trading is the polar opposite. A positional trader might look at the market only once a week. They are entirely unaffected by the intraday noise that a day trader relies on to make a living.
Holding Period: Position (Weeks to Years) vs. Day (Minutes to Hours)
Market Focus: Position (Market Cycles) vs. Day (Intraday Volatility)
Trade Frequency: Position (Very Low) vs. Day (Extremely High)
Time Commitment: Position (Minimal) vs. Day (Full-time)
Risk Exposure: Position (Overnight/Weekend Gaps) vs. Day (Zero Overnight Risk)
How to Execute a Positional Trade
Successful positional trading requires a highly structured, systematic approach. Here is the standard lifecycle of a positional trade:
Identify the Start of a Trend or Breakout: Traders scan high-timeframe charts for assets breaking out of multi-year resistance levels or forming the early stages of a new macro trend.
Hold Through the Noise (Retracements): Once the position is live, the asset will inevitably pull back. Positional traders do not panic-sell during these normal market retracements; they hold firm as long as the broader structure remains intact.
Ride the Wave: The hardest part of positional trading is doing nothing. The goal is to patiently let the investment compound over time as the trend continues.
Exit on Confirmation: No trend lasts forever. Traders use major chart patterns (like a macro Head and Shoulders) or fundamental shifts (like a change in central bank interest rates) to signal that the trend is exhausted, allowing them to secure their profits.
Top Positional Trading Strategies
Positional traders utilize various strategies depending on the asset class and their preferred analytical tools. Here are the most effective methods:
Trend Following This is the bread-and-butter of positional trading. The strategy is straightforward: identify a strong, established upward or downward trend and jump on board. Traders use tools like long-term Moving Averages (e.g., the 200-day MA) to confirm the trend's validity. As long as the price remains above the moving average, the trade stays open.
Breakout Trading Breakout trading involves entering a market right as it shatters a major, long-standing level of support or resistance. These breakouts often act as the catalyst for massive, multi-month price movements because they signify a permanent shift in market psychology. Positional traders usually wait for confirmation—like a weekly candle close with high volume—before committing capital.
Value-Based Investing Heavily utilized in the stock and commodity markets, this fundamental strategy involves finding assets that are priced below their intrinsic "true value." Traders analyze corporate earnings, supply/demand economics, and industry health to find these discrepancies. They buy the undervalued asset and hold it—sometimes for years—until the broader market realizes its true worth and corrects the price upwards.
Technical Indicator Confirmation To perfectly time these macro entries and exits, positional traders layer long-term technical indicators over their fundamental thesis:
Moving Averages (MA): To dictate the primary trend direction.
Relative Strength Index (RSI): To identify extreme overbought or oversold conditions on a weekly or monthly scale, signaling a potential macro reversal.
MACD: To confirm that the long-term momentum aligns with the trade direction.
The Pros and Cons of Positional Trading
Is positional trading right for you? Weigh the advantages and disadvantages below.
The Benefits
Massive Profit Potential: Catching a multi-year trend can result in life-changing percentage gains that dwarf the returns of short-term scalping.
Low Stress & Time Freedom: Because you aren't fighting intraday volatility, you don't need to stare at charts all day. It is highly suitable for people with full-time jobs.
Cost Efficiency: Fewer trades mean you pay significantly less in broker commissions and spread fees.
The Risks
Overnight and Weekend Exposure: Markets can gap aggressively while you sleep due to unexpected geopolitical news or earnings reports, bypassing your stop-loss.
Locked-Up Capital: Your funds are tied to a single asset for months or years, creating an "opportunity cost" where you cannot deploy that capital elsewhere.
Wide Stop-Losses: Because you are trading high timeframes, your stop-loss must be wide enough to survive normal weekly volatility, meaning your dollar-risk per trade can be larger.
Psychological Strain: It takes immense mental fortitude to watch your portfolio drop 15% in a pullback and still refuse to sell because the "macro trend is intact."
Conclusion
Positional trading is the ultimate test of patience and market conviction. It is a long-term strategy built on capturing the macroeconomic big picture rather than day-to-day noise.
By marrying fundamental valuation with high-timeframe technical analysis, positional traders position themselves to ride massive market waves for weeks, months, or years. While it offers the distinct advantages of lower stress, fewer fees, and the potential for massive returns, it demands strict discipline, wide risk parameters, and the willingness to tie up capital for extended periods.
Ultimately, positional trading is the perfect style for analytical thinkers who prefer a slower, more calculated approach to wealth generation.

BTCUSD - What we need to know | TECHHello Dear Traders! It's Nika... :) :)
After this huge downtrend, we are still in a crypto game...
Many things happening, but we got "well done breakout" downtrend pattern here...
In this situation we may expect the price will test lower side first: 61,62K Price levels.
I recommend at this time before the price is still bouncing NOT enter into the market.
Later I may post another technical about the "Mother Coin". :D
Good luck with your Trading.

AUDCAD promises an 8% >>> profit for next weekAUDCAD is a sat at a key level of resistance however, price is showing on the weekly timeline that it is not ready to sell off yet. We can take advantage of the failure of the sells to long this pair.
Do you have this pair on watch?

The good news: Bitcoin turns bearish 1 year but stays bullish 3Bitcoin goes bearish every four years. The most recent example is 2022. It also happened in 2018. Here is the good news: Bitcoin goes bearish only one year but turns bullish for three years.
After 2022, the previous bear market, Bitcoin was bullish 2023, 2024 and 2025.
After 2018, the bear market year pre-2022, Bitcoin turned bullish in 2019, 2020 and 2021.
Now we are in 2026 and Bitcoin is turning bearish as usual. The good news is that the market turns bullish in 2027, 2028 and 2029.
The bullish bias start Q4 of the same year the bear market bottom shows up. So this same year Bitcoin will recover and grow, the entire market will do so. That's the good news.
Bitcoin hits a new major all-time high and bullish cycle top every four years: 2013, 2017, 2021, 2025 and 2029 next. The two years preceding the peak tend to produce higher highs and higher lows, an uptrend.
As soon as the bear market ends, Bitcoin gets to grow long-term. The altcoins market grows together with Bitcoin.
The last cycle was an unusual and weak one, because Crypto was being attacked from all sides based on political motivations. These players are no longer around, they have been removed. This is to say that the next bullish cycle will be many times stronger compared to the last one. Crypto is fully accepted, welcomed and regulated across the global financial markets.
It will be many times better this time around.
Once the bear market bottom is in, we get growth long-term... That's the good news.
Patience is key.
Namaste.

Nifty 50 | Intraday Price–Time Structure Study(12 July 2023 | WD Gann Methodology)
This idea is a historical, educational study demonstrating how price structure and time alignment, as described in classical WD Gann methodology, can be analysed on an intraday chart.
This post is not a trade call, prediction, or recommendation.
📌 Market Context
On 12 July 2023, Nifty was trading within a short-term consolidation phase after a prior decline.
According to WD Gann principles:
Markets often react near structural price levels
These levels gain importance when price and time balance
Risk is always defined before observing market response
📈 What the Chart Illustrates
The chart highlights:
A reference price zone derived from prior structure
A downside risk boundary used for invalidation
Subsequent price response after interaction with the level
This example is shared to explain how price structure can be studied objectively, without emotional bias.
🧠 Key Learning Points
Gann analysis begins with price structure
Risk must be pre-defined, not adjusted later
Time confirms whether price is accepted or rejected
Studying completed sessions improves execution discipline
The focus here is on process, structure, and risk awareness, not outcome.
⚠ Disclaimer
This idea is shared strictly for educational and analytical purposes only.
It does not constitute financial advice, live trade calls, or investment recommendations.

Nifty 50 | Price–Time Square Structure(22 Nov 2023 | Educational Gann Study)
This idea presents a historical, educational study of how Price–Time Square geometry, as described in classical WD Gann methodology, appeared on the Nifty 50 intraday structure.
The intent of this post is market structure analysis, not prediction or trading advice.
📌 Structural Context
On 22 November 2023, Nifty was trading within a defined intraday range after a prior swing.
According to Gann principles:
Markets often respond to square relationships between price and time
When price units align proportionally with time units, measurable reaction zones may appear
These zones act as reference levels, not guarantees
📈 What the Chart Illustrates
The chart highlights:
A reference base level used for structure measurement
Two price–time proportional zones derived from square calculations
Price movement interacting with these zones during the same session
This example helps demonstrate how price symmetry and time balance can be studied objectively.
🧠 Key Takeaways
Gann analysis focuses on structure, not certainty
Price–Time Squares help define potential reaction areas
Risk control and confirmation remain essential
Studying completed sessions improves future market awareness
The emphasis is on process and discipline, not outcome.
⚠ Disclaimer
This idea is shared strictly for educational and analytical purposes.
It does not constitute financial advice, live calls, or recommendations.

TON USDT.1HTechnical analysis of the TON/USDT pair on the hourly timeframe, using the Smart Money Method (SMC) analysis, indicates that the current trend and upward movement is the strongest scenario.


S&P/ASX 200 (XJO) — Bearish Continuation in Play | Smart Money CS&P/ASX 200 (XJO) — Bearish Continuation in Play | Smart Money Concepts
📉 Bias: Bearish | Timeframe: Daily | Style: ICT/SMC
What's Happening
The ASX 200 just printed a -2.03% rejection candle from the premium zone near 9,008, confirming what the structure has been whispering for weeks — the recent high was a Weak High, and smart money has been distributing into retail longs.
We now have a confirmed Break of Structure (BOS) to the downside, followed by a Change of Character (CHoCH) — the market has shifted from bullish to bearish on the daily timeframe.
Price is currently sitting at 8,708 — right at the equilibrium (50% fib) of the macro swing. This is decision territory.
The Setup
Structure:
✅ Weak High confirmed at 9,008 — made on declining momentum
✅ BOS to the downside — lower low printed
✅ CHoCH confirmed — bullish structure broken
✅ Price rejected from Premium zone into Equilibrium
Projected Path:
I'm looking for a mitigation retest back toward the 8,850–8,900 zone (previous BOS level / order block) before continuation lower. This is the sell zone — not chasing here at equilibrium.
Key Levels
LevelPriceSignificancePremium / Weak High9,008Invalidation zone — if reclaimed, bearish thesis is deadMitigation Block8,850–8,900Optimal entry zone for shortsEquilibrium8,708Current price — 50% fib, decision point0.618 Fib8,662First support — needs to break for continuationDiscount / Swing Low8,383Primary target — strong demand zone1.382 Extension8,103–8,116Extended target — major horizontal support confluenceDeep Discount7,651Extreme scenario — only if macro black swan event
RSI Confirmation
Momentum hasn't even reached oversold territory yet. RSI is sitting at 58/42 — there is significant room for this move to develop before any mean-reversion pressure kicks in. When structure and momentum align like this, the probability tips heavily in favor of continuation.
What I'm Watching
Retest of 8,850–8,900 — this is where I want to see price wick into and reject. If we get a bearish engulfing or shooting star on the daily in this zone, that's the trigger.
RBA Rate Decision — this is the macro wildcard. A hold or hawkish tone accelerates the move lower. A surprise cut could invalidate and squeeze shorts.
Daily close below 8,662 (0.618) — this confirms the sell-off has legs and opens 8,383 as the next magnet.
The Plan
Entry Zone: 8,850–8,900 (mitigation retest)
Confirmation: Bearish price action on daily (engulfing, shooting star, BOS on lower TF)
Target 1: 8,383 (discount zone / swing low)
Target 2: 8,103–8,116 (1.382 fib extension + horizontal support)
Invalidation: Daily close above 9,008 (reclaim of weak high)
Risk-to-reward on this setup from the mitigation zone to T1 is roughly 3:1. To T2, it stretches to 5:1+.
Macro Context
The ASX 200 is heavily weighted toward financials (~36%) and mining. Both sectors are facing headwinds:
Banks — NIM compression concerns as the rate cycle peaks
Miners — China demand uncertainty continues to weigh on iron ore sentiment
Global risk-off flows — if US equity weakness persists, ASX follows
The index composition means when this thing sells off, the selling is concentrated and fast.
Summary
Smart money distributed at the premium zone. The BOS and CHoCH are confirmed. We're at equilibrium — the market is offering one more opportunity to enter on a retest before the discount zone becomes the target. Structure, momentum, and macro all align bearish.
Patience on the entry. Let price come to you.
This analysis is for educational purposes only. Not financial advice. Always manage your risk.
🏷️ Tags: #ASX200 #XJO #SmartMoneyConcepts #ICT #BearishSetup #TechnicalAnalysis #AustralianStocks #SwingTrade
📊 Chart by WaverVanir International LLC | VolanX Trading Systems
🔗 Follow for more institutional-grade analysis on ASX & global markets

USDCAD - A Deeper Anal ysisThis time, I go deeper, much deeper into USDCAD. I've added some crude oil to make things a bit more comfortable and easy to digest.
I hope you find it enjoyable!
- R2F Trading

Repeating FractalIn times of low hopium, hopium must be delivered.
Have been following this for the better part of a year.
Could be right could be wrong. I dunno, but follow the circles, see the pattern and wait for the future while living in the present.

Week 7 Summary | 2 Trades, 0W 2L, -2RTwo losses this week. Nothing worked.
Took two setups that met my criteria. Both got stopped out. Down -2R for the week.
Some weeks you win. Some weeks you lose. That's how it goes.
The goal isn't to win every week. The goal is to stay consistent over time. Follow the system, manage risk properly, and let the math work itself out over months.
One winning week at 1:4 covers two losing weeks like this and still leaves profit. That's the game.
Process didn't change. Criteria stayed the same. Risk management did its job - losses kept at -1R each, no blowups.
Moving into week 8 with the same approach.
Stats:
Trades: 2
Wins: 0 | Losses: 2
Net: -2R

buy america whiles the media advertise a sellthe dollar is broadly weak, seasonally stocks rally at this time of year from december into may....
most stocks have already been discounted
leaders like cisco,tesla,Amgen have already rocketed up......
but a mazon is still in a discount zone buy at $200 cash out at $250

XAGUSDHello Traders! 👋
What are your thoughts on SILVER?
Silver experienced a sharp decline after a strong rally and printing a local high, correcting nearly 50% from its peak. Upon reaching the highlighted support zone, price showed a bullish reaction, indicating the presence of buyers and the validity of this demand area.
At this stage, we expect price to spend some time moving sideways and ranging within this zone before attempting a bullish corrective move toward the specified upside levels.
As long as price remains below the key resistance areas, any upside move should be considered corrective rather than trend-reversing.
Don’t forget to like and share your thoughts in the comments! ❤️

USDCAD SHORTPrice is preparing for monthly shorts as we can see liquidity was swept on friday. I am bracing myself to catch these shorts for the remainder of the month not unless price action changes.

BTC Liquidity Probe and then Liquidity Harvest laterIn the above chart, I am trying to show that the selling pressure that drove price sharply to $60,000 was engineered by market makers to test the depth of liquidity and grab some liquidity in the process. The fact that after buy orders were triggered at the support zone of $60,000 but there was no immediate follow through but a choppy and sideways price action suggests that 'they' have unfinished business below $60k. The price action we are seeing is the next step of their manipulation, it's designed to induce more buyers who will be sacrificed soon with panic selling. We need to understand that Bitcoin is getting scarce and market makers must build inventory and liquidity and this is how they are engineering it step by step.
The second liquidity sweep where the real liquidity sits around $48k to $54k is where clustered stop loss orders will be triggered along with panic sellers and margin liquidations. This is the target area for their intermediate accumulation, from about this level will there be a healthy bounce to about $80k.
Guys this is the liquidity atlas map I am looking at currently.
I hope this weekends analysis is helpful to your own due diligence.
Thank you as always for reading and listening to my publications.
Cheers my fellow traders.

Gold (XAUUSD) - 9 Feb | Watching POI Zone 4821-4808Gold (XAUUSD) Analysis – 9 February
Hello Disciplined Traders,
Welcome to the Chart Is Mirror Community 👋
Market Context
• Gold experienced a strong pullback after reaching the new all-time high at 5600 on 26 January , mitigating a major unmitigated level.
• Price found strong support at the 4402 level , followed by a bullish M15 structure shift and break of structure , confirming that the H4 pullback has ended and the broader uptrend has resumed.
• Last Friday, the market revisited the 4672–4656 demand zone , respected it, and continued the bullish move.
Key Observations
• Gold is currently trading around 4965 . From this area, a healthy pullback is expected before continuation.
• Our POI for the next long setup lies at the 4821.468–4808.262 demand zone .
• If price revisits this zone and shows LTF bullish confirmation , we will plan our long setup accordingly.
Execution Plan
• Wait for price to pull back into 4821.468–4808.262 .
• Execute long trades only with clear LTF confirmation .
• From this zone, the next upside target is the 5197 level .
• Market volatility remains high — manage risk carefully .
Let the pullback return price to value — then let confirmation invite execution.
📘 Shared by @ChartIsMirror

IS $ALPA3 the new Jaguar?BMFBOVESPA:ALPA3 , a market-share leader in Brazil, is facing rising brand and sentiment risk following a controversial TV advertising campaign that triggered a growing online backlash. While the immediate financial impact is limited, viral consumer boycotts typically act with a lag, and the effect is likely to materialize over the next few months through softer demand and deteriorating sentiment.
From a technical standpoint, the stock remains in a long-term downtrend initiated in August 2021. Price action suggests a high probability of a rejection below the 50-day moving average, which would reinforce bearish momentum and signal continuation of the prevailing trend.
Thesis:
Negative sentiment acts as a medium-term catalyst
Lagged impact on sales and expectations
Price likely to remain below the 50-DMA
Trend continuation favors downside positioning
Bias: Bearish
Strategy: Sell rallies below the 50-day moving average / trend-following short
Risk: Rapid sentiment reversal or strong earnings surprise

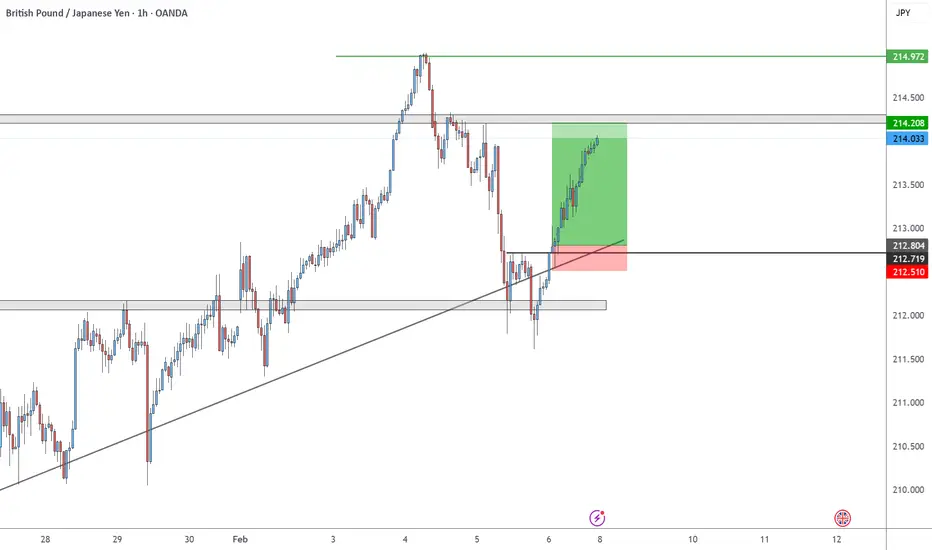
GBPJPY ON THE RISE After respecting all technical structures and a strong bullish candlestick formation on the 4 hour time frame, GBPJPY is most likely to revisit the 214.972 level. A conversative take profit will be achieved on market open hopefully💵🏆
BITCOIN TO 58K!!!After Bitcoin broke April 2025 support, It made a rally and gave a strong bearish reversal candlestick pattern on the 4 hour time frame which creates more bearish pressure in the future

NewMont CorpLevels found using TrenVantage Indicator. This company will closly follow gold. I think new Highs are in play after that flush we saw this past week
