Copper (HG1) Market Watch Simple & Clear!Copper’s looking strong right now 💪 and it might be setting up for a big move.
Here’s the key level I’m watching:
📈 If copper breaks and closes above 5.41, that could open the door for a run all the way up to 7.13.
That’s a big potential move but only if we hold strong above that breakout level.
💡 Right now, it’s all about confirmation ; a clean close above 5.41 could shift the trend in a big way.
Want to see the chart setup I’m using and how I’m planning around that 5.41 breakout?
💬 DM me “COPPER” and I’ll send you the exact breakdown directly. 🚀
Mindbloome Exchange
Trade Smarter Live Better
Beyond Technical Analysis

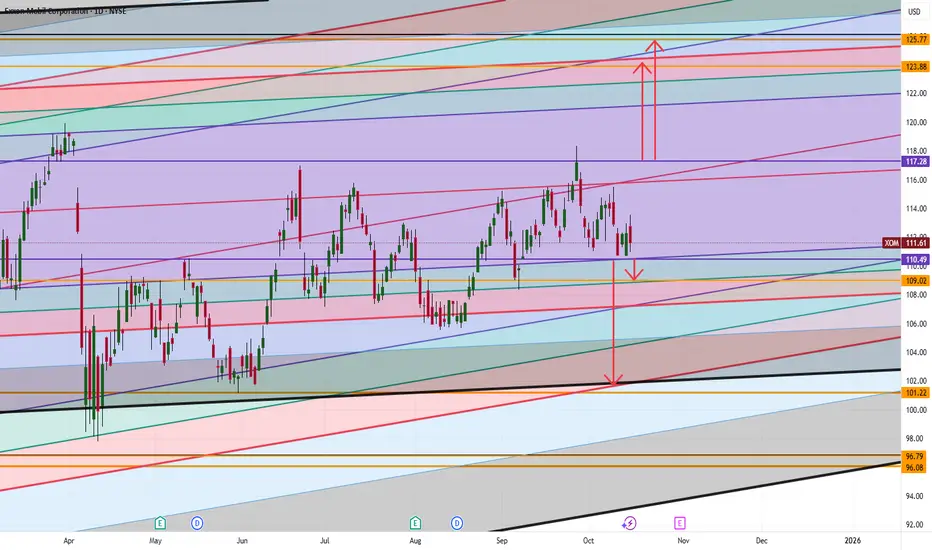
Exxon Mobil (XOM) Simple Market Breakdown!XOM’s sitting at a key level right now; momentum could go either way depending on the next breakout ⚡
Here’s what I’m watching:
📈 If we break above 117.28, that could open the door for a push up toward 123–125; that’s our next major target zone.
📉 But if we drop below 110.49, then we could see a move down toward 109, and possibly even 101 if selling pressure continues.
💡 So, short-term watch those breakout and breakdown levels closely.
Long-term ; whichever side breaks first will likely set the direction for the next big move.
Want to see how I’m tracking these levels and the signals I’m using to confirm the breakout?
💬 DM me “XOM” and I’ll share my private chart breakdown directly.
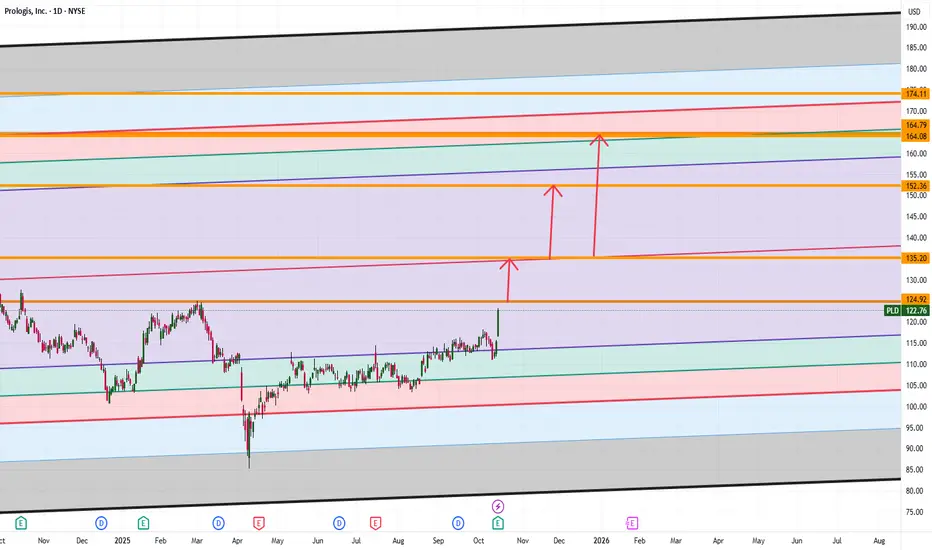
Prologis (PLD) Simple Market Breakdown!PLD’s been showing solid momentum lately 📈 and here’s the key zone I’m watching:
✅ If we break and hold above 124.92, the next target zone is around 135.20.
⚠️ At that level, we could see some correction or sideways movement (a bit of rest before the next move).
🚀 But if PLD breaks above 135.20 and holds, that could set up the next big leg toward 152, and possibly 164.
💡 So short-term; watch for a small pause. Long-term; momentum still looks strong if we keep closing higher.
Want to see how I’m mapping out the next levels and what signals I’m tracking for confirmation?
💬 DM me “PLD” and I’ll send you the full chart breakdown directly.
Mindbloome Exchange
Trader Smarter Live Better
Netflix Going to 82 or lower? Here is a quick analysis of the market of we are currently seeing, if you need further help and are struggling send me a DM more than happy to answer any questions you may have
Trade Smarter Live Better
Kris

Can SILVER get to $170? We have analyzed Silver and currently if we can break the high at $88 then we will be on a short bull run to $105.
Now we could expect a mild correction here, however if we can consolidate here and close above a nice run to 16-170 range makes sense
Trader Smarter, Follow The Trend
Mindbloome Exchange Team

GJ Sell Swing Position First post back since 2022 had step away due to life, but we back and better. open to all criticism, if theres anything I missed or should look into lmk. Not married to any bias, will adapt with the markets.
I currently have a sell position at 214.500. I will be looking to target lows of 207-206 price points. looking to play this out over the course of the weeks - months
What support this bias?
BOE looking to cut rates this year by monitoring various economic data such as;
- Inflation of course, is currently at 3.75% with BOE needing inflation be closer to their 2% target.
- Consumer Price Index
- Wage growth
- Services inflation
- Labor market / unemployment (public and private sector)
Depending on the course of the year and along with current economic standing we can see price range and retest 215's multiple times before we break to the downside.
Interest rate differential between the pound and yen can cause GJ to the downside.
BOJ in 30+ years has started increase interest rates gradually since march 2024. we can see further rate hikes with BOJ which depends on many factors such a;
- Solid wage growth
- Household spending
- Entrenched Inflation (CPI)
- A weak yen causes raising costs on imported goods
- Policy Divergence; many global central banks have been in a rate cut cycle
*BOJ IR at 0.75% it still considered to be accommodative*

WaverVanir International LLC — QQQ Technical & Macro Brief🔺 WaverVanir International LLC — QQQ Technical & Macro Brief
February 7, 2026 | 15-Min Structure Analysis
STRUCTURE: Bearish impulse in play. Wave (4) corrective bounce approaching exhaustion.
QQQ sitting at $609.55 — dead at equilibrium inside a descending channel. Elliott count shows a clean (1)-(2)-(3)-(4) sequence with wave (5) still unresolved.
Wave (3) found support at the 1.0 fib extension ($593), confirming the impulsive structure. Current wave (4) retraced into the 0.382–0.447 zone ($607–$612.50) — textbook corrective territory. RSI printing 65 on a corrective bounce = overbought for a counter-trend move.
Key levels:
📍 Invalidation: $617.37 (0.309 fib / CHoCH zone) — above this, wave count resets
📍 Equilibrium resistance: $609–$612 (current rejection zone)
📍 Wave (5) targets: $571–$565 (1.618–1.786 extensions)
📍 Aggressive target: $562 (1.854 extension, lower channel boundary convergence)
SMC Confluence: Multiple BOS confirmations through the descent. Weak low at $597–$599 remains unswept — liquidity sitting below. Wave (5) should sweep that weak low en route to the 1.618 extension.
MACRO & CATALYST DENSITY — Next Week is Loaded:
⚡ Feb 10 — December retail sales + factory orders. Earnings: KO, SPOT, F, LYFT
⚡ Feb 11 — January NFP (critical). Earnings: SHOP, CSCO, APP (AppLovin)
⚡ Feb 12 — Existing home sales. Earnings: AMAT, ANET, ABNB, COIN
⚡ Feb 13 — January CPI + Core CPI (the big one)
Macro context:
Fed holding at 3.50–3.75%. Market pricing 97% chance of no cut through March. Core CPI last print 2.6% YoY — any uptick kills the June cut narrative and sends tech lower. NFP on Wednesday is the first test — labor market showing deterioration signals (layoffs surged in Jan, JOLTS weakened). Weak jobs + hot CPI = stagflation fear trade.
SPX broke below both 50-day and 100-day MAs this week for the first time since the April 2025 tariff correction. VIX collapsed 18% on Friday's relief bounce — but Citadel's institutional flow data shows clients are using near-dated options to hedge into earnings. Tactical, not conviction.
Retail options volumes hit all-time records in January (Citadel Securities data). Retail call/put ratio skewed bullish 39 of last 40 weeks. That's crowded positioning. When retail is max long and macro catalysts are binary — unwind risk is real.
THESIS:
Wave (4) is a counter-trend relief bounce into equilibrium. The structural bias remains bearish inside the descending channel. CPI on Feb 13 is the macro catalyst that likely triggers the wave (5) leg.
If CPI comes hot: Wave (5) accelerates toward $565–$571. Descending channel holds.
If CPI comes cool: Channel break possible — but needs to clear $617 to invalidate the count.
Position accordingly. This is a catalyst-dense week with binary outcomes.
WaverVanir International LLC | VolanX Protocol Research
Institutional Flow × ML Signal Intelligence

BTC SHORTI will be looking for lower prices on BTC seen as we are still bearish and price has respected our daily SiBi, I will need the 4 hour to trade higher sweep out the buy side liquidity of the range we are in and then trade lower from there.

XRP now oversold —weekly RSI · Bitcoin's halving & 4 years cycleXRP's weekly RSI just hit the lowest level since June 2022, the month of the previous bear market bottom. This means that we are looking at market conditions similar to the end of the last bear market.
Now, the reading is the lowest since then but not the lowest nor the same, it is a bit higher.
This development gives me a bullish bias but I am not stupid. This bullishness is based only on the short-term.
As you can see, XRPUSDT is set to close five consecutive weeks red with the current week having a long lower shadow. This call for some relief.
After this relief then the market moves lower again.
Whenever the market produces a bearish cycle, it never enters the next cycle in flash, suddenly. Instead, the market goes sideways for several months at bottom prices before the start of the next trend.
Let's say XRP goes bullish for several weeks and that's it. The relief. Then it comes crashing back down. The next crash produces really extreme oversold conditions and then the market settles at bottom prices; still, no strong bullish breakout.
At the bottom we get sideways with some fluctuations. After a long while, long enough for people to get bored and many weak hands to fold, then a strong bullish breakout shows up. This move signals the start of the next market phase which tends to last a long time.
Bitcoin's halving and 4 years cycle explained
Many people have been saying that Bitcoin's four years cycle is changing or that it will change in the future—simply impossible.
The four years cycle cannot change because it has been programmed into the code. Every four years we get "the halving." And this is what causes Bitcoin's classic bullish and bearish cycles.
Before the halving, Bitcoin starts to grow really strong in anticipation of the event. This puts pressure on the entire Cryptocurrency market to grow.
Once the event happens, Bitcoin continues growing until all momentum is exhausted. The year after the halving all momentum is gone and that's the end.
The market starts to price-in the halving one year in advance. Grows before and during the halving. The momentum lasts until one year after and then we get the bear market.
That's why we get only 1 year of bearish action vs 3 years of bullish action.
Namaste.

2063.38 ~ 2261.70: Support zone forming
Hello, traders!
Follow us to get the latest information quickly.
Have a great day!
-------------------------------------
(ETHUSDT 1D chart)
The current position can be viewed from two perspectives.
First, we need to consider whether the price can rise after finding support in the 1597.76 ~ 1879.61 range.
This is because, as seen in the chart above (), if it declines, it will enter a range with no end in sight.
Therefore, to maintain the uptrend, the price must remain above the 1597.76 ~ 1879.61 range.
-
Second, we need to consider whether the price can rise after finding support in the currently forming DOM(-60) and HA-Low indicator ranges.
The range we are trying to create, i.e., the DOM(-60) ~ HA-Low range, is the 2063.38 ~ 2261.70 range.
If support is found in this range, it would be a good time to buy.
This is because, as seen in the chart above, the upward trend can only continue if the price rises above the 2419.83 to 2706.15 level.
-
When a new candlestick is formed, we need to check whether the BSSC indicator rises above the 0 level.
This is because a rise above the 0 level indicates that buying pressure is dominant.
Therefore, the price is likely to rise.
However, as mentioned earlier, the key question is whether buying pressure can gain enough momentum to break above the 2419.83 to 2706.15 level.
To determine this, we need to check whether the On-Bottom Volume (OBV) indicator rises above the High Line and remains there.
Currently, the OBV indicator is showing signs of re-entering the Low Line, so we need to see if the price maintains the 2063.38 to 2261.70 range and rises toward the High Line.
Therefore, to break above the 2419.83 ~ 2706.15 range and continue the uptrend, the StochRSI, BSSC, and OBV indicators must show upward trends.
If possible,
1. The StochRSI indicator should not enter the overbought zone.
2. The BSSC indicator should remain above zero.
3. The OBV indicator should maintain prices above the High Line.
A rise in the OBV indicator above the High Line indicates a high probability of a decline below the High Line in the near future.
In other words, a re-crossing of the High Line indicates a decline from the high range.
If the StochRSI indicator also rises to the overbought zone and then declines, this also indicates a decline from the high range. Therefore, it is recommended to monitor the movements of the StochRSI indicator alongside the OBV indicator.
The BSSC indicator is a comprehensive evaluation of the MFI, AD Line, and Williams %R indicators.
Therefore, like the StochRSI and OBV indicators, it is a leading indicator, so I believe it can be helpful for intuitively identifying trends.
Leading indicators aren't always ideal.
This is because real-time indicator movements can make chart interpretation more difficult.
In other words, during periods of volatility, real-time indicator movements can lead to false positives, misinterpreting price movements.
Therefore, when referencing indicators, it's important to check for support and resistance points or support within a range.
In conclusion, the most important factor is how influential support and resistance points are drawn on the 1M, 1W, and 1D charts.
The success of a trade depends on considering the characteristics of the support and resistance points, assessing whether support is present near them, and developing a trading strategy accordingly.
The indicators used in this chart are StochRSI, OBV, and MACD as basic indicators, with modified indicators like HA-Low, HA-High, DOM(-60), and DOM(60).
The key indicators here are the HA-Low and HA-High, which initiate trades.
By combining the HA-Low and HA-High indicators with the DOM(-60) and DOM(60) indicators, you can create a basic trading strategy.
This basic trading strategy involves buying in the DOM(-60) to HA-Low range and selling in the HA-High to DOM(60) range.
However, if the HA-High to DOM(60) range rises, a stepwise upward trend is likely, while if the DOM(-60) to HA-Low range falls, a stepwise downward trend is likely.
Therefore, trading should be done in segmented phases.
Basically, the best time to buy is when support is found in the DOM(-60) ~ HA-Low range.
However, if support is found in the HA-High ~ DOM(60) range and the price rises, a step-like upward trend is likely. While buying in this range is possible, it carries a higher risk. It's best to day trade and switch to short-term trading when the price begins to rise above the DOM(60) indicator.
-
I believe the timeframe for confirming support in the coin market is shorter than in the stock market.
This is because the coin market offers significantly more trading time.
Therefore, confirming support in the coin market requires a period of one to three days.
Confirming support doesn't necessarily mean an upward trend.
This is because the price may move sideways as it enters a sideways trading range.
To determine whether the current price is in a sideways range, you need to examine whether it falls within the Low Line and High Line of the On-By-Value (OBV) indicator.
You can also determine whether the sideways range is rising or falling by examining whether the channel formed by the Low Line and High Line is a rising or falling channel.
-
Before asking whether the price will rise or fall, I believe it's best to first examine the movements of the indicators provided on the chart to determine the current situation.
Ultimately, you can only make trades based on your own judgment.
ETH's next volatility period is around March 2nd, while BTC's next volatility period is around February 17th. Therefore, we need to examine the direction in which the price deviates from the 1879.61 to 2419.83 range by February 17th.
-
Thank you for reading to the end. We wish you a successful transaction.
--------------------------------------------------

Japan 225 Index🔑 Key Levels
Resistance (Short Zone): Channel top / current highs
Target: 54,000
Invalidation: Daily close above channel resistance
📌 Trade Logic
Short: Favorable risk-reward from channel resistance → target 54,000
Buy: Only valid after pullback and strong bullish reaction at support
If price breaks and holds above the channel: Shorts invalidated → trend continuation
⚠️ Counter-trend short — manage risk strictly.
If you want, I can:
Make it even shorter
Rewrite it in perfect TradingView English
Add exact entry / SL / TP

BTC longs from breakerYearly gap + retracement into discount. Now looking to accumulate longs at the breaker. Great position trade in my opinion! Let’s let it rock

Bitcoin monthly —Support found at EMA55There are many things to consider. The market represents a natural force, a force of nature. It is a collective mind, human action. It represents one aspect of our collective mind. When we are thinking, being and feeling in a certain way, this is reflected in the market, that being neutral, bearish or bullish.
The market never stays the same, just as nothing stays the same in our bodies, minds and world. Everything is always in a constant flux. Everything is always changing.
The most basic part of this phenomena is the intrinsic duality of this world. It doesn't matter where you live, you can never miss the fact that the day changes between night and day. This basic reality is reflected as bearish and bullish in our market.
When the day comes, we know night is always lurking right around the corner. When the market is bearish, we know that bullish comes next.
Bitcoin found support on the monthly timeframe right at EMA55, trading five consecutive months red. A very strong bearish impulse. This is the night, now comes day.
EMA55 is a very strong support. So now we get some sort of reversal, some sort of relief, some sort of bullish action. The night makes way for the appearance of the sun. The morning has come. It is a bright day. We are going up.
Namaste.

a company never loseone of the best company in the market TADWUL it's the market generator
the trad is clear in chart, entry is up to you.

NQ weekly walkthrough 08.02.2026, SaturdayCME_MINI:NQ1!
Covered NQ plays throughout this week. Go ahead and check it out

SP500 — Global Outlook | MTF 1M → 1W → 1DS&P500 — Global Outlook | MTF 1M → 1W → 1D
Higher-Timeframe Weakness at ATH • Correction Bias
Overview
SPX is showing weakness at the all-time high (ATH) . Multiple attempts to hold above ATH have failed, and the higher-timeframe structure suggests the market may be transitioning from expansion into a corrective phase .
The current bias remains: a correction is needed before any sustainable continuation higher .
Higher-Timeframe Context (1M → 1W)
Monthly (1M):
Weakness at ATH: bullish monthly imbalance was tested in Nov 2025 , but there was no body close above ATH
In Dec liquidity was swept; in Jan 2026 another sweep / attempt to hold above ATH failed again
For further upside, the market likely needs a reset into discount
Key untested monthly zone (demand focus):
4,800 – 6,200 (broad 1M untested zone)
Weekly (1W):
Multiple highs formed in January → buyer weakness
No clear untested support inside the current range (no clean OF / OB support)
Logical next step: liquidity sweep of the weekly range low
Nearest weekly target:
6,525 (weekly low sweep)
Execution Context (1D)
Three tight, nearby daily ranges → diminishing upside impulse
RSI divergence: price pushes to new extremes / sweeps liquidity, while RSI fails to print new extremes
This divergence appears during attempts to close above ATH → adds weight to the correction thesis
Key Demand Zones (reaction areas):
6,000 – 6,100 (upper demand pocket / first reaction area)
5,100 – 5,500 (lower demand zone)
4,800 – 6,200 (monthly broad untested zone)
Base Scenario
Correction / short bias toward demand zones
First checkpoint: 6,525 (watch for reaction)
If no reaction → continuation into 6,000–6,100 , then potentially 5,100–5,500
After reaching demand: reassess the character of the move for either reversal signs or continuation
❗ Invalidation
Sustained acceptance / body closes above ATH that hold — invalidates the correction thesis and shifts the bias back to continuation
Your Thoughts?
If this perspective resonates with you, share your view in the comments:
LONG continuation or SHORT correction next? 👇
Not financial advice. Educational market structure analysis.

GER40 — Global Outlook | MTF 1M → 1W → 1DGER40 — Global Outlook | MTF 1M → 1W → 1D
Higher-timeframe correction bias | Counter-trend move into resistance
Overview
GER40 currently looks like a market that failed to hold above ATH and is shifting into a higher-timeframe corrective phase .
The liquidity sweep, the strong monthly upper wick, the weekly BPR zone, and a bearish RSI divergence all support the idea of a pullback into HTF demand.
Any upside at this stage is treated as corrective , not as a confirmed trend continuation.
Higher-Timeframe Context (1M → 1W)
Monthly (1M)
• In November 2025 , price tested the monthly imbalance and reacted
• In January 2026 , the market failed to accept above ATH
• It swept monthly fractal liquidity and printed a long upper wick (now being retested)
• This behavior signals buyer weakness and increases the probability of a deeper rebalance into HTF zones
Monthly focus
• Monthly imbalance rebalance area: 22,900
• Nearest untested HTF zone of interest: 18,800 – 22,700
Weekly (1W)
• January: inversion of the bullish weekly imbalance → formation of a BPR zone
• February: price tested the BPR and delivered the first reaction
• The BPR aligns with the monthly upper wick → resistance is confirmed by two timeframes
• Additional confirmation: bearish RSI divergence (price prints new extremes while RSI fails to confirm) → increases the odds of a corrective move
Weekly untested zone of interest
• 18,800 – 21,500 (refines and strengthens the monthly area)
Execution Context (1D)
• On the daily chart, price attempted a range breakout, but failed to hold on the retest of the range high
• We’re now consolidating near the upper boundary — often a setup for a move back through the range
• A logical structural target is the opposite side of the range , which aligns with the 1W/1M narrative
Nearest untested daily orderflow zone
• 20,500 – 21,500
❗ Invalidation
The correction/short bias weakens if the market achieves clean acceptance above ATH (strong closes and sustained holding on higher timeframes).
Until that happens, upside is treated as corrective .
Thesis Summary
• 1M: weakness after a failed ATH acceptance + strong upper wick
• 1W: BPR resistance + bearish RSI divergence
• 1D: failed range breakout → higher probability of rotation into HTF demand
• Base case: corrective move toward the nearest demand zones
Your Thoughts?
What’s your bias from here — long or short on GER40?
If you found this useful, drop a like and share your view in the comments.
Not financial advice. Educational market structure analysis.

Poor Again” Signal Reloaded? CZ’s Old Tweet, New Cycle & $250k “Poor Again” Signal Reloaded? CZ’s Old Tweet, New Cycle & a $250K Bitcoin Theory ..
When CZ says “Poor again,” the market remembers.
This isn’t hype — it’s pattern recognition.
📅 January 25, 2022
CZ tweeted “Poor again” while BTC traded around $35.7K–$37.5K. Price dipped first, then staged a short rally… before collapsing hard and eventually launching one of the strongest bull runs in history.
📅 February 5, 2026
CZ repeats the same tweet, clearly referencing 2022. BTC had just tapped a local low near $60K.
Last cycle roadmap after the tweet:
➡️ +45% rally in ~2 months
➡️ -67% deep correction over months
➡️ +740% multi-year bull run to $126K
If the fractal rhymes again:
🔹 Phase 1 (next ~2 months): Relief rally to $87K–$90K
🔹 Phase 2 (late 2026): Heavy correction to $27K–$35K — a possible long-term accumulation zone
🔹 Phase 3 (2029): Expansion toward $250K
⚠️ This is fractal analysis, not financial advice.
Markets don’t copy-paste, but history often rhymes.
CZ’s timing has been interesting before — worth keeping these levels on the radar.
Always DYOR. 📊
BINANCE:BTCUSDT

Gold ¡IMPORTANT! Update For February and MarchFollow me here on TW for my regular critical updates on crypto (BTC, ETH, SOL, MSTR) and metals (GLD, SL, PL) based on Martin Armstrong's Socrates.
Look in my TW Ideas for posts of each market individually.
TIMING ARRAYS:
Gold: it's suggesting a 2-week move up but not necessarily very strong.
Silver and Platinum: have a STRONG targets this coming week and they will need to have a CYCLE INVERSION push higher in order to continue pushing higher into the week of the 16th.
Platinum: it's suggesting a correction into March.
Gold, Silver and Platinum are showing BEARISH STOCHASTICS on the Monthly and Weekly. On the Daily they're showing an attempt to exit the BEARISH trend into a BULLISH. So, CAUTION IS WARRANTED.
Gold & Platinum: are calling for LOWs on the Daily and Weekly and a pattern indicative that the LOW may have formed.
Gold: it's showing serious strength to exit this CRASH MODE now to lead the charge higher suggesting that it is Entering Breakout Mode on the Quarterly level .
I suspect that this scenario calls for a consolidation and cooling off of the PANIC RALLY of the last 2 months. However, remember that Silver has a PANIC CYCLE in February suggesting it could panic rally to test the $121 again but not necessarily a RALLY to new ATH just yet.
¡Good luck! 🙏🏻

Silver ¡IMPORTANT! Update For February and MarchFollow me here on TW for my regular critical updates on crypto (BTC, ETH, SOL, MSTR) and metals (GLD, SL, PL) based on Martin Armstrong's Socrates.
Look in my TW Ideas for posts of each market individually.
TIMING ARRAYS:
Gold: it's suggesting a 2-week move up but not necessarily very strong.
Silver and Platinum: have a STRONG targets this coming week and they will need to have a CYCLE INVERSION push higher in order to continue pushing higher into the week of the 16th.
Platinum: it's suggesting a correction into March.
Gold, Silver and Platinum are showing BEARISH STOCHASTICS on the Monthly and Weekly. On the Daily they're showing an attempt to exit the BEARISH trend into a BULLISH. So, CAUTION IS WARRANTED.
Gold & Platinum: are calling for LOWs on the Daily and Weekly and a pattern indicative that the LOW may have formed.
Gold: it's showing serious strength to exit this CRASH MODE now to lead the charge higher suggesting that it is Entering Breakout Mode on the Quarterly level .
I suspect that this scenario calls for a consolidation and cooling off of the PANIC RALLY of the last 2 months. However, remember that Silver has a PANIC CYCLE in February suggesting it could panic rally to test the $121 again but not necessarily a RALLY to new ATH just yet.
¡Good luck! 🙏🏻

Platinum ¡IMPORTANT! Update For February and MarchFollow me here on TW for my regular critical updates on crypto (BTC, ETH, SOL, MSTR) and metals (GLD, SL, PL) based on Martin Armstrong's Socrates.
Look in my TW Ideas for posts of each market individually.
TIMING ARRAYS:
Gold: it's suggesting a 2-week move up but not necessarily very strong.
Silver and Platinum: have a STRONG targets this coming week and they will need to have a CYCLE INVERSION push higher in order to continue pushing higher into the week of the 16th.
Platinum: it's suggesting a correction into March.
Gold, Silver and Platinum are showing BEARISH STOCHASTICS on the Monthly and Weekly. On the Daily they're showing an attempt to exit the BEARISH trend into a BULLISH. So, CAUTION IS WARRANTED.
Gold & Platinum: are calling for LOWs on the Daily and Weekly and a pattern indicative that the LOW may have formed.
Gold: it's showing serious strength to exit this CRASH MODE now to lead the charge higher suggesting that it is Entering Breakout Mode on the Quarterly level .
I suspect that this scenario calls for a consolidation and cooling off of the PANIC RALLY of the last 2 months. However, remember that Silver has a PANIC CYCLE in February suggesting it could panic rally to test the $121 again but not necessarily a RALLY to new ATH just yet.
¡Good luck! 🙏🏻

Bitcoin the END
Why I Believe Bitcoin Will Die
From my point of view, Bitcoin is heading toward an eventual collapse because the fundamentals simply don’t support long-term survival. First, the technology itself is outdated. It was revolutionary in 2009, but today it is slow, inefficient, and expensive compared to newer blockchain systems. Other networks offer faster transactions, lower fees, smart contracts, and real utility, while Bitcoin remains mostly a speculative asset with limited real-world use.
Second, Bitcoin relies heavily on hype and investor belief rather than intrinsic value. Its price swings wildly based on sentiment, and without continuous inflows of new money, the entire system struggles to stay afloat. To me, that looks more like a speculative bubble than a sustainable currency.
Third, governments and regulators are becoming more aggressive. As countries develop central bank digital currencies and crack down on unregulated crypto, Bitcoin’s role diminishes even further. It’s hard to imagine major economies allowing a borderless, uncontrollable currency to dominate their financial systems.
Finally, Bitcoin mining is extremely energy-intensive. As climate regulations tighten and environmental awareness grows, the pressure on proof-of-work systems will only increase. Newer technologies are greener and more scalable.
For all these reasons, I believe Bitcoin is gradually losing its relevance and will eventually fade out!

Mr. Pumps thoughts on US30 as the risk on and risk off tradeI talk about the us30 being bullish only, big tech, and the usd.
