Will price reach $3 704 this month? TVC:GOLD price has recently formed a descending Triangle on the H4 time frame and price overall is now bearish. And once we break the $3890 level it's high probability that price will reach the $3 704 zone. But the main question is when? Feel free drop your ideas on price action, on the comment session below.
Beyond Technical Analysis

Calm before the StormGold remains trapped in a tight consolidation around the psychological 4,000 level as markets prepare for this week’s ADP Employment Report and other private U.S. data that will still be released despite the ongoing government shutdown.
Price action is perfectly balanced — neither bulls nor bears are in full control — but structure still leans slightly bearish while the Federal Reserve’s tone remains hawkish and the dollar stays firm.
Technical Outlook
Gold continues to oscillate between 3,995 and 4,015, with repeated rejections at both boundaries.
Buyers keep defending the 4,000 area, while sellers continue to cap upside moves near 4,015–4,020.
A daily close above 4,015 could trigger a short-term breakout toward 4,035–4,045, while a sustained move below 3,995 would expose 3,985–3,965 and possibly 3,950.
Momentum remains neutral and volume light, signaling that gold is coiling for a 25–30 USD move once the range breaks.
Fundamental Context
Even with the U.S. government shutdown, key private indicators like the ADP Employment Report and the University of Michigan Sentiment Index will be published this week.
The ADP data on Wednesday (8:15 ET) will likely set the tone:
• A strong print above +100K could reinforce the Fed’s cautious stance, strengthen the USD, and weigh on gold.
• A weak or negative print could revive safe-haven demand and push gold toward 4,050–4,080.
Until then, markets remain quiet and balanced, waiting for a catalyst.
Powell and Fed Dynamics
No official Powell speech appears on the Fed’s agenda this week, but his latest comments were clearly hawkish-pragmatic — signaling patience and data dependence after recent rate cuts.
Any unexpected remarks reaffirming a “higher for longer” stance would strengthen yields and the dollar, adding downward pressure on gold.
Weekly Focus
Wednesday: ADP Employment Report (Private Sector Jobs)
Friday: University of Michigan Sentiment (Preliminary)
Saturday, November 8: 40 days of government shutdown — a potential psychological risk event if the political stalemate continues.
My View
Gold is holding the line at 4,000 — not breaking, not bouncing.
The market is waiting for a catalyst, and this week’s U.S. employment data might be it.
Until then, I’m watching 4,015 for a breakout and 3,995 for a breakdown.
Expect volatility to rise sharply midweek as traders reposition for the next macro leg.
“Gold is quiet today, but quiet markets rarely stay quiet for long.”
#Gold #XAUUSD #TradingView #TechnicalAnalysis #Forex #Commodities #ADP #Fed #Powell #GovernmentShutdown

Rebound Setup: Limit-Buy nach Short-Term Exhaustion (EFA)Hi Traders
This is a systematic mean-reversion setup I use across liquid ETFs and large-cap equities.
The goal is simple: enter weakness into exhaustion, not falling knives.
Key Concepts:
Oversold short-term conditions
Price deviation vs recent mean
Volume/volatility context
Limit order for the next session only when criteria align
Exit next session open (or rules-based exit, depending on version)
I don’t chase dips — I pre-define levels and only enter when price comes to me. This trade idea triggered a limit buy level for today on EFA at 93.55.
General notes:
Works best in mean-reverting environments
Avoid news catalysts & low-liquidity names
This is not a signal service — just a research-based framework
If you like data-driven, rule-based setups, follow along —
I will share more systematic edge ideas like this.

ElDoradoFx – GOLD SESSIONS ANALYSIS (03/11/2025, PRE-ASIA SESSIGold ends the NY session stabilizing near 4,009, after multiple rejections from 4,025–4,030, confirming that sellers are still defending the upper liquidity zone. Meanwhile, buyers continue holding 4,004–3,995, maintaining a short-term ascending structure. This compression phase between resistance and support signals an imminent breakout setup — with Asia likely to decide direction for the next leg.
⸻
📊 Technical Outlook
🔹 D1: Gold remains bullish above the 100EMA, sustaining higher lows from 3,962 → 3,985 → 3,995. RSI ~52 — neutral but holding mid-range momentum. Daily breakout above 4,025 could reopen the path toward 4,060–4,082.
🔹 H1: Structure compressing between 4,025 resistance and 3,995 support. EMAs converging; MACD neutral with low volatility — ideal for a pre-breakout scenario.
🔹 15M–5M: Price forming equal highs at 4,011–4,012 and higher lows near 4,004. RSI 54–58, indicating gradual bullish accumulation before volatility expansion.
⸻
✨ Fibonacci Golden Zone (Last Swing 3,995 → 4,030)
38.2% = 4,016
50.0% = 4,012
61.8% = 4,008
🎯 Golden Zone: 4,016 – 4,008 (acting as key liquidity zone and short-term pivot).
⸻
🎯 High Probability Zones
📈 BUY SCENARIO (Primary Bias)
✅ Buy Zone: 4,016 – 4,008 (Golden Zone)
🎯 Targets: 4,025 → 4,036 → 4,046 → 4,060
🛑 Stop Loss: Below 3,995
⚡ Confirmation: Bullish engulfing or CHoCH above 4,012–4,016 with MACD crossover upward.
📊 Bias Rationale: The market continues to respect higher lows and absorb liquidity dips — indicating smart money accumulation around the Golden Zone.
💥 Breakout BUY Setup
Trigger: Break & close above 4,025
Retest: 4,022–4,024
🎯 Targets: 4,036 → 4,046 → 4,060 → 4,082
🛑 Stop Loss: Below 4,010
📉 SELL SCENARIO (Contingency Setup)
⚠️ Sell Zone: 4,025 – 4,036 (liquidity pocket + supply zone)
🎯 Targets: 4,012 → 4,004 → 3,985 → 3,965
🛑 Stop Loss: Above 4,046
⚡ Confirmation: Sharp rejection or RSI divergence >65 from 4,025–4,030 area.
📉 Break & Retest SELL Setup
Trigger: Break below 3,995
Retest: 4,000–3,997
🎯 Targets: 3,982 → 3,965 → 3,945
🛑 Stop Loss: Above 4,008
⸻
📰 Fundamental Watch
• Asia session: Low-impact day; volatility expected from liquidity sweeps.
• US Dollar Index (DXY) holding above 106 — mild pressure on gold short-term.
• Global markets: Traders positioning ahead of Fed and NFP later this week, keeping gold in range mode for now.
⸻
📌 Key Levels
Resistance: 4,025 / 4,036 / 4,046 / 4,060
Support: 4,012 / 4,004 / 3,995 / 3,982
Golden Zone: 4,016 – 4,008
Break Buy Trigger: > 4,025
Break Sell Trigger: < 3,995
⸻
✅ Summary (Expert View)
Gold remains bullish-to-neutral, consolidating between 4,004–4,025.
The Fibonacci Golden Zone (4,016–4,008) continues to act as the core decision area — expect Asia to attempt a liquidity sweep before breakout.
⚡ Expert Bias: BUY setup favored above 4,008, targeting 4,036–4,046.
Bearish bias only if 3,995 breaks cleanly.

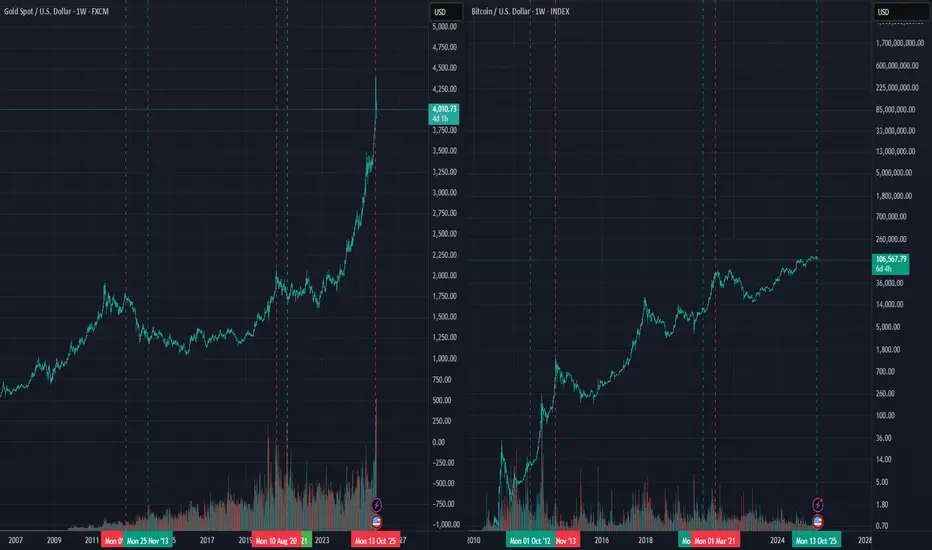
The correlation between gold and Bitcoin
I've observed an inverse correlation between gold and Bitcoin, as detailed below:
October 1, 2012: Gold was overbought, leading to a notable increase in Bitcoin.
November 25, 2013: Bitcoin hit its peak while gold fell to a low point.
August 10, 2020: Gold reached a peak, which was followed by a substantial rise in Bitcoin.
March 1, 2021: Bitcoin peaked while gold hit a trough.
October 13, 2025: Gold reached a peak (according to my analysis, it appears gold is overbought and has met its targets).
Historical data shows that gold has consistently formed peaks around these times, coinciding with Bitcoin's surges.
Consequently, I believe this remains an optimal accumulation period, with the indicators aligning favorably.
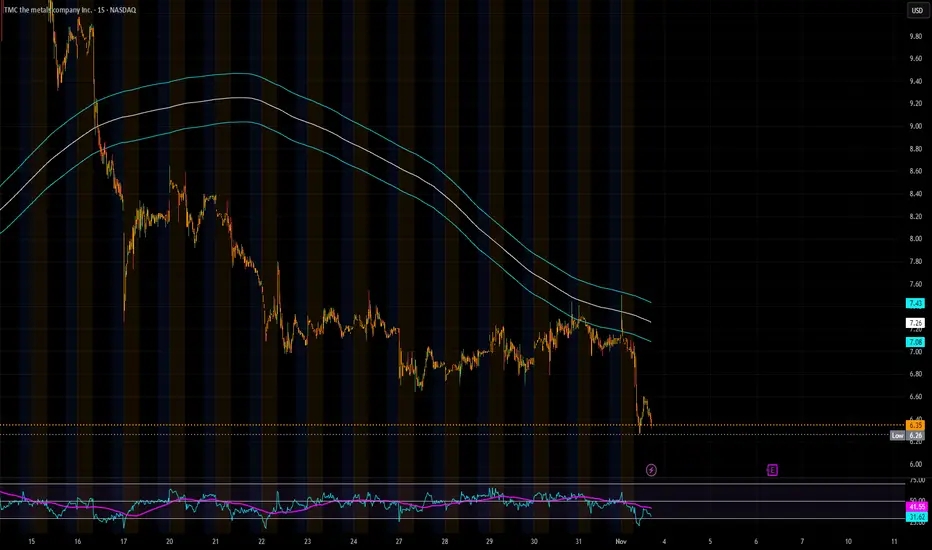
TMC the next TRUMP trade?Initiated a new long position today in $TMC. This is a speculative event-driven play which has 5-6X potential though high risk of downside as well.
The Metals Company (TMC): The intersection of geopolitics and precious metals:
Company overview:
TMC is a deep-sea mining firm aiming to harvest precious metals from the ocean floor. Its focus is on collecting polymetallic nodules (rock-like deposits rich in valuable metals) found in the Pacific. The company positions itself as a future supplier of materials critical for electric vehicles and renewable energy, offering a potential alternative to China’s dominance in global metal supply chains.
*Note: It is estimated the addressable market of undersea metals globally could be as high as $20 trillion and TMC is the only company on earth who has the technical ability to mine it at scale.
Bull thesis:
1. Strategic metals, unique source: TMC controls vast polymetallic nodule fields in the Pacific containing nickel, cobalt, copper, and manganese all critical to EVs and grid storage. It’s essentially a one-stop shop for the metals the West currently depends on China for.
2. Competitive advantage: TMC is the only company that has the technical ability to mine ocean floor at scale.
3. Geopolitical tailwind: With U.S.–China trade tensions escalating and Beijing’s stranglehold on critical minerals, TMC could become a strategic asset. There’s a real chance Trump pushes for domestic control of these resources possibly through a U.S. government equity stake or funding, similar to how the DPA (Defense Production Act) has been used to secure other materials.
4. Precedence: Trump admin has already take equity stakes in other metals companies including MP Materials, Lithium Americas, Trilogy Metals but none of these companies offer ocean-floor mining.
5. Regulatory momentum: TMC has already filed for U.S. permits and continues to work under the International Seabed Authority framework, putting it ahead of potential competitors if rules are finalized or the U.S. decides to act independently.
Catalyst:
The White House has issued executive actions and invoked authorities to accelerate critical mineral production and has deployed non-market tools (loan guarantees, DPA, DFC, even minority equity in select miners), signaling political willingness to take stronger measures to secure supply chains. If policymakers treat polymetallic nodules as strategically important, direct equity/financing or government partnerships could follow. I expect announcement over coming weeks/months.
Analyst ratings:
Most notably Wedbush (early Palantir bull) has rated TMC with a “buy” and $11 price target. But they would quickly re-rate company into the $20s if US gov takes equity stake or Trump allows them to have permit.
- Cantor, Alliance Global, and HC Wainwright also have buy rating on the stock.
Risks:
This is a binary play. I won't be in this long. Either they will get gov stake / permit or they won't.
Bottom-line:
This is a high-risk, high-reward investment which I believe plays beautifully into ongoing precious metals / China trade tension narrative coupled with Trump administration’s desire to be more aggressive with de-regulation and pursuing any avenue to decrease China leverage over US supply chains. Stock is down 30% from recent highs, and I have initiated a position at $6.50 with intent to begin selling in the $20s.
Invest at your own risk.
Gbp/Usd: weekly forecast, 11/03/2025Tape~Reading, my weekly aim for cable. wait for daily close to have you expectations of this week.

no comentPlease don't follow my ideas, but bearish 70% and 30% bullish. It's my opinion that it went too much up; it needs some kind of big correction to continue

Backtesting 101: How to Turn an Idea Into a Tested StrategyEvery trader has thought it:
“If I’d just followed that setup every time, I’d be up big.”
That’s where backtesting steps in, it separates luck from logic.
It’s how you find out whether your strategy has a real edge, or just worked in hindsight.
Most traders skip it, not because it’s useless, but because it forces them to face the truth.
But if you can handle that truth, backtesting will make you a far more confident trader.
What Backtesting Really Is
Backtesting means applying your trading rules to historical data to see how your system would have performed.
It’s not about predicting the future, it’s about proving whether your idea works in different market conditions.
When done properly, it gives you three key insights:
Profitability: does your edge actually exist?
Risk: how deep are the drawdowns, and can you handle them?
Consistency: does it work across bull, bear, and sideways markets?
A solid backtest gives you confidence, not because it guarantees profit, but because it exposes weakness before the market does.
The Most Common Mistakes
Curve-fitting: tweaking rules until the past looks perfect.
Ignoring fees and slippage: small costs that quietly erase profits.
Testing too little data: short periods create false confidence.
Focusing on one market: edges must survive different conditions.
If your backtest looks too clean, it’s probably lying to you.
Why It Matters
Backtesting builds trust in your system and discipline in yourself.
When you know your data, you stop second-guessing every trade.
Losing trades stop feeling like failure, because you understand they’re part of a proven edge.
Even bots rely on backtesting. Without it, automation is just random execution.
With it, every trade follows structure, not emotion.
All of these points make a difference between a winning or losing strategy.
From Idea to System
Every strategy starts as a hypothesis.
Backtesting turns that hypothesis into data.
Data turns into structure.
Structure turns into consistency.
That’s the real path to professional trading - logic first, emotion second.

EURUSD -DAILY TIMEFRAME ANALYSIS Here’s a professional breakdown of EUR/USD daily timeframe chart:
---
🧭 1. Overall Market Structure
The pair is in a clear bearish trend, characterized by a sequence of lower highs (LH) and lower lows (LL).
The dominant descending trendline reinforces bearish momentum — every attempt to retrace has been rejected at this trendline.
---
📉 2. Supply (Institutional Sell) Zones
You marked three visible supply zones on the chart — these represent areas where institutional orders previously pushed price downward:
Zone Approx. Price Range Description
Zone A 1.1850 – 1.1900 Highest and most significant supply zone. Major origin of bearish impulse.
Zone B 1.1720 – 1.1770 Mid-level supply; secondary retracement rejection.
Zone C 1.1640 – 1.1670 Most recent rejection zone aligning with trendline resistance.
All these zones remain unmitigated, meaning price hasn’t yet revisited them deeply — institutions may have pending sell orders waiting.
---
🧱 3. Key Price Levels
Immediate support: around 1.1510, where price is currently resting.
Next downside target: if 1.1510 breaks cleanly, next support zone could be around 1.1450 – 1.1420.
Trendline confluence: The descending trendline continues to cap every bullish rally, maintaining downside bias.
---
⚖️ 4. Institutional Positioning
Institutional traders are likely stacking shorts within the highlighted supply zones aligning with trend continuation logic.
---
📊 5. Volume & Momentum
Volume bars remain steady during bearish pushes, confirming active participation in the downtrend.
Bullish candles show weaker volume, implying limited buyer conviction.
---
💡 6. Trading Outlook
Scenario 1 – Bearish Continuation (Most Likely):
Wait for minor retracements back into 1.1600–1.1650 area (previous supply + trendline).
Watch for bearish rejection candles or liquidity sweeps at that zone to confirm re-entry short.
Target: 1.1450 → 1.1380 zones.
Scenario 2 – Bullish Pullback (Low Probability for Now):
If price breaks above 1.1670 and sustains, that would signal weakening bearish pressure.
Only then look for retracement buys toward 1.1740–1.1760 zone before reassessing.
---
📌 Summary
Trend: Bearish
Bias: Short continuation below 1.1670
Institutional Zones: 1.1640–1.1670 (active), 1.1720–1.1770, 1.1850–1.1900
Immediate Support: 1.1510 → 1.1450
Sell Confirmation: Rejection at supply zone + trendline confluence

XAUUSD – Buy Zone Confirmation Ahead of NY Session | 15M Setup
Price is approaching a key buy zone (3956–3972).
Wait for sentiment confirmation before entry — avoid trading inside the New York killing zone.
Logical SL: 3951
Focus on reaction and volume shift for a potential bullish reversal.
#XAUUSD #GoldAnalysis #Myshare_finance

EURUSD -DAILY TIMEFRAME ANALYSIS Here’s a professional breakdown of EUR/USD daily timeframe chart:
---
🧭 1. Overall Market Structure
The pair is in a clear bearish trend, characterized by a sequence of lower highs (LH) and lower lows (LL).
The dominant descending trendline reinforces bearish momentum — every attempt to retrace has been rejected at this trendline.
---
📉 2. Supply (Institutional Sell) Zones
The marked three visible supply zones on the chart — these represent areas where institutional orders previously pushed price downward:
Zone Approx. Price Range Description
Zone A 1.1850 – 1.1900 Highest and most significant supply zone. Major origin of bearish impulse.
Zone B 1.1720 – 1.1770 Mid-level supply; secondary retracement rejection.
Zone C 1.1640 – 1.1670 Most recent rejection zone aligning with trendline resistance.
All these zones remain unmitigated, meaning price hasn’t yet revisited them deeply — institutions may have pending sell orders waiting.
---
🧱 3. Key Price Levels
Immediate support: around 1.1510, where price is currently resting.
Next downside target: if 1.1510 breaks cleanly, next support zone could be around 1.1450 – 1.1420.
Trendline confluence: The descending trendline continues to cap every bullish rally, maintaining downside bias.
---
⚖️ 4. Institutional Positioning
Institutional traders are likely stacking shorts within the highlighted supply zones aligning with trend continuation logic.
---
📊 5. Volume & Momentum
Volume bars remain steady during bearish pushes, confirming active participation in the downtrend.
Bullish candles show weaker volume, implying limited buyer conviction.
---
💡 6. Trading Outlook
Scenario 1 – Bearish Continuation (Most Likely):
Wait for minor retracements back into 1.1600–1.1650 area (previous supply + trendline).
Watch for bearish rejection candles or liquidity sweeps at that zone to confirm re-entry short.
Target: 1.1450 → 1.1380 zones.
Scenario 2 – Bullish Pullback (Low Probability for Now):
If price breaks above 1.1670 and sustains, that would signal weakening bearish pressure.
Only then look for retracement buys toward 1.1740–1.1760 zone before reassessing.
---
📌 Summary
Trend: Bearish
Bias: Short continuation below 1.1670
Institutional Zones: 1.1640–1.1670 (active), 1.1720–1.1770, 1.1850–1.1900
Immediate Support: 1.1510 → 1.1450
Sell Confirmation: Rejection at supply zone + trendline confluence

XAUUSD / GOLDGold chart illustrates a potential bullish setup forming above a key support zone. Price has recently bounced from the ascending trendline and is consolidating near the 4,000 level. The analysis suggests a possible short-term pullback into the support area around 3,950–3,900, followed by a rebound toward the target at 4,100. The overall structure indicates that as long as price holds above the rising trendline, bullish momentum may continue toward the next resistance zone.
"Thank you for your support! If you found this idea valuable or learned something new, please consider liking and leaving a comment. I’d really appreciate hearing your feedback and thoughts."

USDCHF USD/CHF 4-hour chart shows price approaching a key resistance zone around 0.8060 after a strong bullish push. A potential rejection from this level could trigger a pullback toward the 0.8000 support zone, followed by further downside toward 0.7940. The structure suggests a possible bearish reversal setup if resistance holds, with multiple support levels highlighted for potential reaction zones.
"Thank you for your support! If you found this idea valuable or learned something new, please consider liking and leaving a comment. I’d really appreciate hearing your feedback and thoughts."

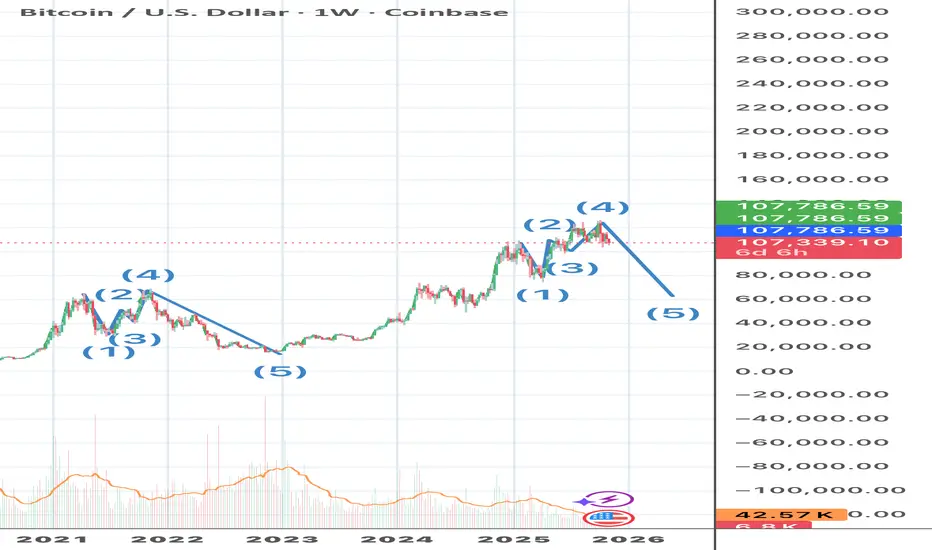
Bitcoin: You Need to Know This Before it HappensIt’s time I share something that’s consistently paid off for me, and I want you to understand it too, because there’s enough opportunity for all of us to win.
Here’s the truth: Bitcoin and most modern assets aren’t just traded by people anymore, they’re traded by algorithms. These systems follow patterns that, once you recognize them, become surprisingly predictable and profitable.
Each market cycle follows the same rhythm: a powerful bull run, massive profit-taking, and then a reset. But here’s what’s key, with every new cycle, large institutions are stepping in with bigger positions and deeper leverage. That’s why these patterns grow wider and taller each time, the scale increases right along with the money flowing in.
We’ve now reached the top of this current cycle, completing a familiar algorithm that’s played out again and again.
So what does this mean for you?
If you’re into shorting, this is the window to consider it. If you’d rather ride the next bull wave, patience will pay, wait for the price to retrace near $60,000. That’s where the next opportunity begins. And the next cycle? It’ll be even bigger, longer, taller, and more explosive than before.
The more you understand these repeating patterns, the more power you hold in the market. Let’s keep learning, growing, and profiting, together.
BTC/ETH/USD Failed BreakoutBTC ETH failed to breakout after last Thursday's local LOW. There's a potential for making a new local LOW this mid-week (Wed/Thur). Key levels to watch for reversals are the red lines on the charts.
