USD/CAD - Wedge Breakout (15.10.2025)📊 Setup Overview: OANDA:USDCAD
USD/CAD has completed a rising wedge formation and broken below the support trendline — a classic sign of bearish reversal pressure. The price is now rejecting from the resistance zone, supported by weakening momentum within the Ichimoku cloud. This setup indicates a potential move toward the next major support levels.
📈 Trade Plan:
Bias: Bearish
Sell Entry Zone: Near 1.4040 – 1.4060 (resistance retest area)
1st Target: 1.3992 ✅
2nd Target: 1.3954 🎯
Invalidation: Above 1.4075 resistance zone
🧩 Supporting Factors:
Clear wedge breakout below trendline
Resistance zone rejection after sharp upward push
Price trading below Ichimoku cloud, signaling bearish control
Volume and structure aligning for a potential downside continuation
#USDCAD #Forex #PriceAction #TechnicalAnalysis #TradingView #ChartPattern #WedgeBreakout #ForexSignals #BearishSetup #FXTrading #Ichimoku #ChartsDontLie
⚠️ Disclaimer:
This analysis is for educational purposes only and not financial advice. Always conduct your own analysis and use proper risk management before taking any trade.
💬 Support the Analysis:
If you found this helpful — Like 👍, Comment 💬, and Follow ✅ for more high-quality chart setups and pattern-based analyses!
Beyondtechnicalanalysis

GBP/USD - Breakout Pattern (14.10.2025)The GBP/USD pair on the M30 timeframe presents a Potential Buying Opportunity due to a recent Formation of a Breakout Pattern.
This suggests a shift in momentum towards the upside and a higher likelihood of further advances in the coming hours.
Possible Long Trade:
Entry: Consider Entering A Long Position around Trendline Of The Pattern.
Target Levels:
1st Resistance – 1.3434
2nd Resistance – 1.3484
🎁 Please hit the like button and
🎁 Leave a comment to support for My Post !
Your likes and comments are incredibly motivating and will encourage me to share more analysis with you.
#GBPUSD #Forex #Trading #TechnicalAnalysis #PriceAction #ForexSignals #BreakoutTrading #Ichimoku #FXTrading #BullishSetup #TradingView
⚠️ Disclaimer:
This analysis is for educational purposes only and not financial advice. Always use proper risk management and conduct your own research before trading.
Best Regards, KABHI_TA_TRADING
Thank you.

GBP/AUD – Triangle Breakout (03.10.2025)📊 Setup:
GBP/AUD has broken down from a Triangle Pattern on the 30M chart. Price rejected the resistance zone and confirmed bearish momentum by closing below the trendline support. The breakout signals potential continuation towards lower support levels.
📉 Trade Plan:
Bias: Bearish as long as price remains below the resistance zone and triangle breakout level.
1st Support Target: 2.0273
2nd Support Target: 2.0225
✅ Support Factors:
Triangle breakout pattern
Rejection from resistance zone
1.Ichimoku alignment showing bearish momentum
2.Volume profile showing weakness above current level
#GBPAUD #Forex #Trading #TechnicalAnalysis #PriceAction #TriangleBreakout #ForexSignals #FXTrading #BearishSetup #TradingView
⚠️ Disclaimer:
This analysis is for educational purposes only and not financial advice. Always use proper risk management and do your own research before entering trades.
💬 Support the Analysis:
If you find this useful, Like 👍, Comment 💬, and Follow ✅ for more trade setups & updates.

EUR/USD - U.S Government Shutdown ? 📊 Setup:
EUR/USD has successfully broken out of the descending channel on the H1 timeframe. Price is holding above the breakout level, supported by the Ichimoku cloud and a nearby demand zone. With potential U.S. government shutdown news weighing on the dollar, EUR/USD shows strong upside potential.
📈 Trade Plan:
Buy Zone: 1.1710 – 1.1730 (support zone & breakout retest)
1st Resistance Target: 1.1837
2nd Resistance Target: 1.1891
Bias: Bullish as long as price holds above support zone and channel breakout.
✅ Support Factors:
Clear Channel Breakout on H1
Confluence with Ichimoku bullish bias
Fundamental support: Possible U.S. government shutdown → weaker USD outlook
Strong demand zone cushioning downside
#EURUSD #Forex #Trading #TechnicalAnalysis #PriceAction #ForexSignals #FXTrading #Euro #USD #Breakout #TradingView
⚠️ Disclaimer:
This analysis is for educational purposes only and not financial advice. Always do your own research and manage risk before trading.
💬 Support the Analysis:
If this setup adds value, don’t forget to Like 👍, Comment 💬, and Follow ✅ for more timely updates.

#$XAUUAS Uptrend Hello traders friends
My forecast on #XAUUSD
I think continue to wait for gold buying power to 3900 and creating new ATH
Best regards, Honeytrading

EUR/AUD - Breakout Pattern|Buy Opportunity (26.09.2025)The EUR/AUD pair has been trading inside a descending wedge formation and is now showing a potential breakout to the upside.
🔹 Price successfully tested the trendline resistance and is gaining bullish momentum.
🔹 Buyers are stepping in after multiple rejections near the lower boundary (A–C trendline).
🔹 Breakout above 1.7860 zone opens the path toward higher resistance levels.
📊 Trading Plan:
Buy above breakout zone confirmation
1st Resistance: 1.7929
2nd Resistance: 1.7966
Maintain risk management and wait for candle confirmation.
✨ Trade safe & stay disciplined!
#EURAUD #Forex #Breakout #TradingView #FXAnalysis #PriceAction #ForexTrading #SwingTrading #TechnicalAnalysis #Kabhi_TA_Trading
✅ If you find this analysis helpful, don’t forget to like 👍, comment 💬, and follow 🔔 for more updates.
📌 Disclaimer: This analysis is for educational purposes only. Not financial advice. Trade at your own risk.

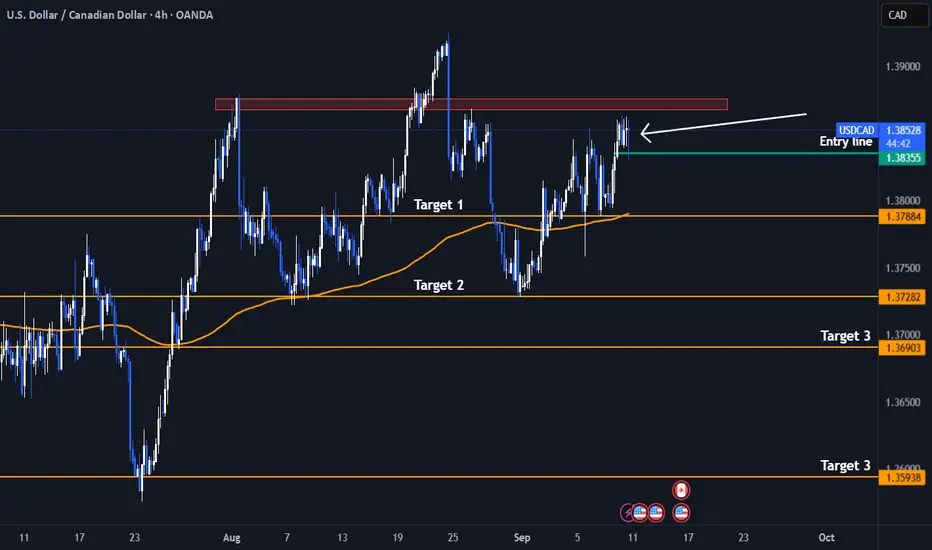
Short! Short! USDCAD - Double Head and Shoulder PatternI have identified a clear head and shoulders pattern forming within a larger head and shoulders structure on the daily timeframe for USD/CAD, indicating a potential bearish reversal.
From a fundamental perspective, several key factors are contributing to the current weakness in the Canadian dollar against the US dollar:
Canada's labor market showed significant weakness in August 2025, with a notable loss of 65.5 thousand jobs and a rise in unemployment to 7.1%, the highest in years. This has increased market expectations for monetary easing from the Bank of Canada (BoC).
Although core inflation remains above target, the weak jobs data is pushing the BoC towards potential rate cuts or a more accommodative policy stance, which weighs on the Canadian dollar.
The market is currently pricing in a very high chance (around 98%) of an additional rate cut by the BoC in September, following previous reductions to 2.75%. This dovish stance contrasts with the Federal Reserve’s more cautious or hawkish approach, creating a wider interest rate differential that supports US dollar strength.
Additionally, declining oil prices, a major export for Canada, are exerting further downward pressure on the CAD.
While recent US economic data has been mixed, the Fed is generally seen as less dovish than the BoC, sustaining demand for the USD.
Trade tensions and geopolitical risks between the US and Canada add to concerns over Canada’s growth outlook, contributing to CAD depreciation risk.
Trade Tip
A strong close below the Entry line will be a perfect entry /4hr TF
Stoploss : Above the Left Shoulder (Red Rectangle)
In summary, the combination of a weakening Canadian economy, dovish BoC bias, lower oil prices, and interest rate divergence between the US and Canada all support a bearish outlook for USD/CAD, which aligns well with the bearish head and shoulders pattern I have spotted on the chart.
Not an Investment Advise
USD/JPY - Bullish Channel, Next Targeting 148.95 (23.09.2025)#USDJPY #Forex #Trading #TechnicalAnalysis
USD/JPY is trading within a Bullish Channel Pattern on the 30M chart, holding above the rising trendline support. The pair is bouncing from the support zone (147.50 – 147.70), signaling potential upside continuation.
🔹 Market Structure:
Bullish channel intact with higher highs & higher lows.
Price rejected the support zone and trendline.
Momentum suggests buyers could retest upper channel resistance.
🔹 Key Levels:
Support Zone: 147.50 – 147.70
1st Resistance: 148.58
2nd Resistance: 148.95
📈 Trading Idea:
As long as USD/JPY stays above the support zone, bulls may drive price higher toward 148.58 → 148.95.
⚠️ Invalidation:
A break below 147.50 would weaken the bullish outlook.
“Discipline + Patience = Consistency 🔑”

EUR/AUD - Selling Pressure Below 1.7850 (22.09.2025)#EURAUD #Forex #Trading #TechnicalAnalysis
EUR/AUD – Channel Breakout Pattern (30M)
EUR/AUD has broken below the rising channel, confirming a bearish reversal after completing a Head & Shoulders pattern at the top.
🔹 Market Structure:
Clear rejection from the resistance zone (1.7850 – 1.7860)
Breakdown of the bullish channel support
Head & Shoulders formation adding to bearish momentum
🔹 Key Levels:
1st Support: 1.7715
2nd Support: 1.7710
📉 Trading Idea:
As long as EUR/AUD stays below the channel resistance, selling pressure could drive price toward the support levels.
🎁 Please hit the like button and
🎁 Leave a comment to support for My Post !
Your likes and comments are incredibly motivating and will encourage me to share more analysis with you.
Best Regards, KABHI_TA_TRADING
Thank you.

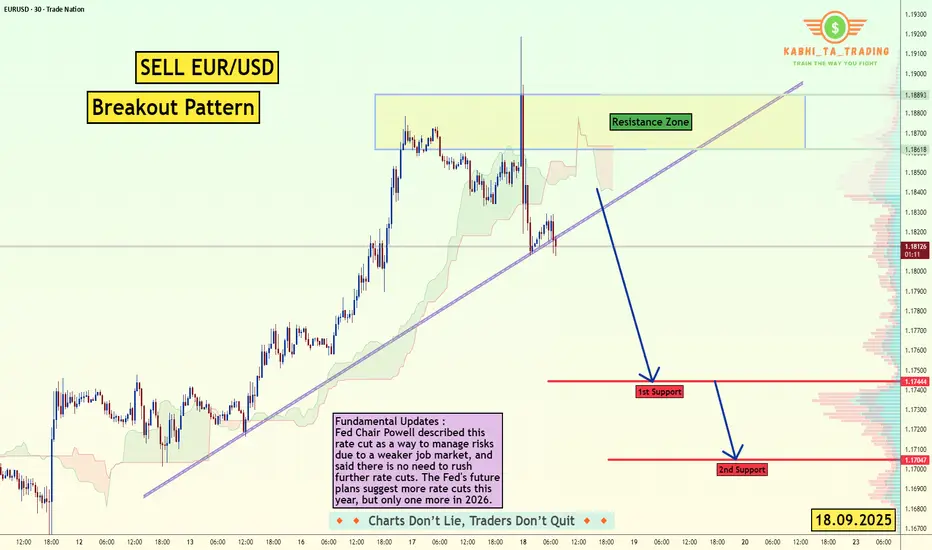
EUR/USD - Fundamental Move (18.09.2025)The EUR/USD Pair on the M30 timeframe presents a Potential Selling Opportunity due to a recent Formation of a Breakout Pattern.
This suggests a shift in momentum towards the downside in the coming hours.
Possible Short Trade:
Entry: Consider Entering A Short Position around Trendline Of The Pattern.
Target Levels:
1st Support – 1.1744
2nd Support – 1.1704
Fundamental Updates :
Fed Chair Powell described this rate cut as a way to manage risks due to a weaker job market, and said there is no need to rush further rate cuts. The Fed's future plans suggest more rate cuts this year, but only one more in 2026.
🎁 Please hit the like button and
🎁 Leave a comment to support for My Post !
Your likes and comments are incredibly motivating and will encourage me to share more analysis with you.
Best Regards, KABHI_TA_TRADING
Thank you.
USD/CAD - Bearish Flag (15.09.2025)The USD/CAD Pair on the M30 timeframe presents a Potential Selling Opportunity due to a recent Formation of a Bearish Flag Pattern. TRADENATION:USDCAD
This suggests a shift in momentum towards the downside in the coming hours.
Possible Short Trade:
Entry: Consider Entering A Short Position around Trendline Of The Pattern.
Target Levels:
1st Support – 1.3814
2nd Support – 1.3796
🎁 Please hit the like button and
🎁 Leave a comment to support for My Post !
Your likes and comments are incredibly motivating and will encourage me to share more analysis with you.
Best Regards, KABHI_TA_TRADING
Thank you.

XAU/USD (Gold) - Trendline Breakout (US - CPI Data) (11.09.2025)The XAU/USD Pair on the M30 timeframe presents a Potential Selling Opportunity due to a recent Formation of a Trendline Breakout Pattern.
This suggests a shift in momentum towards the downside in the coming hours.
Possible Short Trade:
Entry: Consider Entering A Short Position around Trendline Of The Pattern.
Target Levels:
1st Support – 3583
2nd Support – 3546
🎁 Please hit the like button and
🎁 Leave a comment to support for My Post !
Your likes and comments are incredibly motivating and will encourage me to share more analysis with you.

GBP/USD - Breakout (US - CPI Data) (11.09.2025)The GBP/USD Pair on the M30 timeframe presents a Potential Selling Opportunity due to a recent Formation of a Breakout Pattern.
This suggests a shift in momentum towards the downside in the coming hours.
Possible Short Trade:
Entry: Consider Entering A Short Position around Trendline Of The Pattern.
Target Levels:
1st Support – 1.3475
2nd Support – 1.3441
🎁 Please hit the like button and
🎁 Leave a comment to support for My Post !
Your likes and comments are incredibly motivating and will encourage me to share more analysis with you.

AUD/USD - Bullish Channel (10.09.2025) The AUD/USD pair on the M30 timeframe presents a Potential Buying Opportunity due to a recent Formation of a Bullish Channel Pattern.
This suggests a shift in momentum towards the upside and a higher likelihood of further advances in the coming hours.
Possible Long Trade:
Entry: Consider Entering A Long Position around Trendline Of The Pattern.
Target Levels:
1st Resistance – 0.6636
2nd Resistance – 0.6658
🎁 Please hit the like button and
🎁 Leave a comment to support for My Post !
Your likes and comments are incredibly motivating and will encourage me to share more analysis with you.
Best Regards, KABHI_TA_TRADING
Thank you.
Disclosure: I am part of Trade Nation's Influencer program and receive a monthly fee for using their TradingView charts in my analysis.

GBP/AUD - Triangle Breakout (08.09.2025)The GBP/AUD Pair on the M30 timeframe presents a Potential Selling Opportunity due to a recent Formation of a Triangle Breakout Pattern. This suggests a shift in momentum towards the downside in the coming hours.
Possible Short Trade:
Entry: Consider Entering A Short Position around Trendline Of The Pattern.
Target Levels:
1st Support – 2.0493
2nd Support – 2.0457
🎁 Please hit the like button and
🎁 Leave a comment to support for My Post !
Your likes and comments are incredibly motivating and will encourage me to share more analysis with you.
Best Regards, KABHI_TA_TRADING
Thank you.
Disclosure: I am part of Trade Nation's Influencer program and receive a monthly fee for using their TradingView charts in my analysis.

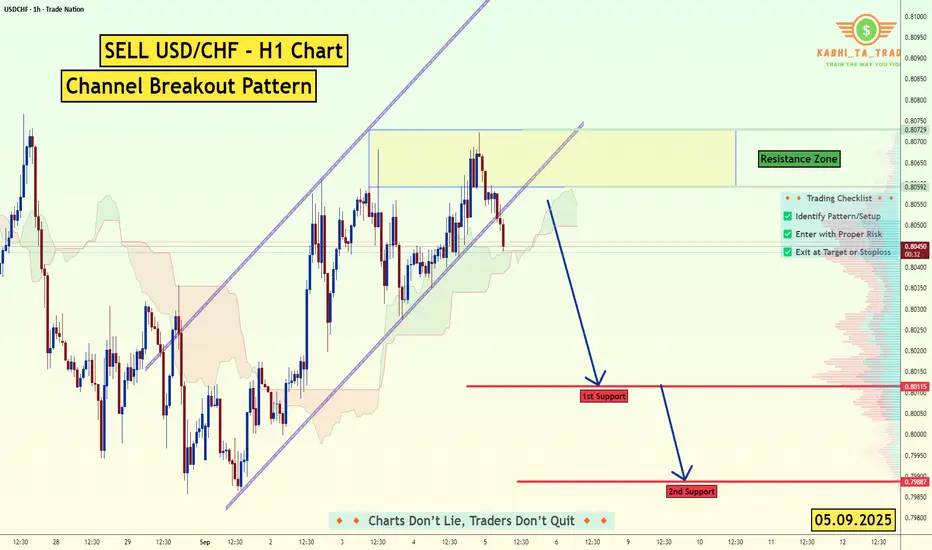
USD/CHF - H1 - Channel Breakout (NFP) (05.09.2025)The USD/CHF Pair on the H1 timeframe presents a Potential Selling Opportunity due to a recent Formation of a Channel Breakout Pattern. This suggests a shift in momentum towards the downside in the coming hours.
Possible Short Trade:
Entry: Consider Entering A Short Position around Trendline Of The Pattern.
Target Levels:
1st Support – 0.8011
2nd Support – 0.7988
🎁 Please hit the like button and
🎁 Leave a comment to support for My Post !
Your likes and comments are incredibly motivating and will encourage me to share more analysis with you.
Best Regards, KABHI_TA_TRADING
Thank you.
Disclosure: I am part of Trade Nation's Influencer program and receive a monthly fee for using their TradingView charts in my analysis.
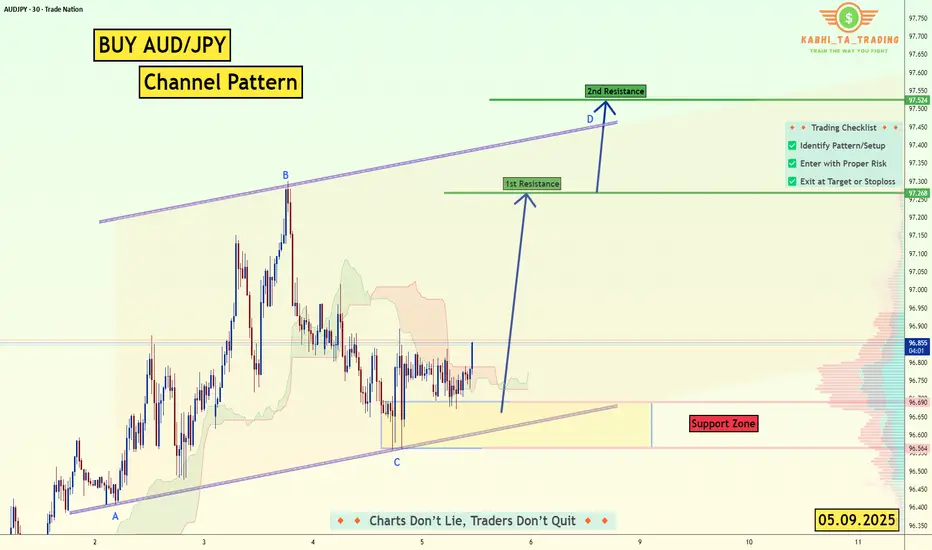
AUD/JPY - Channel Pattern (05.09.2025) The AUD/JPY pair on the M30 timeframe presents a Potential Buying Opportunity due to a recent Formation of a Channel Pattern. This suggests a shift in momentum towards the upside and a higher likelihood of further advances in the coming hours.
Possible Long Trade:
Entry: Consider Entering A Long Position around Trendline Of The Pattern.
Target Levels:
1st Resistance – 97.26
2nd Resistance – 97.52
🎁 Please hit the like button and
🎁 Leave a comment to support for My Post !
Your likes and comments are incredibly motivating and will encourage me to share more analysis with you.
Best Regards, KABHI_TA_TRADING
Thank you.
Disclosure: I am part of Trade Nation's Influencer program and receive a monthly fee for using their TradingView charts in my analysis.
USD/CAD - Bullish Pennant (04.09.2025)The USD/CAD pair on the M30 timeframe presents a Potential Buying Opportunity due to a recent Formation of a Bullish Pennant Breakout Pattern. This suggests a shift in momentum towards the upside and a higher likelihood of further advances in the coming hours.
Possible Long Trade:
Entry: Consider Entering A Long Position around Trendline Of The Pattern.
Target Levels:
1st Resistance – 1.3835
2nd Resistance – 1.3853
🎁 Please hit the like button and
🎁 Leave a comment to support for My Post !
Your likes and comments are incredibly motivating and will encourage me to share more analysis with you.
Best Regards, KABHI_TA_TRADING
Thank you.
Disclosure: I am part of Trade Nation's Influencer program and receive a monthly fee for using their TradingView charts in my analysis.

USD/CHF - Wedge Breakout (02.09.2025)The USD/CHF pair on the M30 timeframe presents a Potential Buying Opportunity due to a recent Formation of a Wedge Breakout Pattern. This suggests a shift in momentum towards the upside and a higher likelihood of further advances in the coming hours.
Possible Long Trade:
Entry: Consider Entering A Long Position around Trendline Of The Pattern.
Target Levels:
1st Resistance – 0.8048
2nd Resistance – 0.8067
🎁 Please hit the like button and
🎁 Leave a comment to support for My Post !
Your likes and comments are incredibly motivating and will encourage me to share more analysis with you.
Best Regards, KABHI_TA_TRADING
Thank you.
Disclosure: I am part of Trade Nation's Influencer program and receive a monthly fee for using their TradingView charts in my analysis.

A Question many people don't know the answer to.In this post we’ll answer a question many people don't know the answer to, and provide an in-depth explanation of why the crypto market is bound to a 4-year cycle.
🔸The answer:
-The market is tied to a key event — the Bitcoin Halving . This is when the block reward for mining Bitcoin is cut in half every 4 years. Mining is the lifeline that brings Bitcoin into circulation. Without it, there would be no supply entering the market.
But is this still effective now, given that most of Bitcoin’s supply is already mined?
The total supply of Bitcoin is fixed at 21 million, and so far, around 19.9 million have already been mined. That leaves only about 1.1 million Bitcoin still to be mined — scheduled, with halvings, until the year 2140.
I know what you’re thinking … Why does the halving still impact market behavior if the remaining supply is so small and its effect seems limited?
-History shows that after every halving, the market tends to rise for about a year and a half. This proves that investors wait for the halving to take place, monitor the network’s smooth performance during the event, and once they confirm no issues exist, they begin injecting liquidity into the market.
------------------------------------------
Is there a scenario where the 4-year cycle could change?
It’s difficult, but yes …
Why? Because since Bitcoin’s inception, its price cycle has been tied to the halving. This pattern has been consistent since 2011, across three full cycles, and now we are in the fourth.
However, the halving itself has become a symbol of trust and security for investors. Every successful halving event reinforces confidence in Bitcoin’s scarcity and strength. That’s why the 4-year rhythm will only change if another factor emerges strong enough to rival the influence of the halving.
Signs of such a new factor already appeared in 2025 — with the U.S. President’s support for Bitcoin and the growing trend of corporations and financial institutions purchasing it, alongside increased transparency in declaring holdings and reserves.
This shift is crucial. When supply moves from scattered hands (individuals) to stronger hands (corporations) , and holdings are publicly disclosed, it strengthens trust in the Bitcoin network and reduces the wild volatility that individuals once caused.
Conclusion : The 4-year cycle could evolve in the future, especially if supportive policies accelerate and corporations continue to accumulate Bitcoin in massive quantities starting from the next cycle.
Best regards
Cecilione🎯

CAD/JPY - Channel Breakout (29.08.2025)The CAD/JPY Pair on the M30 timeframe presents a Potential Selling Opportunity due to a recent Formation of a Channel Breakout Pattern. This suggests a shift in momentum towards the downside in the coming hours.
Possible Short Trade:
Entry: Consider Entering A Short Position around Trendline Of The Pattern.
Target Levels:
1st Support – 106.47
2nd Support – 106.30
🎁 Please hit the like button and
🎁 Leave a comment to support for My Post !
Your likes and comments are incredibly motivating and will encourage me to share more analysis with you.
Best Regards, KABHI_TA_TRADING
Thank you.
Disclosure: I am part of Trade Nation's Influencer program and receive a monthly fee for using their TradingView charts in my analysis.

GBP/CHF - Wedge Breakout (28.08.2025)The GBP/CHF pair on the M30 timeframe presents a Potential Buying Opportunity due to a recent Formation of a Wedge Breakout Pattern. This suggests a shift in momentum towards the upside and a higher likelihood of further advances in the coming hours.
Possible Long Trade:
Entry: Consider Entering A Long Position around Trendline Of The Pattern.
Target Levels:
1st Resistance – 1.0862
2nd Resistance – 1.0877
🎁 Please hit the like button and
🎁 Leave a comment to support for My Post !
Your likes and comments are incredibly motivating and will encourage me to share more analysis with you.
Best Regards, KABHI_TA_TRADING
Thank you.
Disclosure: I am part of Trade Nation's Influencer program and receive a monthly fee for using their TradingView charts in my analysis.

AUD/USD LONG IDEAAUD/USD is testing a strong resistance around 0.6520 that has capped price for months. A breakout looks imminent, and if confirmed, it could open the door for a strong bullish rally towards 0.6650 and beyond.
