LTC/USDT | Will it continue to go higher? (READ THE CAPTION)As you can see in the 2H chart of LTCUSDT, it got in the FVG zone, but failed to stay there and it is now below the low of the FVG, being traded at 82.10.
I don't expect it to go lower, rather want it to go and retest the FVG zone and maybe even breaking through it.
Should it fail to go higher and drops further, I would want a reaction to the Bullish Breaker.
Targets for Litecoin: 82.80, 83.40, 84 and 84.60.
Binancecoin

ETHUSDT | Can it break through the FVG? (READ THE CAPTION)As you can see in the 2H chart of ETHUSDT, it finally came back above 3000, breaking through the FVG, going as high as 3150, before dropping back in the FVG zone and is now being traded 3100.
I expect Ethereum to test the high of the FVG again.
For the time being, the targets are: 3117, 3150 and 3182

BNBUSDT | A long way ahead (READ THE CAPTION)By examining the 6h chart of BNBUSDT we can see that after days of struggling, it has finally made a little distance from the Demand Zone, going as high as 891, and now is being traded at 874. However, BNBUSDT still has a long way, and for the time being, I prefer to wait and see the movement before making a move myself.

LTC/USDT | Up or down? (READ THE CAPTION)By examining the 2H chart of LTCUSDT, we can see that after sweeping initial SellSide Liquidity, it started an upwards move, currently being traded at 77.55.
There are relative equal lows below the current zone LTCUSDT is being traded, I expect it to eventually drop there and sweep the liquidity there and then start another upwards move.
Current bullish targets for LTCUSDT: 78, 79.3 and 80.50.
Bearish Targets: 76.60, 75.40 and 74.30.

BNB/USDT | Sleeping for now! (READ THE CAPTION)As you can see in the Daily chart of BNBUSDT, after hitting a new ATH at $1375 in October, it has plummeted in price and is being traded now at $860.
It has reacted to the Bullish Rejection Block several times now, but it is still in a shallow run, taking its sweet time for the time being until it makes a real move.
Bullish targets are: 871, 884 and 897.
Bearish targets are: 846, 833 and 821.

BNB Looks Bullish (4H)BNB has been making higher lows and continuously forming bullish CHs.
Based on the latest bullish CH, buy/long positions can be considered on pullbacks within the support zones.
We have two entry points where DCA can be applied.
Also, if the lows hold, it is possible that the liquidity pool above the chart could be swept soon.
A daily candle close below the invalidation level will invalidate this analysis.
For risk management, please don't forget stop loss and capital management
When we reach the first target, save some profit and then change the stop to entry
Comment if you have any questions
Thank You

FireHoseReel | BNB Daily Analysis #28🔥 Welcome To FireHoseReel !
Let’s dive into Binance Coin (BNB) analysis.
👀 BNB 1H Overview
BNB bounced strongly from the vicinity of its maker-buyer zone with a very long upper wick, which clearly highlights a key demand/support area. Price is currently trading below the multi-timeframe resistance at $843.11, which also acts as a pre-breakout zone.
📊 Volume Analysis
Honestly, there’s not much meaningful insight to extract from BNB volume right now. The volume structure is extremely messy and unreliable, making proper analysis difficult. For that reason, I’m choosing not to rely on volume until it normalizes or the underlying cause becomes clear.
✍️ BNB Trading Scenarios
🟢 Long Scenario:
A confirmed breakout above $843.11, accompanied by increasing buy volume, could trigger a high-risk long setup.
🔴 Short Scenario:
If the maker zone breaks with a strong whale candle and heavy selling pressure, followed by continuation and a pullback, we can look for entry opportunities using proper setup candles. If price starts moving in that direction, I’ll update the analysis accordingly.
🧠 Protect your capital first. No setup is worth blowing your account. If risk isn’t controlled, profit means nothing. Trade with rules, not emotions.

BNB H1 Post-FVG Sweep and Mean Reversion Toward 828📝 Description
BNB on H1 just swept its most recent FVG, triggering a short-term liquidity run. After this sweep, price is showing signs of distribution below HTF resistance, which opens the door for a mean-reversion move lower. Given the current structure, a pullback toward 828 looks like the natural next draw on liquidity.
________________________________________
📈 Signal / Analysis
Primary Bias: Bearish pullback
Short Setup (Preferred):
• Entry (Sell): 840
• Stop Loss: Above 844
• TP1: 834
• TP2: 831
• TP3: 827–828 (liquidity target)
________________________________________
🎯 ICT & SMC Notes
• Recent FVG fully swept and imbalance resolved
• Price trading below H1 supply / premium
• BSL failed to hold and weakness confirmed
• SSL resting below current range
________________________________________
🧩 Summary
After cleaning the nearby FVG, BNB looks heavy. As long as price remains capped below the swept zone, odds favor a rotation toward 828 liquidity. Shorts after confirmation make more sense than chasing upside here.
________________________________________
🌍 Fundamental Notes / Sentiment
With broader crypto still reacting to liquidity conditions and macro headlines, continuation moves are less likely without fresh catalysts. For now, technical liquidity levels remain the best guide, manage risk and scale out near targets.
________________________________________
⚠️ Risk Disclosure
Trading involves substantial risk and may result in capital loss. This analysis is for educational purposes only and does not constitute financial advice. Always apply proper risk management, predefined stop-loss levels, and disciplined position sizing aligned with your trading plan.

FireHoseReel | BNB Daily Analysis #27🔥 Welcome To FireHoseReel !
Let’s dive into Binance Coin (BNB) analysis.
👀 BNB 1H Overview
After its recent declines, BNB is currently ranging on the 1-hour timeframe between the $850 resistance and the $835 support. A breakout from either side could lead to a move toward the next key resistance or support level.
📊 Volume Analysis
On the 1-hour timeframe, BNB volume looks unclear to me. Volume has dropped significantly and doesn’t provide a strong or reliable signal at the moment, making it difficult to interpret what is happening from a volume perspective.
✍️ BNB Trading Scenarios
🟢 Long Scenario:
A breakout above $850 accompanied by increasing buying volume could trigger a move toward $870, making it a valid long setup.
🔴 Short Scenario:
A breakdown below the $835 support with visible selling volume could push price toward its next maker buyer zone, where we can then reassess market behavior.
🧠 Protect your capital first. No setup is worth blowing your account. If risk isn’t controlled, profit means nothing. Trade with rules, not emotions.

FireHoseReel | BNB Daily Analysis #26🔥 Welcome To FireHoseReel !
Let’s dive into Binance Coin (BNB) analysis.
👀 BNB 4H Overview
BNB has reached the vicinity of its key resistance but was rejected after forming a lower high compared to the previous peak. Price is now rotating downward and moving toward the lower boundary of the range (box).
📊 Volume Analysis
As price approached the $876.76 resistance, buying volume weakened and failed to support a breakout. This lack of demand caused a rejection from the level, allowing sellers to take control of price action.
✍️ BNB Trading Scenarios
🟢 Long Scenario:
Our risky pre-breakout trigger has shifted slightly lower and is now located above the newly formed lower high at $869.32. A breakout above this level, accompanied by rising buying volume, would activate our long trigger.
🔴 Short Scenario:
A breakdown of the maker buyer zone, ranging from $819.90 to $807.46, is expected to occur with a strong impulsive (whale) candle. If this level is broken, we will wait for a pullback to enter short positions.
🧠 Protect your capital first. No setup is worth blowing your account. If risk isn’t controlled, profit means nothing. Trade with rules, not emotions.

BNB Approaching Key Support – Potential Bounce SetupBNB is moving toward a major support zone between $800 – $820. This area has historically served as a demand zone, and we're watching for bullish price action or a potential reversal signal around this level. If support holds, there's a strong chance for price rotation back toward the mid-range of the broader structure.
💡 Trade Setup Idea:
Entry Zone: $800 – $820 (Support)
Take Profit Targets: $890 / $976 / $1168
Stop Loss: $742 (below structure)
A bounce from this level could offer a solid risk-reward setup. Always wait for confirmation (e.g. bullish engulfing, volume spike, or momentum shift) before entering. Manage your risk carefully.
#BNB #Crypto #BinanceCoin #TradingView #CryptoTrading #TechnicalAnalysis #SupportAndResistance #PriceAction

FireHoseReel | BNB Daily Analysis #25🔥 Welcome To FireHoseReel !
Let’s dive into Binance Coin (BNB) analysis.
👀 BNB 4H Overview
BNB is currently trading near a key resistance level and is likely to show a reaction at this zone before attempting a breakout. As you can see, buying volume is gradually increasing, which supports a potential upward move.
📊 Volume Analysis
As mentioned in the previous analysis, a significant amount of capital from buy-side makers was deployed within a single 4-hour candle. With buyers’ momentum continuing, BNB still has the potential to push higher.
✍️ BNB Trading Scenarios
🟢 Long Scenario:
A confirmed breakout above the current resistance around $876.56, accompanied by strong buyer participation and increasing volume. Additionally, the RSI oscillator should break above the 60.68 level to validate the long setup.
🔴 Short Scenario:
A breakdown below the buy-side maker support zone between $819.69 – $808.06 could trigger a sharp downside move. Losing this zone may occur via a whale-driven move, so the preferred entry would be on the pullback after the breakdown.
🧠 Protect your capital first. No setup is worth blowing your account. If risk isn’t controlled, profit means nothing. Trade with rules, not emotions.

FireHoseReel | BNB Daily Analysis #24🔥 Welcome To FireHoseReel !
Let’s dive into Binance Coin (BNB) analysis.
👀 BNB 4H Overview
BNB formed a strong support around $820 and is now slowly moving upward with solid buy volume. The next key resistance lies at $876, where we need to observe price reaction closely.
📊 Volume Analysis
BNB buy volume has surged significantly. In a single small 4H candle, buyers accumulated around $771M worth of BNB, clearly defending this price zone.
✍️ BNB Trading Scenarios
🟢 Long Scenario:
A breakout above $876, supported by rising buy volume and an RSI move above 60.58, could provide a solid long setup.
🔴 Short Scenario:
A breakdown below the maker-buyer zone at $820, likely driven by whale activity, could open a short opportunity. Entries are preferred on the pullback, with stops placed above the lower high.
🧠 Protect your capital first. No setup is worth blowing your account. If risk isn’t controlled, profit means nothing. Trade with rules, not emotions.

BNB — Ascending Channels, Shakeout Pattern & Bull Market OutlookIn 2018 BNB formed a clear ascending channel. After moving inside this structure for several years, the market experienced a sharp shakeout in March 2020, which became the final capitulation before a major trend reversal. By late 2020 the price broke out above the channel, confirming the beginning of a strong bull market.
Since 2021 a new ascending channel has been forming. I expect a corrective move toward the lower boundary of this channel in the $300–$350 area. A similar shakeout to what happened in March 2020 may occur again around 2026, potentially acting as a final reset before the next major uptrend.
After this pullback, the next bullish phase could begin, with long-term targets in the $4,000–$5,000 range.
Key points:
2018: formation of the first ascending channel.
March 2020: sharp shakeout → final reset before the bull run.
Late 2020: breakout above the channel → start of the bullish cycle.
2021–present: formation of a new ascending channel.
Expected: retrace to $300–$350 + possible 2026 shakeout.
Long-term target: $4K–$5K after the new bull run begins.

FireHoseReel | BNB Daily Analysis #23🔥 Welcome To FireHoseReel !
Let’s dive into Binance Coin (BNB) analysis.
👀 BNB 4H Overview
BNB has broken its newly formed support, activating our pre-breakout trigger with a strong 4-hour candle. Price is now moving toward the bottom of the range.
📊 Volume Analysis
After breaking the multi-timeframe support highlighted in the previous analysis, BNB’s volume increased significantly. If selling pressure continues, price could extend its move toward the range low.
✍️ BNB Trading Scenarios
🟢 Long Scenario:
A break above $876, accompanied by rising buying volume, strong momentum, and a fakeout of the current zone, could offer a long opportunity. This setup is high risk, so if taking a long, a maximum risk of 0.25% is recommended.
🔴 Short Scenario:
Waiting for BNB to form a new structure and identify fresh trigger zones would be the more logical approach for short positions. We remain patient until clearer short setups appear.
🧠 Protect your capital first. No setup is worth blowing your account. If risk isn’t controlled, profit means nothing. Trade with rules, not emotions.

FireHoseReel | BNB Daily Analysis #22🔥 Welcome To FireHoseReel !
Let’s dive into BinanceCoin (BNB) analysis.
👀 BNB 1D Overview
On the daily timeframe, BNB is forming a trading range of roughly 10%. If this structure continues, it will likely develop into a clear daily box and consolidation zone. The upper boundary of this range is at $923, while the lower boundary is at $823.
📊 Volume Analysis
After printing an ATH at $1,376, BNB’s volume dropped sharply. With volume currently compressed, the next expansion in volume could trigger a move larger than expected.
✍️ BNB Trading Scenarios
🟢 Long Scenario 1:
A break above $923, which marks the top of the trading range, accompanied by strong buying volume confirmation, could provide a solid long setup on BNB.
🔴 Short Scenario:
A break below $823, the bottom of the trading range, confirmed by increasing selling volume, could offer a valid short opportunity on BNB.
🧠 Protect your capital first. No setup is worth blowing your account. If risk isn’t controlled, profit means nothing. Trade with rules, not emotions.

FireHoseReel | BNB Daily Analysis #21🔥 Welcome To FireHoseReel !
Let’s dive into BinanceCoin (BNB) analysis.
👀 BNB 4H Overview
BNB was trading inside a 4H range where I had marked two trigger zones. The short trigger was activated with a strong sell-off candle, and a new trigger zone has now formed around $849.
📊 Volume Analysis
After losing the multi-timeframe support at $877, BNB’s volume shifted into strong selling pressure. This sell pressure slowed down as market makers stepped in around the $850 area.
✍️ BNB Trading Scenarios
🟢 Long Scenario:
A breakout above the multi-timeframe resistance at $899, supported by rising buy volume, could activate the long trigger. If $923 breaks, the position can be held for continuation.
🔴 Short Scenario:
If the market maker buy zone fails and support at $849 is lost with renewed selling pressure, the short trigger will be activated.
🧠 Protect your capital first. No setup is worth blowing your account. If risk isn’t controlled, profit means nothing. Trade with rules, not emotions.

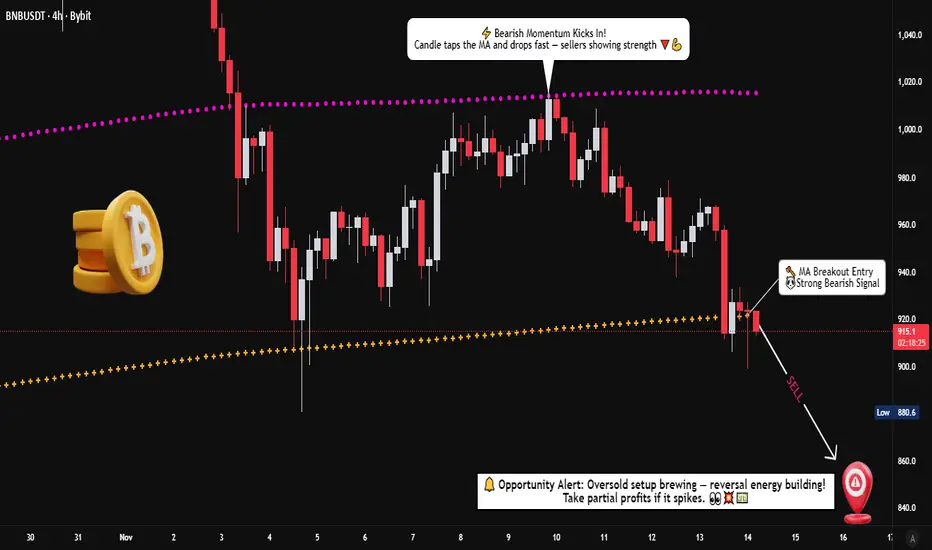
BNB/USDT – Momentum Shift Indicates Controlled Bearish Pressure📊 BNB/USDT: CRYPTO MARKET OPPORTUNITY BLUEPRINT | Swing Trade Analysis
🎯 TRADE SETUP OVERVIEW
Asset: BNB/USDT (Binance Coin vs Tether)
Timeframe: Swing Trade
Bias: 🔴 BEARISH | Confirmed via Weighted Moving Average Dynamic Support Breakout
📍 ENTRY STRATEGY: LAYERING METHOD
Entry Approach: Multiple Limit Order Layering (Dollar-Cost Average Entry Style)
Layer 1: $960.0 (Initial Entry)
Layer 2: $940.0 (Add Position)
Layer 3: $920.0 (Scale Entry)
💡 Customize layer levels based on your risk tolerance & capital allocation
🛑 STOP LOSS (SL)
Thief OG's SL Level: 🎪 $970.0
⚠️ CRITICAL: Place SL only after breakout confirmation is validated on price action
📌 Disclaimer: Adjust SL based on your personal strategy & risk management rules. This is YOUR capital at risk.
🎁 PROFIT TARGET (TP)
Target Level: 🏁 $850.0
Why This Level?
✅ Moving Average acts as strong resistance zone
✅ Overbought conditions present
✅ Previous support-turned-resistance trap identified
✅ Optimal risk-to-reward structure
📌 Disclaimer: This is a reference target. Take profits at YOUR discretion. Partial profit-taking recommended.
🔗 CORRELATED PAIRS TO MONITOR
Direct Correlations (High Impact)
1. ETH/USDT (Ethereum) - 📈 POSITIVE CORRELATION
Why Watch: BTC & ETH dominance typically drives altcoin movement
Key Point: If ETH breaks down, BNB often follows within 2-4 hours
Action: Use as confirmation signal for BNB downtrend continuation
2. BTC/USDT (Bitcoin) - 📈 POSITIVE CORRELATION
Why Watch: Bitcoin is the market leader; BNB is highly correlated
Key Point: Major Bitcoin support/resistance breaks precede BNB moves
Action: Monitor BTC for early trend reversal signals
3. BNB/BTC (Binance Coin vs Bitcoin) - 🔄 RELATIVE STRENGTH
Why Watch: Shows BNB's strength independently from Bitcoin
Key Point: If BNB/BTC weakens while BTC holds, downtrend is stronger
Action: Confirmation of bearish bias strength
Secondary Watch Pairs (Market Context)
4. USDT Dominance - 💰 INVERSE CORRELATION
Key Point: Rising USDT dominance = increased selling pressure on alts
Action: Check Tether flows into/out of BNB pairs
5. Crypto Fear & Greed Index - 📊 SENTIMENT INDICATOR
Why Watch: Extreme readings often precede reversals
Key Point: Greedy sentiment before drops = trap setup (like here)
Action: Validate bearish thesis with sentiment extremes
⚡ RISK MANAGEMENT CHECKLIST
✅ Breakout confirmation required before entry
✅ Risk:Reward ratio minimum 1:2 for this setup
✅ Position size = (Account Risk % × Capital) ÷ (Entry - SL)
✅ Scale entries across 3 layers to reduce slippage
✅ Monitor correlations for early exit signals
✅ Take profits in tiers: 33% at 900.0 | 33% at 875.0 | 34% at 850.0
📊 Summary
BNB has shifted into a bearish structure after losing dynamic support. With a layered entry method, flexible SL/TP management, and clear correlation signals across major crypto assets, this setup provides a properly structured swing opportunity for disciplined traders.
FireHoseReel | BNB Daily Analysis #20🔥 Welcome To FireHoseReel !
Let’s dive into BinanceCoin (BNB) analysis.
👀 BNB 1H Overview
BNB is currently trading inside a small 1-hour range. A breakout from this box could expand the move and transition price action into a 4H structure. On the 1H timeframe, BNB is still trading below its main long trigger zone.
📊 Volume Analysis
During the holiday period, BNB volume declined. However, as we approach the end of the holidays, any increase in volume during the breakout can act as confirmation and justify entering a trade.
✍️ BNB Trading Scenarios
🟢 Long Scenario:
A breakout above $899 with volume confirmation could offer an early long opportunity. If the major resistance at $923 breaks, this position can be held for continuation.
🔴 Short Scenario:
A breakdown below the newly formed support at $861, confirmed by volume, could trigger an early short setup. If price then loses $810, the move can be extended to the downside.
🧠 Protect your capital first. No setup is worth blowing your account. If risk isn’t controlled, profit means nothing. Trade with rules, not emotions.

FireHoseReel | BNB Daily Analysis #19🔥 Welcome To FireHoseReel !
Let’s dive into BinanceCoin (BNB) analysis.
👀 BNB 4H Overview
BNB is currently moving inside a consolidation box on the 4H timeframe, with volume steadily decreasing inside this range. A breakout from either the top or bottom of the box could trigger a strong move. Price is now approaching the key resistance at $915.
📊 Volume Analysis
Price pushed into resistance with a clear volume divergence, and after sellers stepped in with increased selling volume, BNB was rejected downward. If selling volume continues to rise, the newly-formed support zone may break, allowing price to move lower.
✍️ BNB Trading Scenarios
🟢 Long Scenario 1:
A breakout above $915 with strong buying volume and a volatility-range break above 61.63 can provide a solid long setup.
🔴 Short Scenario:
A breakdown of the newly-formed multi-timeframe support at $864, confirmed by increasing selling volume, can create a valid short opportunity.
🧠 Protect your capital first. No setup is worth blowing your account. If risk isn’t controlled, profit means nothing. Trade with rules, not emotions.

FireHoseReel | BNB Daily Analysis #19🔥 Welcome To FireHoseReel !
Let’s dive into BinanceCoin (BNB) analysis.
👀 BNB 4H Overview
BNB is currently trading inside a large 4H range box. A breakout from this box could trigger a major move.
The $922 level stands as both the top of the range and the 38% Fibonacci retracement of the previous bearish leg.
On the downside, $881 is acting as a freshly formed support zone.
📊 Volume Analysis
Volume slightly increased during the attempt to break $922, but buyers lacked enough strength and selling pressure followed.
A strong and sustained increase in volume will significantly raise the probability of a valid breakout.
✍️ BNB Trading Scenarios
🟢 Long Scenario 1:
A confirmed breakout above $922 creates a solid long opportunity.
Entry confirmation should come from a stable increase in buying volume.
🟢 Long Scenario 2:
You may enter on the 4th test using a stop-buy order with a wider stop, targeting around RR = 2.
⚠️ This type of entry should be executed with maximum 0.5% risk per trade to avoid heavy losses.
🔴 Short Scenario:
Since the broader structure behind price is strongly bearish, and the market previously experienced an aggressive drop from a distribution zone,
a break below the newly formed $881 support can activate a short position, confirmed by rising sell volume.
🧠 Protect your capital first. No setup is worth blowing your account. If risk isn’t controlled, profit means nothing. Trade with rules, not emotions.

FireHoseReel | BNB Daily Analysis #19🔥 Welcome To FireHoseReel !
Let’s dive into BinanceCoin (BNB) analysis.
👀 BNB 1H Overview
BNB reacted to its resistance yesterday and activated its long trigger. It is now still struggling with the same resistance zone, while we have slightly moved the resistance higher for the new trigger.
📊 Volume Analysis
BNB volume has formed a divergence with price. A clear resistance breakout requires rising buy volume for confirmation. Keep in mind that all valid breakouts need volume convergence—otherwise, a fakeout is very likely.
✍️ BNB Trading Scenarios
🟢 Long Scenario:
A breakout above the current resistance at $904, supported by increasing buy volume, could open a valid long setup.
🔴 Short Scenario:
A breakdown below the maker-buyer low at $877, confirmed with strong selling pressure on the 1H timeframe, could activate a short setup.
🧠 Protect your capital first. No setup is worth blowing your account. If risk isn’t controlled, profit means nothing. Trade with rules, not emotions.

FireHoseReel | BNB Daily Analysis #18🔥 Welcome To FireHoseReel !
Let’s dive into BinanceCoin (BNB) analysis.
👀 BNB 1H Overview
BNB is still holding the same position as yesterday, and due to the holiday period, the market hasn’t shown major changes. I’ve only adjusted the newly formed resistance slightly and moved it to $898.22.
📊 Volume Analysis
BNB volume was very low yesterday, but today it’s showing a moderate increase. Sundays usually bring more activity than Saturdays, so with rising volume, any trigger activation could lead to a faster move.
✍️ BNB Trading Scenarios
🟢 Long Scenario:
A breakout above the newly formed resistance at $898.22, supported by rising buy volume, could act as a risky long trigger. The next key long level lies around $922.57.
🔴 Short Scenario:
A 15-minute base has formed in this zone, which may offer a quick entry with a tight stop. The main short trigger is at $877.33—a confirmed break with volume could validate a short entry.
🧠 Protect your capital first. No setup is worth blowing your account. If risk isn’t controlled, profit means nothing. Trade with rules, not emotions.
